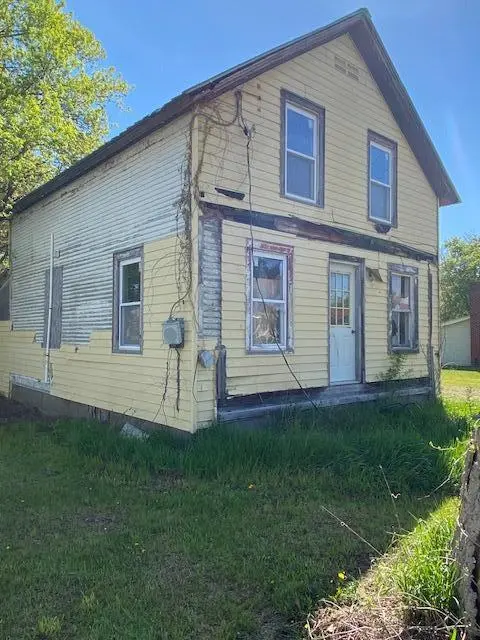
1864 Main St · Keeseville, NY
Flood risk 1/10 · Minimal
- FEMA flood zone
- X (unshaded)
- Chance of flooding over 30 yrs
- 0.0%
- Est. flood insurance / yr
- $473 – $860
Fire risk 1/10 · Minimal
- Est. fire insurance / yr
- $691 – $1,283
Heat risk 2/10 · Minimal
- Hot days now (above 94°F)
- 7 days/yr
- Hot days in 30 yrs
- 15 days/yr
Wind risk 1/10 · Minimal
- Chance of severe wind over 30 yrs
- 1.0%
Air-quality risk 2/10 · Minimal
- Unhealthy air days now
- 1 days/yr
- Unhealthy air days in 30 yrs
- 1 days/yr
Risk factors via First Street. Map © Google.
Why this score? — see what drove the B- grade
The composite is a weighted blend of 9 inputs, each scored 0–100. Each bar is that input's sub-score; the figure is the points it added to the 100-point composite (weight × sub-score).
- Cash flow +30.0/30.0
- 1% rule +10.0/10.0
- DSCR +10.0/10.0
- Schools +3.7/10.0
- Livability +3.2/5.0
- Appreciation +3.1/10.0
- Rent growth +2.5/5.0
- Condition / age +2.5/5.0
- ARV discount +0.0/15.0
$89,900
🖨 Deal sheet 📄 Offer letter ✓ Due diligence
Listing remarks
FIXER UPPERS AND FLIPPERS: this is your dream property! Although the house needs plenty of work, there has been some done to include some plumbing and subfloor work in the bathroom, newer metal roof, 100amp electrical service and wires. There are some new windows that have not been damaged along with all new steel doors although some damaged. Most importantly, this house is offered with TWO additional lots 316.9-1-7.1 and 316.9-1-7.2 both of which have access to Town water and sewer. This is your chance to renovate and perhaps build new or sell off the vacant lots. ROW for lots runs along east boundary.
Key facts
- Two additional lots
- New steel doors
- Access to town water
Tags
Property features AI
Exterior
- Utilities: Public water; Public sewer; Electricity available with 100 Amp service
- Home design: Single-family house; One and one-half levels; Residential property in fixer condition
- Construction: Built as a house (no year provided)
- Exterior features: Metal roof; Shed(s) on property
Interior
- Bathrooms: 1 full bathroom
- Interior features: Partial, unfinished basement
Neighborhood map
What this means for you Summary
Snapshot
- This is a 4-bed/1.0-bath single-family listed at $90k.
Deal economics
- At list price, monthly cash flow is $939 ($11k/yr) — positive.
- The deal already cash-flows at list — no discount required.
- Meets the 1% rule at list price ($2k rent vs $90k).
- Recommended offer: $87k (3.0% below list) — sets the bar for market timing.
- Cap rate 18.8% vs local median 5.8% in Keeseville — top-decile yield for the area; either an underpriced asset or a hidden risk that comps aren't pricing in. Stress-test before assuming the spread holds.
Location & tenants
- Location reads 65/100 on livability (#673 in NY) — a middle-class / working-renter tenant base. Strengths: cost of living A+, housing A+, crime A-; Watch: employment D, schools D-, amenities F.
- Ausable Valley Central School District (rural): math 36% / reading 51% proficiency, ranked #474 of 590 in NY (top 80%) — families likely to look elsewhere, expect single-tenant / working-renter base with shorter leases.
- Market conditions: 39 active listings in the ZIP; 192 units permitted in Clinton County in 2024 (64 in 5+ unit buildings).
Forward outlook
- Local home prices are declining (-3.0%/yr); year-one equity from $622 of loan paydown is wiped out by about $3k of value loss. Plan a longer hold.
- Clinton County population projected at -16% by 2050 — secular population decline; favor cash flow + early exit over multi-decade hold.
- At projected returns (-3.0% appreciation + 3.0% rent growth), your $25k cash investment doubles in ~3 years — after that, you're playing with house money.
Negotiation context
- It's been on market 32 days — a 3% lower offer ($87k) is reasonable based on typical stale-listing flexibility.
- Current owner paid $8k; list at $90k implies a 1099% gain — meaningful room to come down on a strong offer.
Risks & watch-outs
- Watch-outs: built in 1896 — expect roof / HVAC / electrical / plumbing capex.
Questions for the listing agent
- It's been on market 32 days. Have you received any prior offers? Is the seller open to a 3% concession, seller financing, or rate buy-down credit?
- Built in 1896 — when were the roof, HVAC, electrical panel, plumbing, and water heater last replaced?
- Is there a deadline driving the sale (1031 exchange, divorce, estate, relocation)? That informs how much negotiation room exists.
- Schools are D-rated, which usually means shorter tenancies and higher turnover. Who's the typical renter profile here, and what's been the actual vacancy rate?
- What's the average days-on-market for RENTAL listings here right now (not sales)? A rising rental-DOM trend means longer vacancies and softer asking-rent achievability than the comps imply.
- What's the recent tenant-quality profile in this submarket — average credit score on applications, eviction rate, late-payment / NSF rate, and stable-employment percentage? A property-management company in the area should have these aggregated.
- How much new for-sale + rental construction is in the pipeline within 1–3 miles? Heavy new supply typically softens prices + rents 12–24 months out; constrained supply supports both.
Investment metrics
- 1% rule
- 2.15% ✓
- Cap rate
- 18.83%
- Cash-on-cash
- 44.77%
- DSCR
- 2.99
- GRM
- 3.9
CMA / ARV
- ARV (on-the-fly)
- $69,782
- Comps found
- 1
Show comp detail 1 sale within ~0.75 mi
| Address | Dist | Beds/Ba | Sqft | Sold | Price | $/sf | Match |
|---|---|---|---|---|---|---|---|
| 28 Jackson Street St | 0.41mi | 3/1.0 (-1) | 913 (+7%) | 1mo | $75,000 | $82 | 62 |
Match score weights: distance 35% · size 25% · config 20% · recency 20%. Top-matched comps best support the ARV.
Projected returns pro-forma
-3.0% appreciation · 3.0% rent growth · sell at horizon
- IRR
- 41.8%
- Equity multiple
- 2.80×
- Total profit
- $45,259
- Equity at exit
- $13,404
- IRR
- 48.0%
- Equity multiple
- 5.63×
- Total profit
- $116,474
- Equity at exit
- $7,773
Cash invested: $25,172 (down + closing). Projections, not guarantees.
Landlord ↔ Tenant lean methodology
- Overall (STATE)
- 15 Strongly Tenant-Friendly
- State New York
- 15 Strongly Tenant-Friendly · D+10
- County
- — inherits STATE
- City
- — inherits STATE
ZIP-level market 12944
- Home prices YoY
- -1.7%
- Active inventory
- 39
- Price-to-rent
- 3.9×
Monthly cashflow live
- Estimated rent
- $1,935 medium interval (Pro) →
- Mortgage (P&I)
- −$471
- Tax from tax record
- −$81 /mo · $969/yr
- Insurance
- −$37
- HOA
- −$0
- Vacancy / Maint / Mgmt
- −$406
- Net cashflow
- $939
Break-even live
UW: 25.0% down · 7.5% · 30yr · 1.5% tax · 5.0% vac · 8.0% maint · 8.0% mgmt
Financing live
Cash to close
- Down payment
- $22,475
- Closing costs
- $2,697
- Reserves months
- —
- Total cash needed
- —
Loan-product check · same deal, 3 products live
Conventional
25% down · 7.5% · 30yr
- Down + closing
- —
- Monthly P&I
- —
- Monthly cashflow
- —
- DSCR
- —
- Eligible?
- —
Personal DTI + credit; lowest rate.
DSCR
20% down · 8.5% · 30yr
- Down + closing
- —
- Monthly P&I
- —
- Monthly cashflow
- —
- DSCR
- —
- Eligible?
- —
No personal income docs; deal must DSCR.
Hard money
10% down · 12.0% · 12mo
- Down + closing
- —
- Monthly P&I
- —
- Monthly cashflow
- —
- DSCR
- —
- Eligible?
- —
Short-term bridge; refi at stabilization.
Listing history 18 events
-
2026-06-19days on market $89,900 Active 32 DOM
-
2026-06-18days on market $89,900 Active 31 DOM
-
2026-06-17days on market $89,900 Active 30 DOM
-
2026-06-16days on market $89,900 Active 29 DOM
-
2026-06-15days on market $89,900 Active 28 DOM
-
2026-06-14days on market $89,900 Active 26 DOM
-
2026-06-13days on market $89,900 Active 25 DOM
-
2026-06-10days on market $89,900 Active 23 DOM
-
2026-06-09days on market $89,900 Active 22 DOM
-
2026-06-08days on market $89,900 Active 21 DOM
-
2026-06-07days on market $89,900 Active 20 DOM
-
2026-06-05days on market $89,900 Active 17 DOM
-
2026-06-02days on market $89,900 Active 15 DOM
-
2026-06-01days on market $89,900 Active 14 DOM
-
2026-05-31days on market $89,900 Active 13 DOM
-
2026-05-30days on market $89,900 Active 12 DOM
-
2026-05-18$89,900 Active
-
2001-09-27soldstatus $7,500
ⓘ Source: listings_history table (triggers on properties + properties_extension) + one-shot
backfill from property_details.listing_events for pre-trigger history.
Tax reassessment forecast NY · Partial reset (capped growth)
- Current annual tax
- $969 · $81/mo
- Projected year-2 tax
- $1,244 · $104/mo
- Expected delta
- +$275/yr (+$23/mo · 28.4%)
ⓘ Screening estimate from a state-policy table — verify with the county assessor before closing.
Climate risk First Street
- Flood 1/10 Low FEMA zone X (unshaded) · 0% chance over 30 yrs
- Wildfire 1/10 Low
- Heat 2/10 Low 7 d/yr ≥94°F today · 15 d/yr by 30 yrs out
- Wind 1/10 Low 100% chance of damaging wind over 30 yrs
- Air quality 2/10 Low 1 unhealthy d/yr today · 1 by 30 yrs out
Nearby sold comps map
Loading sold comps map…
Walkable amenities ~0.75 mi
Loading nearby amenities…
Taxation est. · year 1
- Rental income
- $23,223
- − Mortgage interest
- −$5,036
- − Property taxes
- −$969
- − Insurance
- −$450
- − Repairs & maintenance
- −$1,858
- − Management
- −$1,858
- − Depreciation
- −$2,615
- Taxable income
- $10,438
- Est. tax owed @ 24.0%
- −$2,505
- After-tax cash flow
- $8,765/yr
For passive investors: Depreciation is non-cash, so a rental often shows a tax loss while cash-flowing — sheltering income. Rental losses are passive: they offset passive income freely, and up to $25,000/yr can offset ordinary (W-2) income if you actively participate and your MAGI is under $100k (phasing out to $0 by $150k); unused losses carry forward. On sale, claimed depreciation is recaptured at up to 25%, and gains may owe capital-gains tax (a 1031 exchange can defer both). Figures are a year-1 estimate at your 24.0% rate — not tax advice; consult a CPA.
Schools (NCES district)
- District
- Ausable Valley Central School District
- NCES district ID
- 3616170
- Math proficiency
- 36% ▼ -14.00%
- Reading proficiency
- 51% ▲ 5.00%
- Median HH income
- $50,989
- Composite
- 37.43/100
- National rank
- #4417
- State rank
- #474 of 590 in NY
Livability — Keeseville
- Score
- 65/100
- State rank
- #673
- US rank
- #12604
Category grades
Schools grade is shown separately in the Schools card above.
Census & demographics
- Census place
- Keeseville, NY
- Population (ZIP)
- 4,043
Population outlook (Clinton County) Hauer SSP2
- Today (2025)
- 78,791 people
- By 2030
- 76,848 · -2.5%
- By 2040
- 71,579 · -9.2%
- By 2050
- 66,471 · -15.6%
- By 2075
- 57,361 · -27.2%
- By 2100
- 47,232 · -40.1%
Race, ethnicity, and origin ACS 2023
- Neighborhood character
- Predominantly White (96%)
- Race & ethnicity
- White 96% Hispanic / Latino 2% Two or more races 2%
- Common ancestry
- Lithuanian 20% Romanian 1% Slovak 1%
- Foreign-born
- 2% · Canada
- Languages at home
- 97% English-only · Spanish 1% Other Indo-European 1%
Political lean MEDSL · Clinton
- 2024 margin
- Toss-up / Even · D 48.9% · R 51.1%
- 2008→2024 swing
- -25.1pp toward R · 2008: 22.9pp · 2024: -2.2pp
- All cycles
- 2024: R+2.2 2020: D+5.2 2016: D+0.9 2012: D+25.6 2008: D+22.9
Not yet ingested
- Civics
- —
Market trends
- HPI YoY
- ▼ -3.79%
- Current HPI
- 220.0385
- Rent YoY
- —
- Metro
- —
- State GDP YoY
- ▲ 2.60%
- F500 in state
- 92
Industry mix (Fortune 500 HQ in NY)
| Industry | F500 HQs | Revenue |
|---|---|---|
| Financial Services | 10 | $950B |
|
||
| Consumer Goods | 9 | $162B |
|
||
| Insurance | 4 | $225B |
|
||
| Telecommunications | 2 | $144B |
|
||
| Pharmaceuticals | 2 | $112B |
|
||
| Media / Entertainment | 2 | $69B |
|
||
Price history
+1098.7% since first listed2 events — show timeline
- 2026-05-18 Listed $89,900 ACVMLS
- 2001-09-27 Sold (Public Records) $7,500 Public Records
Property tax history
+0.1%/yrLatest (2025): $969 · +13.0% YoY. Source: county tax records.
Cash-flow waterfall
monthlySold comps — $/sqft
last 12 mo · ≤1 miLoading sold comps…