 🏗️ New Construction
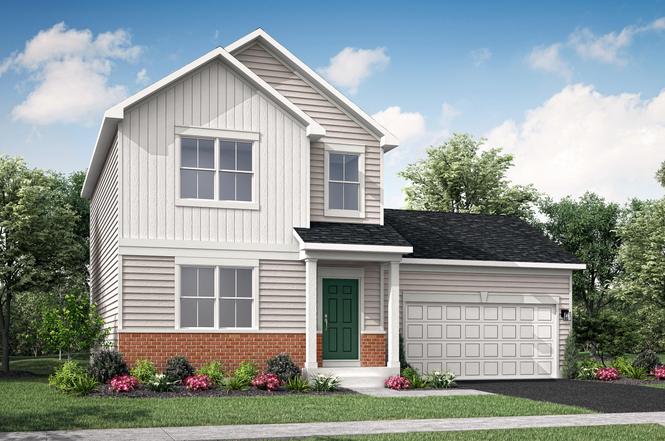
17772 Hillside Dr · Lowell, IN
Flood risk 1/10 · Minimal
- FEMA flood zone
- X (unshaded)
- Chance of flooding over 30 yrs
- 0.0%
- Est. flood insurance / yr
- $507 – $1,088
Fire risk 1/10 · Minimal
- Est. fire insurance / yr
- $717 – $1,331
Heat risk 2/10 · Minimal
- Hot days now (above 101°F)
- 7 days/yr
- Hot days in 30 yrs
- 16 days/yr
Wind risk 2/10 · Minimal
- Chance of severe wind over 30 yrs
- 1.0%
Air-quality risk 2/10 · Minimal
- Unhealthy air days now
- 1 days/yr
- Unhealthy air days in 30 yrs
- 2 days/yr
Risk factors via First Street. Map © Google.
Why this score? — see what drove the D grade
The composite is a weighted blend of 9 inputs, each scored 0–100. Each bar is that input's sub-score; the figure is the points it added to the 100-point composite (weight × sub-score).
- Cash flow +13.3/30.0
- ARV discount +7.5/15.0
- Schools +4.5/10.0
- DSCR +4.0/10.0
- Livability +3.8/5.0
- 1% rule +3.7/10.0
- Rent growth +2.5/5.0
- Condition / age +2.5/5.0
- Appreciation +0.0/10.0
$339,503
🖨 Deal sheet 📄 Offer letter ✓ Due diligence
Listing remarks
SPECIAL FINANCING AVAILABLE! READY FOR MARCH DELIVERY! Homesite #0200. Discover modern living in the beautifully designed Essex plan. This refined single-family home offers 3 bedrooms, 2.5 baths, and a spacious open-concept main floor that seamlessly connects the kitchen, dining, and family areas--perfect for everyday living and entertaining. The gourmet kitchen features a large center island, quartz countertops, ample cabinetry, and stainless steel appliances. Elegant finishes include luxury vinyl plank flooring, energy-efficient LED lighting, and contemporary design details throughout. Upstairs, the serene owner's suite features a walk-in closet and spa-inspired en-suite bath. Two additio
Key facts
- Quartz countertops
- Large center island
- Ample cabinetry
Tags
Neighborhood map
What this means for you Summary
Snapshot
- This is a 3-bed/2.5-bath single-family listed at $340k.
Deal economics
- At list price, monthly cash flow is $0 ($-1/yr) — negative.
- To cash-flow at today's rent, offer at most $320k (5.7% below list).
- To meet the 1% rule (rent ≥ 1% of price), the offer needs to be $280k (17.5% below list).
- Recommended offer: $280k (17.5% below list) — sets the bar for 1% rule.
- Cap rate 6.3% vs local median 3.9% in Lowell — top-decile yield for the area; either an underpriced asset or a hidden risk that comps aren't pricing in. Stress-test before assuming the spread holds.
Location & tenants
- Location reads 76/100 on livability (#51 in IN, #3,455 nationally) — a middle-class / working-renter tenant base. Strengths: crime A+, cost of living A+, housing A+; Watch: health & safety C-, amenities F, commute F.
- Tri-Creek School Corporation (town): math 46% / reading 56% proficiency, ranked #39 of 301 in IN (top 13%) — acceptable for families but not a draw, mixed tenant base, ~2y average lease.
- Zoned schools: Three Creeks Elem School (math 55% / reading 48%, grade C-, #256 of 994 statewide, top 26%, 515 students, 30% FRL); Lowell Middle School (math 36% / reading 54%, grade D, #81 of 330 statewide, top 25%, 742 students, 33% FRL); Lowell Senior High School (math 31% / reading 75%, grade C-, #99 of 369 statewide, top 27%, 1,033 students, 29% FRL).
- Market conditions: 350 active listings in the ZIP; 1 comparable units currently listed for rent nearby; 1,642 units permitted in Lake County in 2024 (14 in 5+ unit buildings).
Forward outlook
- Local home prices are declining (-3.0%/yr); year-one equity from $2k of loan paydown is wiped out by about $10k of value loss. Plan a longer hold.
- Lake County population projected to shrink 7% by 2050 — rents likely to lag national; underwrite the cash flow, not the appreciation.
Negotiation context
- It's been on market 28 days — a 2% lower offer ($334k) is reasonable based on typical stale-listing flexibility.
Questions for the listing agent
- What do current leases actually rent for vs. the listed asking? Can we see a recent rent roll and the last 12 months of T-12 income?
- Is there a deadline driving the sale (1031 exchange, divorce, estate, relocation)? That informs how much negotiation room exists.
- The area grade is low — what's the realistic commute time and amenity access for the typical tenant pool here? Any planned neighborhood developments (good or bad) we should know about?
- What's the average days-on-market for RENTAL listings here right now (not sales)? A rising rental-DOM trend means longer vacancies and softer asking-rent achievability than the comps imply.
- What's the recent tenant-quality profile in this submarket — average credit score on applications, eviction rate, late-payment / NSF rate, and stable-employment percentage? A property-management company in the area should have these aggregated.
- How much new for-sale + rental construction is in the pipeline within 1–3 miles? Heavy new supply typically softens prices + rents 12–24 months out; constrained supply supports both.
Investment metrics
- 1% rule
- 0.87% ✗
- Cap rate
- 6.29%
- Cash-on-cash
- -0.00%
- DSCR
- 1.00
- GRM
- 9.5
CMA / ARV
- ARV (on-the-fly)
- $320,087
- Comps found
- 12
Show comp detail 12 sales within ~0.75 mi
| Address | Dist | Beds/Ba | Sqft | Sold | Price | $/sf | Match |
|---|---|---|---|---|---|---|---|
| 17772 Hillside Dr | 0.00mi | 3/2.5 | 1,517 (0%) | 1mo | $319,503 | $211 | 99 |
| 17790 Hillside Dr | 0.04mi | 3/2.5 | 1,517 (0%) | 2mo | $311,352 | $205 | 97 |
| 17777 Violette Way | 0.05mi | 3/2.5 | 1,517 (0%) | 5mo | $308,000 | $203 | 94 |
| 17801 Violette Ln | 0.10mi | 3/2.5 | 1,517 (0%) | 4mo | $315,000 | $208 | 92 |
| 17792 Violette Way | 0.09mi | 3/2.5 | 1,517 (0%) | 7mo | $314,000 | $207 | 90 |
| 17789 Violette Way | 0.04mi | 3/2.0 | 1,455 (-4%) | 2mo | $345,000 | $237 | 88 |
| 17807 Violette Ln | 0.07mi | 3/2.0 | 1,455 (-4%) | 3mo | $346,304 | $238 | 86 |
| 17769 Hillside Dr | 0.04mi | 3/2.5 | 1,600 (+6%) | 7mo | $298,240 | $186 | 83 |
| 17808 Hillside Dr | 0.08mi | 3/2.5 | 1,637 (+8%) | 1mo | $357,901 | $219 | 82 |
| 17783 Violette Way | 0.04mi | 3/2.5 | 1,637 (+8%) | 5mo | $345,601 | $211 | 81 |
| 17805 Hillside Dr | 0.09mi | 3/2.5 | 1,600 (+6%) | 8mo | $311,990 | $195 | 80 |
| 17798 Violette Ln | 0.11mi | 3/2.5 | 1,637 (+8%) | 6mo | $359,466 | $220 | 77 |
Match score weights: distance 35% · size 25% · config 20% · recency 20%. Top-matched comps best support the ARV.
Projected returns pro-forma
-3.0% appreciation · 3.0% rent growth · sell at horizon
- IRR
- -16.3%
- Equity multiple
- 0.42×
- Total profit
- $-51,829
- Equity at exit
- $47,726
- IRR
- -8.0%
- Equity multiple
- 0.50×
- Total profit
- $-44,964
- Equity at exit
- $27,675
Cash invested: $89,624 (down + closing). Projections, not guarantees.
Landlord ↔ Tenant lean methodology
- Overall (STATE)
- 90 Strongly Landlord-Friendly
- State Indiana
- 90 Strongly Landlord-Friendly · R+11
- County
- — inherits STATE
- City
- — inherits STATE
ZIP-level market 46356
- Home prices YoY
- -30.1%
- Active inventory
- 350
- Price-to-rent
- 10.1×
Monthly cashflow live
- Estimated rent
- $2,800 medium interval (Pro) →
- Mortgage (P&I)
- −$1,679
- Tax est. 1.5%
- −$400 /mo · $4,801/yr
- Insurance
- −$133
- HOA
- −$0
- Vacancy / Maint / Mgmt
- −$588
- Net cashflow
- $-0
Break-even live
UW: 25.0% down · 7.5% · 30yr · 1.5% tax · 5.0% vac · 8.0% maint · 8.0% mgmt
Financing live
Cash to close
- Down payment
- $80,022
- Closing costs
- $9,603
- Reserves months
- —
- Total cash needed
- —
Loan-product check · same deal, 3 products live
Conventional
25% down · 7.5% · 30yr
- Down + closing
- —
- Monthly P&I
- —
- Monthly cashflow
- —
- DSCR
- —
- Eligible?
- —
Personal DTI + credit; lowest rate.
DSCR
20% down · 8.5% · 30yr
- Down + closing
- —
- Monthly P&I
- —
- Monthly cashflow
- —
- DSCR
- —
- Eligible?
- —
No personal income docs; deal must DSCR.
Hard money
10% down · 12.0% · 12mo
- Down + closing
- —
- Monthly P&I
- —
- Monthly cashflow
- —
- DSCR
- —
- Eligible?
- —
Short-term bridge; refi at stabilization.
Rent comps 1 comps
| Address | Beds | Baths | Sqft | Rent | $/sqft | DOM | Units | Dist |
|---|---|---|---|---|---|---|---|---|
| 4507 W 173rd Ave Lowell, IN | 4.0 | 3.0 | 1900 | $2,800 | $1.47 | 18d | 1 | 0.64mi |
Listing history 3 events
-
2026-03-27status Pending
-
2026-03-03price $339,503
-
2026-02-27$335,503 Active
ⓘ Source: listings_history table (triggers on properties + properties_extension) + one-shot
backfill from property_details.listing_events for pre-trigger history.
Climate risk First Street
- Flood 1/10 Low FEMA zone X (unshaded) · 0% chance over 30 yrs
- Wildfire 1/10 Low
- Heat 2/10 Low 7 d/yr ≥101°F today · 16 d/yr by 30 yrs out
- Wind 2/10 Low 100% chance of damaging wind over 30 yrs
- Air quality 2/10 Low 1 unhealthy d/yr today · 2 by 30 yrs out
Nearby sold comps map
Loading sold comps map…
Walkable amenities ~0.75 mi
Loading nearby amenities…
Taxation est. · year 1
- Rental income
- $33,600
- − Mortgage interest
- −$17,930
- − Property taxes
- −$4,801
- − Insurance
- −$1,600
- − Repairs & maintenance
- −$2,688
- − Management
- −$2,688
- − Depreciation
- −$9,312
- Taxable loss
- −$5,419
- Est. tax savings @ 24.0%
- +$1,301
- After-tax cash flow
- $1,300/yr
For passive investors: Depreciation is non-cash, so a rental often shows a tax loss while cash-flowing — sheltering income. Rental losses are passive: they offset passive income freely, and up to $25,000/yr can offset ordinary (W-2) income if you actively participate and your MAGI is under $100k (phasing out to $0 by $150k); unused losses carry forward. On sale, claimed depreciation is recaptured at up to 25%, and gains may owe capital-gains tax (a 1031 exchange can defer both). Figures are a year-1 estimate at your 24.0% rate — not tax advice; consult a CPA.
Schools (NCES district)
- District
- Tri-Creek School Corporation
- NCES district ID
- 1811460
- Math proficiency
- 46% ▼ -8.00%
- Reading proficiency
- 56% ▼ -5.00%
- Median HH income
- $64,614
- Composite
- 44.97/100
- National rank
- #2704
- State rank
- #39 of 301 in IN
Livability — Lowell
- Score
- 76/100
- State rank
- #51
- US rank
- #3455
Category grades
Schools grade is shown separately in the Schools card above.
Census & demographics
- Census place
- Lowell, IN
- City population
- 19,396
- Population (ZIP)
- 19,396
Population outlook (Lake County) Hauer SSP2
- Today (2025)
- 484,026 people
- By 2030
- 478,091 · -1.2%
- By 2040
- 462,974 · -4.3%
- By 2050
- 449,894 · -7.1%
- By 2075
- 436,169 · -9.9%
- By 2100
- 426,607 · -11.9%
Race, ethnicity, and origin ACS 2023
- Neighborhood character
- Predominantly White (88%)
- Race & ethnicity
- White 88% Hispanic / Latino 9% Two or more races 6%
- Hispanic origin (detail)
- Mexican 8%
- Common ancestry
- Romanian 16% Iranian 10% Lithuanian 2%
- Foreign-born
- 4% · Canada
- Languages at home
- 95% English-only · Spanish 4% Russian/Polish/Slavic 1%
Political lean MEDSL · Lake
- 2024 margin
- Lean D (+5.6) · D 52.1% · R 46.5% · Other 1.5%
- 2008→2024 swing
- -28.6pp toward R · 2008: 34.3pp · 2024: 5.6pp
- All cycles
- 2024: D+5.6 2020: D+15.1 2016: D+20.6 2012: D+31.0 2008: D+34.3
Not yet ingested
- Civics
- —
Market trends
- HPI YoY
- ▼ -110.73%
- Current HPI
- 256.6224
- Rent YoY
- —
- Metro
- —
- State GDP YoY
- ▲ 2.90%
- F500 in state
- 18
Industry mix (Fortune 500 HQ in IN)
| Industry | F500 HQs | Revenue |
|---|---|---|
| Industrial Machinery | 2 | $37B |
|
||
| Healthcare | 1 | $177B |
|
||
| Pharmaceuticals | 1 | $45B |
|
||
| Metals / Steel | 1 | $18B |
|
||
| Agriculture | 1 | $17B |
|
||
| Packaging | 1 | $12B |
|
||
Price history
+1.2% since first listed3 events — show timeline
- 2026-03-27 Pending — NIRA MLS as Distributed by MLS Grid
- 2026-03-03 Price Changed $339,503 NIRA MLS as Distributed by MLS Grid
- 2026-02-27 Listed $335,503 NIRA MLS as Distributed by MLS Grid
Cash-flow waterfall
monthlySold comps — $/sqft
last 12 mo · ≤1 miLoading sold comps…