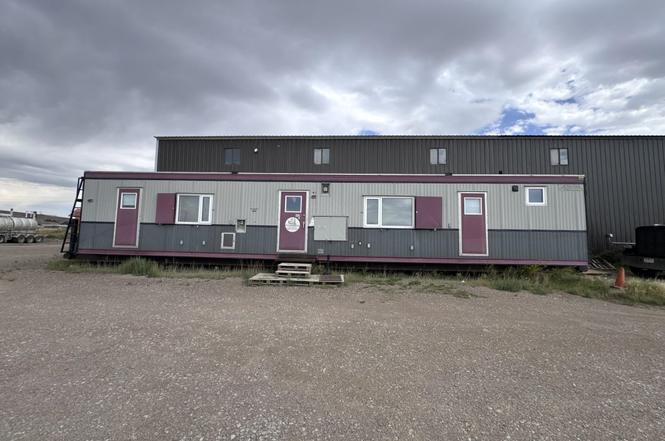
Mobile Only · Rawlins, WY
Flood risk No data
- FEMA flood zone
- —
- Chance of flooding over 30 yrs
- —
- Est. flood insurance / yr
- —
Fire risk No data
- Est. fire insurance / yr
- —
Heat risk 2/10 · Minimal
- Hot days now (above threshold)
- 5 days/yr
- Hot days in 30 yrs
- 14 days/yr
Wind risk No data
- Chance of severe wind over 30 yrs
- —
Air-quality risk 1/10 · Minimal
- Unhealthy air days now
- 0 days/yr
- Unhealthy air days in 30 yrs
- 0 days/yr
Risk factors via First Street. Map © Google.
Why this score? — see what drove the B- grade
The composite is a weighted blend of 9 inputs, each scored 0–100. Each bar is that input's sub-score; the figure is the points it added to the 100-point composite (weight × sub-score).
- Cash flow +30.0/30.0
- 1% rule +10.0/10.0
- DSCR +10.0/10.0
- ARV discount +7.5/15.0
- Schools +3.8/10.0
- Livability +3.5/5.0
- Rent growth +2.5/5.0
- Condition / age +2.5/5.0
- Appreciation +0.0/10.0
$29,999
🖨 Deal sheet 📄 Offer letter ✓ Due diligence
Key facts
- Built 2006
- Listed 106 days
Property features AI
Exterior
- Parking: No garage
- Utilities: Holding tank sewer
- Home design: Residential mobile home (manufactured detached)
- Exterior features: Aluminum roof
Interior
- Flooring: Carpet; Vinyl
- Heating & cooling: Forced air heating
- Interior features: Carpet flooring; Vinyl flooring; Forced air heating
Neighborhood map
What this means for you Summary
Snapshot
- This is a 2-bed/2.0-bath manufactured listed at $30k.
Deal economics
- At list price, monthly cash flow is $589 ($7k/yr) — positive.
- The deal already cash-flows at list — no discount required.
- Meets the 1% rule at list price ($1k rent vs $30k).
- Recommended offer: $27k (9.0% below list) — sets the bar for market timing.
- Cap rate 29.8% vs local median 4.1% in Rawlins — top-decile yield for the area; either an underpriced asset or a hidden risk that comps aren't pricing in. Stress-test before assuming the spread holds.
Location & tenants
- Location reads 70/100 on livability (#31 in WY) — a middle-class / working-renter tenant base. Strengths: cost of living A+, housing A+, crime A-; Watch: schools D, amenities F, commute F.
- Carbon County School District #1 (town): math 39% / reading 48% proficiency, ranked #35 of 41 in WY (top 85%) — families likely to look elsewhere, expect single-tenant / working-renter base with shorter leases.
- Market conditions: 92 active listings in the ZIP; 40 units permitted in Carbon County in 2024 (0 in 5+ unit buildings).
Forward outlook
- Local home prices are declining (-3.0%/yr); year-one equity from $207 of loan paydown is wiped out by about $900 of value loss. Plan a longer hold.
- Carbon County population projected to shrink 6% by 2050 — rents likely to lag national; underwrite the cash flow, not the appreciation.
- At projected returns (-3.0% appreciation + 3.0% rent growth), your $8k cash investment doubles in ~2 years — after that, you're playing with house money.
Negotiation context
- It's been on market 107 days — a 9% lower offer ($27k) is reasonable based on typical stale-listing flexibility.
- 2 sale attempts; this cycle's ask has dropped $5k (14%) from the opening price — seller is motivated, your offer sets the floor, not the list.
Questions for the listing agent
- It's been on market 107 days. Have you received any prior offers? Is the seller open to a 9% concession, seller financing, or rate buy-down credit?
- Why hasn't it sold? Are there any deal-killer items the seller is aware of (foundation, flood, title, zoning, code violations)?
- Is there a deadline driving the sale (1031 exchange, divorce, estate, relocation)? That informs how much negotiation room exists.
- Schools are D-rated, which usually means shorter tenancies and higher turnover. Who's the typical renter profile here, and what's been the actual vacancy rate?
- What's the average days-on-market for RENTAL listings here right now (not sales)? A rising rental-DOM trend means longer vacancies and softer asking-rent achievability than the comps imply.
- What's the recent tenant-quality profile in this submarket — average credit score on applications, eviction rate, late-payment / NSF rate, and stable-employment percentage? A property-management company in the area should have these aggregated.
- How much new for-sale + rental construction is in the pipeline within 1–3 miles? Heavy new supply typically softens prices + rents 12–24 months out; constrained supply supports both.
Investment metrics
- 1% rule
- 3.36% ✓
- Cap rate
- 29.84%
- Cash-on-cash
- 84.10%
- DSCR
- 4.74
- GRM
- 2.5
CMA / ARV
No comps found within radius.
Projected returns pro-forma
-3.0% appreciation · 3.0% rent growth · sell at horizon
- IRR
- 84.5%
- Equity multiple
- 4.89×
- Total profit
- $32,645
- Equity at exit
- $4,473
- IRR
- 87.7%
- Equity multiple
- 10.14×
- Total profit
- $76,765
- Equity at exit
- $2,594
Cash invested: $8,400 (down + closing). Projections, not guarantees.
Landlord ↔ Tenant lean methodology
- Overall (STATE)
- 90 Strongly Landlord-Friendly
- State Wyoming
- 90 Strongly Landlord-Friendly · R+25
- County
- — inherits STATE
- City
- — inherits STATE
ZIP-level market 82301
- Active inventory
- 92
- Price-to-rent
- 2.5×
Monthly cashflow live
- Estimated rent
- $1,008 medium interval (Pro) →
- Mortgage (P&I)
- −$157
- Tax est. 1.5%
- −$37 /mo · $450/yr
- Insurance
- −$12
- HOA
- −$0
- Vacancy / Maint / Mgmt
- −$212
- Net cashflow
- $589
Break-even live
UW: 25.0% down · 7.5% · 30yr · 1.5% tax · 5.0% vac · 8.0% maint · 8.0% mgmt
Financing live
Cash to close
- Down payment
- $7,500
- Closing costs
- $900
- Reserves months
- —
- Total cash needed
- —
Loan-product check · same deal, 3 products live
Conventional
25% down · 7.5% · 30yr
- Down + closing
- —
- Monthly P&I
- —
- Monthly cashflow
- —
- DSCR
- —
- Eligible?
- —
Personal DTI + credit; lowest rate.
DSCR
20% down · 8.5% · 30yr
- Down + closing
- —
- Monthly P&I
- —
- Monthly cashflow
- —
- DSCR
- —
- Eligible?
- —
No personal income docs; deal must DSCR.
Hard money
10% down · 12.0% · 12mo
- Down + closing
- —
- Monthly P&I
- —
- Monthly cashflow
- —
- DSCR
- —
- Eligible?
- —
Short-term bridge; refi at stabilization.
Listing history 19 events
-
2026-06-19days on market $29,999 Active 107 DOM
-
2026-06-18days on market $29,999 Active 106 DOM
-
2026-06-17days on market $29,999 Active 105 DOM
-
2026-06-16days on market $29,999 Active 104 DOM
-
2026-06-15days on market $29,999 Active 103 DOM
-
2026-06-14days on market $29,999 Active 101 DOM
-
2026-06-12days on market $29,999 Active 100 DOM
-
2026-06-09days on market $29,999 Active 97 DOM
-
2026-06-08days on market $29,999 Active 96 DOM
-
2026-06-07days on market $29,999 Active 95 DOM
-
2026-06-03days on market $29,999 Active 91 DOM
-
2026-06-02days on market $29,999 Active 90 DOM
-
2026-06-01days on market $29,999 Active 89 DOM
-
2026-05-31days on market $29,999 Active 88 DOM
-
2026-05-30days on market $29,999 Active 87 DOM
-
2026-04-18price $29,999
-
2026-03-04$34,999 Active
-
2025-10-01price $34,999
-
2025-07-25$39,999 Active
ⓘ Source: listings_history table (triggers on properties + properties_extension) + one-shot
backfill from property_details.listing_events for pre-trigger history.
Climate risk First Street
- Heat 2/10 Low
- Air quality 1/10 Low 0 unhealthy d/yr today · 0 by 30 yrs out
Nearby sold comps map
Loading sold comps map…
Walkable amenities ~0.75 mi
Loading nearby amenities…
Taxation est. · year 1
- Rental income
- $12,091
- − Mortgage interest
- −$1,680
- − Property taxes
- −$450
- − Insurance
- −$150
- − Repairs & maintenance
- −$967
- − Management
- −$967
- − Depreciation
- −$873
- Taxable income
- $7,003
- Est. tax owed @ 24.0%
- −$1,681
- After-tax cash flow
- $5,383/yr
For passive investors: Depreciation is non-cash, so a rental often shows a tax loss while cash-flowing — sheltering income. Rental losses are passive: they offset passive income freely, and up to $25,000/yr can offset ordinary (W-2) income if you actively participate and your MAGI is under $100k (phasing out to $0 by $150k); unused losses carry forward. On sale, claimed depreciation is recaptured at up to 25%, and gains may owe capital-gains tax (a 1031 exchange can defer both). Figures are a year-1 estimate at your 24.0% rate — not tax advice; consult a CPA.
Schools (NCES district)
- District
- Carbon County School District #1
- NCES district ID
- 5601030
- Math proficiency
- 39% ▼ -4.00%
- Reading proficiency
- 48% ▲ 3.00%
- Median HH income
- $59,074
- Composite
- 38.23/100
- National rank
- #4248
- State rank
- #35 of 41 in WY
Livability — Rawlins
- Score
- 70/100
- State rank
- #31
- US rank
- #7516
Category grades
Schools grade is shown separately in the Schools card above.
Census & demographics
- Census place
- Rawlins, WY
- County
- Carbon County · 8,180 people
- City population
- 8,180
- Metro
- Rock Springs, WY
- Population (ZIP)
- 8,180
- Household income
- $62,841
- Rent vs Own
- Severe rent burden
- 163.0
Population outlook (Carbon County) Hauer SSP2
- Today (2025)
- 15,217 people
- By 2030
- 14,977 · -1.6%
- By 2040
- 14,430 · -5.2%
- By 2050
- 14,381 · -5.5%
- By 2075
- 14,566 · -4.3%
- By 2100
- 13,729 · -9.8%
Race, ethnicity, and origin ACS 2023
- Neighborhood character
- Predominantly White (70%)
- Race & ethnicity
- White 70% Hispanic / Latino 24% Two or more races 9% Black 2% Asian 1%
- Hispanic origin (detail)
- Mexican 19%
- Common ancestry
- Portuguese 3% Slovak 2% Scottish 2%
- Foreign-born
- 6% · Canada
- Languages at home
- 85% English-only · Spanish 12% Other Indo-European 1% German/W. Germanic 1%
Political lean MEDSL · Carbon
- 2024 margin
- Solid R (+58.1) · D 20.1% · R 78.3% · Other 1.6%
- 2008→2024 swing
- -29.0pp toward R · 2008: -29.1pp · 2024: -58.1pp
- All cycles
- 2024: R+58.1 2020: R+53.8 2016: R+50.5 2012: R+31.6 2008: R+29.1
Not yet ingested
- Civics
- —
Market trends
- HPI YoY
- ▼ -202.83%
- Current HPI
- 139.787
- Rent YoY
- —
- Metro
- Rock Springs, WY
- State GDP YoY
- —
- F500 in state
- 0
Price history
-25.0% since first listed4 events — show timeline
- 2026-04-18 Price Changed $29,999 WMLS
- 2026-03-04 Listed $34,999 WMLS
- 2025-10-01 Price Changed $34,999 WMLS
- 2025-07-25 Listed $39,999 WMLS
Cash-flow waterfall
monthlySold comps — $/sqft
last 12 mo · ≤1 miLoading sold comps…