 Duplex
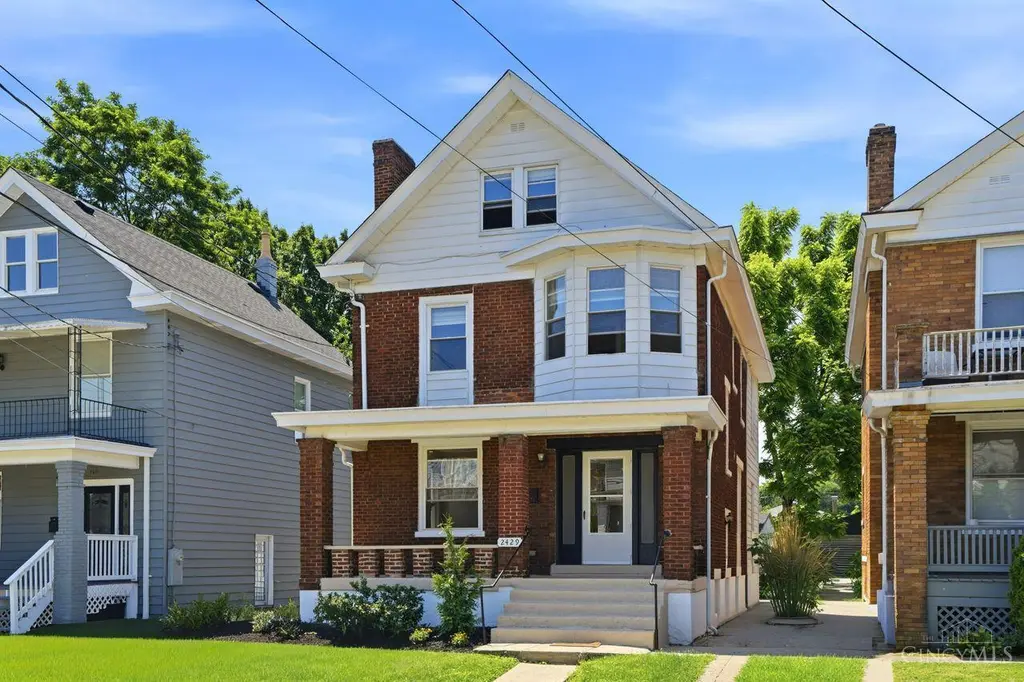
2429 Robertson Ave · Norwood, OH
Flood risk 1/10 · Minimal
- FEMA flood zone
- X (unshaded)
- Chance of flooding over 30 yrs
- 0.0%
- Est. flood insurance / yr
- $473 – $860
Fire risk 1/10 · Minimal
- Est. fire insurance / yr
- $713 – $1,323
Heat risk 5/10 · Moderate
- Hot days now (above 103°F)
- 7 days/yr
- Hot days in 30 yrs
- 19 days/yr
Wind risk 2/10 · Minimal
- Chance of severe wind over 30 yrs
- 1.0%
Air-quality risk 4/10 · Minor
- Unhealthy air days now
- 4 days/yr
- Unhealthy air days in 30 yrs
- 5 days/yr
Risk factors via First Street. Map © Google.
Why this score? — see what drove the D+ grade
The composite is a weighted blend of 9 inputs, each scored 0–100. Each bar is that input's sub-score; the figure is the points it added to the 100-point composite (weight × sub-score).
- Cash flow +15.2/30.0
- ARV discount +11.3/15.0
- DSCR +4.7/10.0
- Livability +4.0/5.0
- Schools +3.7/10.0
- 1% rule +3.6/10.0
- Rent growth +2.6/5.0
- Condition / age +2.5/5.0
- Appreciation +0.0/10.0
$435,000
🖨 Deal sheet (PDF) 📄 Offer letter ✓ Due diligence
Multi-family units
County records classify this as Multi-Family (2-4 Unit). Listing-text estimate: 2 units. confirmed
Listing remarks MLS
Check out the opportunity with this brick 3 family in great location. Needs work but priced accordingly. Sold as is no disclosures. Rely on your own inspections.
Key facts
- Turnkey duplex
- 3-car garage
- New roof
Tags
Property features AI
Finance
- Financial info: Both units are vacant; Unit 1 rent previously $925; Unit 2 rent previously $1,475; Total of 2 units (one 2-bedroom unit and one 4-bedroom unit)
Exterior
- Parking: Detached garage (3 garage spaces); Driveway parking; On-street parking
- Utilities: Public water; Public sewer; Natural gas
- Home design: Duplex; Two levels; Poured foundation
- Construction: Aluminum siding and brick construction; Shingle roof; Poured foundation; Built with two stories
- Exterior features: Shingle roof; Aluminum siding and brick exterior; Vinyl windows; Inoperable fireplace; Lot approximately 0.103 acres (4,487 sq ft); Residential zoning
Interior
- Bedrooms: Two-bedroom unit (Unit 1); Four-bedroom unit (Unit 2)
- Bathrooms: Unit 1: 1 full bathroom; Unit 2: 1 full bathroom and 1 partial bathroom
- Heating & cooling: Gas heating with separate furnaces; Central air with separate A/C; Separate gas and electric metering; Heat paid by tenant; Water paid by owner
- Interior features: Storage area; Full basement; Smoke alarm
Neighborhood map
What this means for you Summary
Snapshot
- This is a 2 × 2-bed/?-bath units multifamily listed at $435k.
Deal economics
- At list price, monthly cash flow is $150 ($2k/yr) — positive. Per door: $75/mo.
- The deal already cash-flows at list — no discount required.
- To meet the 1% rule (rent ≥ 1% of price), the offer needs to be $374k (14.1% below list).
- Recommended offer: $374k (14.1% below list) — sets the bar for 1% rule.
- Cap rate 6.7% vs local median 4.9% in Norwood — top-decile yield for the area; either an underpriced asset or a hidden risk that comps aren't pricing in. Stress-test before assuming the spread holds.
Location & tenants
- Location reads 79/100 on livability (#154 in OH, #2,322 nationally) — a middle-class / working-renter tenant base. Strengths: commute A+, cost of living A+, housing A+; Watch: crime C-, employment C-, amenities D+.
- Norwood City (suburban): math 35% / reading 53% proficiency, ranked #513 of 656 in OH (top 78%) — families likely to look elsewhere, expect single-tenant / working-renter base with shorter leases; 62% free/reduced lunch — lower-income household profile, screen leases tightly.
- Zoned schools: Sharpsburg Elementary (math 37% / reading 55%, grade D-, #979 of 1,584 statewide, top 62%, 259 students, 0% FRL); Norwood Middle School (math 41% / reading 57%, grade C-, #426 of 654 statewide, top 66%, 395 students, 0% FRL); Norwood High School (math 17% / reading 52%, grade F, #582 of 781 statewide, top 76%, 456 students, 0% FRL) — zoned schools average 0% FRL vs 62% district-wide (62 pts lower); this property's tenant base skews higher-income than the district average.
- Market conditions: Rents flat; 56 active listings in the ZIP; 3 comparable units currently listed for rent nearby; rentals at typical pace (median 23d on market — plan ~3-4 weeks tenant-placement turnaround); 801 units permitted in Hamilton County in 2024 (190 in 5+ unit buildings).
- At $3,737/mo this rent would consume 62% of the median local household income ($72k/yr) (locally 1192% of renters already pay >50% of income on rent) — very limited rent-growth headroom before tenants either downsize or default.
Forward outlook
- Local home prices are declining (-3.0%/yr); year-one equity from $3k of loan paydown is wiped out by about $13k of value loss. Plan a longer hold.
Negotiation context
- It's been on market 19 days — a 2% lower offer ($428k) is reasonable based on typical stale-listing flexibility.
- 5 sale attempts since 22y ago with the ask held roughly flat each time — persistent listings suggest the price (not the market) is what's stuck; bring a comps-based counter.
- Current owner paid $26k; list at $435k implies a 1542% gain — meaningful room to come down on a strong offer.
Risks & watch-outs
- Watch-outs: built in 1920 — expect roof / HVAC / electrical / plumbing capex.
- Climate carrying-cost: extreme-heat days projected 7→19/yr by 2055 (HVAC capex compounding) — expect insurance premiums to compound above CPI over the hold.
Questions for the listing agent
- Can we see the unit-by-unit rent roll, current vacancy, and any below-market leases? What's the average tenancy length?
- What capital expenditures (roof, boiler, parking lot, exteriors) have been made in the last 5 years, and what's planned in the next 2?
- Built in 1920 — when were the roof, HVAC, electrical panel, plumbing, and water heater last replaced?
- Is there a deadline driving the sale (1031 exchange, divorce, estate, relocation)? That informs how much negotiation room exists.
- Schools are B-rated — typically a magnet for longer-tenancy family renters. What's the average tenant stay here, and is there a school-zone premium baked into asking?
- The area grade is low — what's the realistic commute time and amenity access for the typical tenant pool here? Any planned neighborhood developments (good or bad) we should know about?
- What's the average days-on-market for RENTAL listings here right now (not sales)? A rising rental-DOM trend means longer vacancies and softer asking-rent achievability than the comps imply.
- What's the recent tenant-quality profile in this submarket — average credit score on applications, eviction rate, late-payment / NSF rate, and stable-employment percentage? A property-management company in the area should have these aggregated.
- How much new apartment / multifamily construction is in the pipeline within 1–3 miles? Heavy new supply (>2% of stock underway) typically softens rents 12–24 months out; light construction supports rent growth.
Investment metrics
- 1% rule
- 0.86% ✗
- Cap rate
- 6.71%
- Cash-on-cash
- 1.48%
- DSCR
- 1.07
- GRM
- 9.7
CMA / ARV
- ARV (on-the-fly)
- $474,646
- Comps found
- 10
Show comp detail 10 sales within ~0.75 mi
| Address | Dist | Beds/Ba | Sqft | Sold | Price | $/sf | Match |
|---|---|---|---|---|---|---|---|
| 4229 Twenty Eighth St | 0.33mi | 4/4.0 | 3,180 (-2%) | 5mo | $471,000 | $148 | 75 |
| 2417 Park Ave | 0.14mi | 5/3.0 (+1) | 3,154 (-3%) | 9mo | $455,000 | $144 | 74 |
| 2802 Hyde Park Ave | 0.55mi | 4/3.0 | 3,269 (+1%) | 5mo | $512,500 | $157 | 67 |
| 4216 Smith Rd | 0.20mi | 4/4.0 | 2,900 (-11%) | 14mo | $372,500 | $128 | 59 |
| 4532 Lafayette Ave | 0.46mi | 4/2.5 | 3,293 (+1%) | 18mo | $225,000 | $68 | 58 |
| 4417 Ashland Ave | 0.44mi | 5/4.0 (+1) | 3,155 (-3%) | 13mo | $465,000 | $147 | 57 |
| 2323 Adams Ave | 0.31mi | 5/3.0 (+1) | 3,724 (+14%) | 8mo | $520,000 | $140 | 48 |
| 3914 S Madison Ave | 0.60mi | 3/3.0 (-1) | 2,949 (-9%) | 2mo | $415,000 | $141 | 47 |
| 2233 Williams Ave | 0.67mi | 5/3.0 (+1) | 3,221 (-1%) | 18mo | $470,000 | $146 | 45 |
| 4021 Floral Ave | 0.64mi | 4/3.5 | 2,874 (-12%) | 16mo | $486,000 | $169 | 38 |
Match score weights: distance 35% · size 25% · config 20% · recency 20%. Top-matched comps best support the ARV.
Projected returns pro-forma
-3.0% appreciation · 0.21% rent growth · sell at horizon
- IRR
- -16.9%
- Equity multiple
- 0.42×
- Total profit
- $-71,182
- Equity at exit
- $64,860
- IRR
- -14.6%
- Equity multiple
- 0.26×
- Total profit
- $-89,533
- Equity at exit
- $37,611
Cash invested: $121,800 (down + closing). Projections, not guarantees.
Landlord ↔ Tenant lean methodology
- Overall (STATE)
- 73 Landlord-Friendly
- State Ohio
- 73 Landlord-Friendly · R+6
- County
- — inherits STATE
- City
- — inherits STATE
ZIP-level market 45212
- Rents YoY
- 0.2%
- Active inventory
- 56
- Price-to-rent
- 19.4×
Monthly cashflow live
- Estimated rent
- $3,737 high interval (Pro) →
- Mortgage (P&I)
- −$2,281
- Tax from tax record
- −$339 /mo · $4,072/yr
- Insurance
- −$181
- HOA
- −$0
- Vacancy / Maint / Mgmt
- −$785
- Net cashflow
- $150
Break-even live
Sensitivity live
| Price | -10% $397 | -5% $274 | +0% $150 | +5% $27 | +10% $-96 |
|---|---|---|---|---|---|
| Rent | -10% $-145 | -5% $3 | +0% $150 | +5% $298 | +10% $446 |
| Rate | -1.0pp $370 | -0.5pp $261 | base $150 | +0.5pp $38 | +1.0pp $-77 |
2-unit breakdown (identical units grouped — click to expand)
| Units | Beds | Baths | Est. rent |
|---|---|---|---|
| 2× units | 2 | — | $3,738 |
| #1 | 2 | — | $1,869 |
| #2 | 2 | — | $1,869 |
| Total (2 units) | $3,737 | ||
UW: 25.0% down · 7.5% · 30yr · 1.5% tax · 5.0% vac · 8.0% maint · 8.0% mgmt
Financing live
Cash to close
- Down payment
- $108,750
- Closing costs
- $13,050
- Reserves months
- —
- Total cash needed
- —
Loan-product check · same deal, 3 products live
Conventional
25% down · 7.5% · 30yr
- Down + closing
- —
- Monthly P&I
- —
- Monthly cashflow
- —
- DSCR
- —
- Eligible?
- —
Personal DTI + credit; lowest rate.
DSCR
20% down · 8.5% · 30yr
- Down + closing
- —
- Monthly P&I
- —
- Monthly cashflow
- —
- DSCR
- —
- Eligible?
- —
No personal income docs; deal must DSCR.
Hard money
10% down · 12.0% · 12mo
- Down + closing
- —
- Monthly P&I
- —
- Monthly cashflow
- —
- DSCR
- —
- Eligible?
- —
Short-term bridge; refi at stabilization.
Rent comps 3 comps
| Address | Beds | Baths | Sqft | Rent | $/sqft | DOM | Units | Dist |
|---|---|---|---|---|---|---|---|---|
| 2434 Kenilworth Ave Cincinnati, OH | 4.0 | 1.0 | 2744 | $1,650 | $0.60 | 16d | 1 | 0.09mi |
| 2757 Norwood Ave Cincinnati, OH | 3.0 | 2.0 | 2950 | $1,450 | $0.49 | 45d | 1 | 0.56mi |
| 3053 Wasson Rd Cincinnati, OH | 3.0 | 3.5 | 2589 | $4,700 | $1.82 | 23d | 1 | 1.18mi |
Listing history 12 events
-
2026-06-21days on market $435,000 Active 19 DOM
-
2026-06-18days on market $435,000 Active 16 DOM
-
2026-06-17status $435,000 Active 15 DOM
-
2026-06-17days on market $435,000 Contingency Pending 15 DOM
-
2026-06-16days on market $435,000 Contingency Pending 14 DOM
-
2026-06-15days on market $435,000 Contingency Pending 13 DOM
-
2026-06-13days on market $435,000 Contingency Pending 11 DOM
-
2026-06-09statusdays on market $435,000 Contingency Pending 7 DOM
-
2026-06-08days on market $435,000 Active 6 DOM
-
2026-06-07days on market $435,000 Active 5 DOM
-
2026-06-02remarks 479-char remark
-
2026-06-02$435,000 Active 1 DOM
ⓘ Source: listings_history table (triggers on properties + properties_extension) + one-shot
backfill from property_details.listing_events for pre-trigger history.
Tax reassessment forecast OH · Partial reset (capped growth)
- Current annual tax
- $4,072 · $339/mo
- Projected year-2 tax
- $5,429 · $452/mo
- Expected delta
- +$1,357/yr (+$113/mo · 33.3%)
ⓘ Screening estimate from a state-policy table — verify with the county assessor before closing.
Climate risk First Street
- Flood 1/10 Low FEMA zone X (unshaded) · 0% chance over 30 yrs
- Wildfire 1/10 Low
- Heat 5/10 Major 7 d/yr ≥103°F today · 19 d/yr by 30 yrs out
- Wind 2/10 Low 100% chance of damaging wind over 30 yrs
- Air quality 4/10 Moderate 4 unhealthy d/yr today · 5 by 30 yrs out
Nearby sold comps map
Loading sold comps map…
Walkable amenities ~0.75 mi
Loading nearby amenities…
Taxation est. · year 1
- Rental income
- $44,844
- − Mortgage interest
- −$24,367
- − Property taxes
- −$4,072
- − Insurance
- −$2,175
- − Repairs & maintenance
- −$3,588
- − Management
- −$3,588
- − Depreciation
- −$12,655
- Taxable loss
- −$5,599
- Est. tax savings @ 24.0%
- +$1,344
- After-tax cash flow
- $3,149/yr
For passive investors: Depreciation is non-cash, so a rental often shows a tax loss while cash-flowing — sheltering income. Rental losses are passive: they offset passive income freely, and up to $25,000/yr can offset ordinary (W-2) income if you actively participate and your MAGI is under $100k (phasing out to $0 by $150k); unused losses carry forward. On sale, claimed depreciation is recaptured at up to 25%, and gains may owe capital-gains tax (a 1031 exchange can defer both). Figures are a year-1 estimate at your 24.0% rate — not tax advice; consult a CPA.
Schools (NCES district)
- District
- Norwood City
- NCES district ID
- 3904457
- Math proficiency
- 35% ▼ -24.00%
- Reading proficiency
- 53% ▼ -11.00%
- Median HH income
- $38,750
- Composite
- 36.66/100
- National rank
- #4614
- State rank
- #513 of 656 in OH
Livability — Norwood
- Score
- 79/100
- State rank
- #154
- US rank
- #2322
Category grades
Schools grade is shown separately in the Schools card above.
Census & demographics
- Census place
- Norwood, OH
- County
- Hamilton County · 701,295 people
- City population
- 21,526
- Metro
- Cincinnati, OH-KY-IN
- Population (ZIP)
- 21,526
- Household income
- $72,422
- Rent vs Own
- Severe rent burden
- 1192.0
Population outlook (Hamilton County) Hauer SSP2
- Today (2025)
- 826,054 people
- By 2030
- 830,947 · +0.6%
- By 2040
- 832,319 · +0.8%
- By 2050
- 822,428 · -0.4%
- By 2075
- 788,688 · -4.5%
- By 2100
- 710,674 · -14.0%
Race, ethnicity, and origin ACS 2023
- Neighborhood character
- Predominantly White (73%)
- Race & ethnicity
- White 73% Black 15% Hispanic / Latino 8% Two or more races 5% Asian 1%
- Hispanic origin (detail)
- Mexican 3%
- Common ancestry
- Romanian 2% Lithuanian 1% Slovak 1%
- Foreign-born
- 5% · Canada, China
- Languages at home
- 92% English-only · Spanish 6% Arabic 1% Russian/Polish/Slavic 1%
Political lean MEDSL · Hamilton
- 2024 margin
- D (+14.9) · D 57.0% · R 42.1%
- 2008→2024 swing
- +7.9pp toward D · 2008: 7.0pp · 2024: 14.9pp
- All cycles
- 2024: D+14.9 2020: D+15.9 2016: D+9.5 2012: D+4.9 2008: D+7.0
Not yet ingested
- Civics
- —
Market trends
- HPI YoY
- ▼ -209.95%
- Current HPI
- 295.7088
- Rent YoY
- ▲ 0.21%
- Metro
- Cincinnati, OH-KY-IN
- State GDP YoY
- ▲ 1.98%
- F500 in state
- 48
Industry mix (Fortune 500 HQ in OH)
| Industry | F500 HQs | Revenue |
|---|---|---|
| Insurance | 3 | $145B |
|
||
| Industrial Machinery | 3 | $49B |
|
||
| Financial Services | 3 | $24B |
|
||
| Consumer Goods | 2 | $93B |
|
||
| Aerospace / Defense | 2 | $47B |
|
||
| Utilities | 2 | $33B |
|
||
Price history
+176.6% since first listed11 events — show timeline
- 2026-06-02 Listed $435,000 Cincy MLS
- 2009-01-06 Sold (MLS) $26,500 Cincy MLS
- 2008-09-12 Listed $29,900 Cincy MLS
- 2006-05-24 Sold (Public Records) $145,000 Public Records
- 2006-05-03 Sold (MLS) $145,000 Cincy MLS
- 2006-03-05 Listed $139,900 Cincy MLS
- 2006-03-01 Listing Removed — Cincy MLS
- 2005-07-28 Listed $120,000 Cincy MLS
- 2004-10-01 Listing Removed — Cincy MLS
- 2004-06-07 Listed $120,000 Cincy MLS
- 1997-01-30 Sold (Public Records) $157,250 Public Records
Property tax history
+3.9%/yrLatest (2025): $4,072 · -0.0% YoY. Source: county tax records.
Cash-flow waterfall
monthlySold comps — $/sqft
last 12 mo · ≤1 miLoading sold comps…