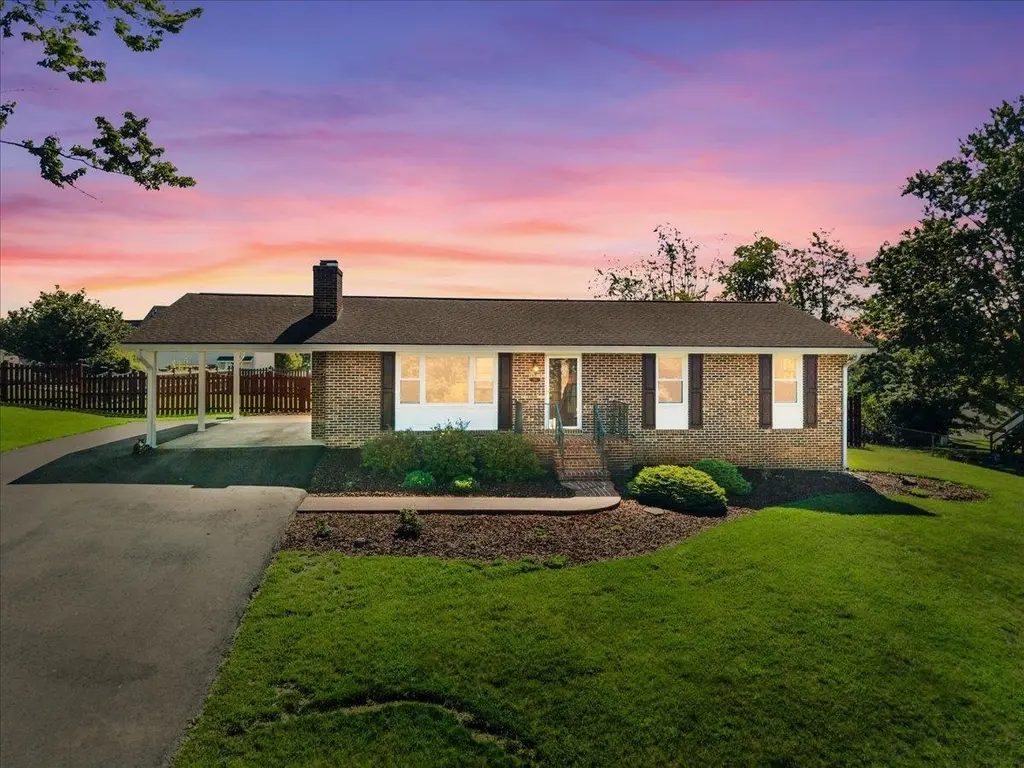
180 Henley Dr · Christiansburg, VA
Flood risk 1/10 · Minimal
- FEMA flood zone
- X (unshaded)
- Chance of flooding over 30 yrs
- 0.0%
- Est. flood insurance / yr
- $473 – $860
Fire risk 2/10 · Minimal
- Est. fire insurance / yr
- $666 – $1,236
Heat risk 3/10 · Minor
- Hot days now (above 95°F)
- 7 days/yr
- Hot days in 30 yrs
- 19 days/yr
Wind risk 2/10 · Minimal
- Chance of severe wind over 30 yrs
- 1.0%
Air-quality risk 1/10 · Minimal
- Unhealthy air days now
- 0 days/yr
- Unhealthy air days in 30 yrs
- 0 days/yr
Risk factors via First Street. Map © Google.
Why this score? — see what drove the D- grade
The composite is a weighted blend of 9 inputs, each scored 0–100. Each bar is that input's sub-score; the figure is the points it added to the 100-point composite (weight × sub-score).
- ARV discount +15.0/15.0
- Cash flow +6.7/30.0
- Schools +5.4/10.0
- Livability +4.0/5.0
- Rent growth +2.8/5.0
- Condition / age +2.5/5.0
- DSCR +1.0/10.0
- 1% rule +0.7/10.0
- Appreciation +0.0/10.0
$360,000
🖨 Deal sheet (PDF) 📄 Offer letter ✓ Due diligence
Listing remarks MLS
Spend Wisely! Stop renting and own this 4-bedroom/2.5-bath brick home in Windmill Hills. This classic floor plan with finished basement, Carport Storage sheds and the best location in the town limits of Christiansburg is a must see if you are a buyer in this price range. Book your appointment now!
Key facts
- Renovated kitchen
- Finished basement
- Updated bathrooms
Tags
Property features AI
Exterior
- Parking: Asphalt parking
- Utilities: Public water; Public sewer
- Home design: Single-family detached residence; Residential property
- Construction: Brick construction; Full basement, partially finished
- Exterior features: Patio; Garden; Fenced yard; Shed(s)
Interior
- Kitchen: Dishwasher; Microwave; Electric range; Refrigerator
- Bedrooms: Total of 8 rooms (includes bedrooms and living spaces)
- Bathrooms: 2 full bathrooms; 1 half bathroom
- Heating & cooling: Heat pump; Baseboard heating; Electric heating (has heating)
- Interior features: Wood-burning fireplace; Garden visible from interior (garden/outdoor area)
- Laundry & utility: Washer and dryer; Laundry located in basement; Electric water heater
Neighborhood map
What this means for you Summary
Snapshot
- This is a 3-bed/2.5-bath single-family listed at $360k.
Deal economics
- At list price, monthly cash flow is $-572 ($-7k/yr) — negative.
- To cash-flow at today's rent, offer at most $259k (28.1% below list).
- To meet the 1% rule (rent ≥ 1% of price), the offer needs to be $207k (42.6% below list).
- Recommended offer: $207k (42.6% below list) — sets the bar for 1% rule.
Location & tenants
- Location reads 81/100 on livability (#53 in VA, #1,452 nationally) — a professional / high-income tenant draw. Strengths: cost of living A+, housing A+, commute A-; Watch: amenities F.
- Montgomery County Public School District (urban): math 57% / reading 70% proficiency, ranked #47 of 131 in VA (top 36%) — acceptable for families but not a draw, mixed tenant base, ~2y average lease.
- Zoned schools: Christiansburg Primary (405 students, 49% FRL); Christiansburg Middle (math 38% / reading 63%, grade C, #226 of 342 statewide, top 67%, 752 students, 44% FRL); Christiansburg High (math 79% / reading 77%, grade A-, #80 of 319 statewide, top 25%, 1,116 students, 41% FRL).
- Market conditions: Rents rising (+1.1%/yr); 250 active listings in the ZIP; 9 comparable units currently listed for rent nearby; rentals lingering (median 45d on market — plan ~5-8 weeks vacancy on turnover, expect pricing pressure); 100% of comp listings sitting > 30 days — soft ceiling on asking rent; solid renter incomes; 323 units permitted in Montgomery County in 2024 (0 in 5+ unit buildings).
- This rent runs 32% of the median local income ($77k/yr) — at the standard rent-burdened threshold; future hikes will face affordability resistance.
Forward outlook
- Local home prices are declining (-3.0%/yr); year-one equity from $2k of loan paydown is wiped out by about $11k of value loss. Plan a longer hold.
- Montgomery County population projected at +13% by 2050 — modest demand growth; plan on rents tracking national, not racing it.
Negotiation context
- Only 2 days on market — expect competitive offers; lowballing is unlikely to land.
- 2 sale attempts since 8y ago with the ask held roughly flat each time — persistent listings suggest the price (not the market) is what's stuck; bring a comps-based counter.
- Current owner paid $202k; list at $360k implies a 78% gain — meaningful room to come down on a strong offer.
Questions for the listing agent
- What do current leases actually rent for vs. the listed asking? Can we see a recent rent roll and the last 12 months of T-12 income?
- Is there a deadline driving the sale (1031 exchange, divorce, estate, relocation)? That informs how much negotiation room exists.
- Schools are A-rated — typically a magnet for longer-tenancy family renters. What's the average tenant stay here, and is there a school-zone premium baked into asking?
- The area grade is low — what's the realistic commute time and amenity access for the typical tenant pool here? Any planned neighborhood developments (good or bad) we should know about?
- What's the average days-on-market for RENTAL listings here right now (not sales)? A rising rental-DOM trend means longer vacancies and softer asking-rent achievability than the comps imply.
- What's the recent tenant-quality profile in this submarket — average credit score on applications, eviction rate, late-payment / NSF rate, and stable-employment percentage? A property-management company in the area should have these aggregated.
- How much new for-sale + rental construction is in the pipeline within 1–3 miles? Heavy new supply typically softens prices + rents 12–24 months out; constrained supply supports both.
Investment metrics
- 1% rule
- 0.57% ✗
- Cap rate
- 4.39%
- Cash-on-cash
- -6.81%
- DSCR
- 0.70
- GRM
- 14.5
CMA / ARV
- ARV (median comp)
- $436,901
- List price
- $360,000
- Delta
- -17.60%
- Verdict
- UNDERPRICED
- Comps
- 20 within 1.0 mi
Show comp detail 12 sales within ~0.75 mi
| Address | Dist | Beds/Ba | Sqft | Sold | Price | $/sf | Match |
|---|---|---|---|---|---|---|---|
| 160 Roudabush Dr | 0.07mi | 3/2.0 | 1,817 (-6%) | 1mo | $390,000 | $215 | 83 |
| 130 Roudabush Dr NW | 0.09mi | 3/2.0 | 1,890 (-3%) | 8mo | $390,000 | $206 | 83 |
| 55 Welch Cir | 0.16mi | 3/3.0 | 2,073 (+7%) | 7mo | $390,950 | $189 | 74 |
| 1630 Sleepy Hollow Rd | 0.27mi | 3/3.0 | 2,104 (+8%) | 0mo | $285,000 | $135 | 71 |
| 1842 Cub Cir NW | 0.49mi | 3/2.0 | 1,912 (-2%) | 2mo | $399,900 | $209 | 71 |
| 870 Cambria St NW | 0.23mi | 4/2.5 (+1) | 1,800 (-7%) | 3mo | $347,000 | $193 | 70 |
| 210 Berkshire Dr | 0.26mi | 4/2.5 (+1) | 2,010 (+4%) | 9mo | $375,000 | $187 | 69 |
| 435 Majestic Dr NW | 0.39mi | 4/3.0 (+1) | 1,877 (-3%) | 8mo | $369,000 | $197 | 63 |
| 5 Welch Cir NW | 0.11mi | 4/2.5 (+1) | 2,210 (+14%) | 12mo | $450,000 | $204 | 57 |
| 330 Diamond Ave | 0.69mi | 3/2.5 | 1,799 (-7%) | 3mo | $374,950 | $208 | 53 |
| 1180 Juniper Dr | 0.44mi | 3/2.0 | 1,770 (-9%) | 12mo | $409,900 | $232 | 53 |
| 740 Independence Blvd | 0.59mi | 3/3.0 | 1,846 (-5%) | 19mo | $389,500 | $211 | 46 |
Match score weights: distance 35% · size 25% · config 20% · recency 20%. Top-matched comps best support the ARV.
Projected returns pro-forma
-3.0% appreciation · 1.05% rent growth · sell at horizon
- IRR
- -30.0%
- Equity multiple
- 0.02×
- Total profit
- $-98,883
- Equity at exit
- $53,677
- IRR
- -40.9%
- Equity multiple
- -0.48×
- Total profit
- $-149,290
- Equity at exit
- $31,126
Cash invested: $100,800 (down + closing). Projections, not guarantees.
Landlord ↔ Tenant lean methodology
- Overall (STATE)
- 55 Moderately Landlord-Leaning
- State Virginia
- 55 Moderately Landlord-Leaning · D+2
- County
- — inherits STATE
- City
- — inherits STATE
ZIP-level market 24073
- Home prices YoY
- -26.2%
- Rents YoY
- 1.1%
- Active inventory
- 250
- Price-to-rent
- 14.5×
Monthly cashflow live
- Estimated rent
- $2,067 high interval (Pro) →
- Mortgage (P&I)
- −$1,888
- Tax from tax record
- −$167 /mo · $2,006/yr
- Insurance
- −$150
- HOA
- −$0
- Vacancy / Maint / Mgmt
- −$434
- Net cashflow
- $-572
Break-even live
Sensitivity live
| Price | -10% $-368 | -5% $-470 | +0% $-572 | +5% $-674 | +10% $-776 |
|---|---|---|---|---|---|
| Rent | -10% $-735 | -5% $-654 | +0% $-572 | +5% $-490 | +10% $-409 |
| Rate | -1.0pp $-391 | -0.5pp $-480 | base $-572 | +0.5pp $-665 | +1.0pp $-760 |
UW: 25.0% down · 7.5% · 30yr · 1.5% tax · 5.0% vac · 8.0% maint · 8.0% mgmt
Financing live
Cash to close
- Down payment
- $90,000
- Closing costs
- $10,800
- Reserves months
- —
- Total cash needed
- —
Loan-product check · same deal, 3 products live
Conventional
25% down · 7.5% · 30yr
- Down + closing
- —
- Monthly P&I
- —
- Monthly cashflow
- —
- DSCR
- —
- Eligible?
- —
Personal DTI + credit; lowest rate.
DSCR
20% down · 8.5% · 30yr
- Down + closing
- —
- Monthly P&I
- —
- Monthly cashflow
- —
- DSCR
- —
- Eligible?
- —
No personal income docs; deal must DSCR.
Hard money
10% down · 12.0% · 12mo
- Down + closing
- —
- Monthly P&I
- —
- Monthly cashflow
- —
- DSCR
- —
- Eligible?
- —
Short-term bridge; refi at stabilization.
Rent comps 9 comps
| Address | Beds | Baths | Sqft | Rent | $/sqft | DOM | Units | Dist |
|---|---|---|---|---|---|---|---|---|
| 120 Amber Cir NW Christiansburg, VA | 3.0 | 3.5 | 1854 | $1,850 | $1.00 | 44d | 1 | 0.37mi |
| 700 Oaktree Blvd Christiansburg, VA | 3.0 | 2.0 | 1576 | $1,850 | $1.17 | 44d | 1 | 0.66mi |
| 215 Lunaria Ln NW Christiansburg, VA | 2.0 | 2.5 | 1276 | $1,699 | $1.33 | 44d | 1 | 1.14mi |
| 200 Meadow Dr Christiansburg, VA | 3.0 | 2.5 | 1752 | $2,100 | $1.20 | 44d | 1 | 1.15mi |
| 265 Lunaria Ln NW Christiansburg, VA | 3.0 | 2.5 | 1276 | $1,799 | $1.41 | 44d | 1 | 1.16mi |
| 260 Lunaria Ln NW Christiansburg, VA | 3.0 | 2.5 | 1276 | $1,799 | $1.41 | 44d | 1 | 1.17mi |
| 270 Lunaria Ln NW Christiansburg, VA | 2.0 | 2.0 | 1276 | $1,699 | $1.33 | 44d | 1 | 1.18mi |
| 135 Aster Ln Christiansburg, VA | 4.0 | 3.0 | 2100 | $2,800 | $1.33 | 44d | 1 | 1.38mi |
| 400 Monroe Ct NW Christiansburg, VA | 3.0 | 2.5 | 1504 | $2,100 | $1.40 | 44d | 1 | 1.48mi |
Listing history 5 events
-
2026-05-17status Pending 809-char remark
-
2026-05-15$360,000 Active 809-char remark
-
2019-02-26soldstatus $202,000 298-char remark
Show marketing remark (298 chars)
Spend Wisely! Stop renting and own this 4-bedroom/2.5-bath brick home in Windmill Hills. This classic floor plan with finished basement, Carport Storage sheds and the best location in the town limits of Christiansburg is a must see if you are a buyer in this price range. Book your appointment now!
-
2019-02-26soldstatus $202,000
Show marketing remark (298 chars)
Spend Wisely! Stop renting and own this 4-bedroom/2.5-bath brick home in Windmill Hills. This classic floor plan with finished basement, Carport Storage sheds and the best location in the town limits of Christiansburg is a must see if you are a buyer in this price range. Book your appointment now!
-
2018-10-08$209,880 298-char remark
Show marketing remark (298 chars)
Spend Wisely! Stop renting and own this 4-bedroom/2.5-bath brick home in Windmill Hills. This classic floor plan with finished basement, Carport Storage sheds and the best location in the town limits of Christiansburg is a must see if you are a buyer in this price range. Book your appointment now!
ⓘ Source: listings_history table (triggers on properties + properties_extension) + one-shot
backfill from property_details.listing_events for pre-trigger history.
Tax reassessment forecast VA · Resets to sale price
- Current annual tax
- $2,006 · $167/mo
- Projected year-2 tax
- $2,952 · $246/mo
- Expected delta
- +$946/yr (+$79/mo · 47.1%)
ⓘ Screening estimate from a state-policy table — verify with the county assessor before closing.
Climate risk First Street
- Flood 1/10 Low FEMA zone X (unshaded) · 0% chance over 30 yrs
- Wildfire 2/10 Low
- Heat 3/10 Moderate 7 d/yr ≥95°F today · 19 d/yr by 30 yrs out
- Wind 2/10 Low 100% chance of damaging wind over 30 yrs
- Air quality 1/10 Low 0 unhealthy d/yr today · 0 by 30 yrs out
Nearby sold comps map
Loading sold comps map…
Walkable amenities ~0.75 mi
Loading nearby amenities…
Taxation est. · year 1
- Rental income
- $24,807
- − Mortgage interest
- −$20,166
- − Property taxes
- −$2,006
- − Insurance
- −$1,800
- − Repairs & maintenance
- −$1,985
- − Management
- −$1,985
- − Depreciation
- −$10,473
- Taxable loss
- −$13,607
- Est. tax savings @ 24.0%
- +$3,266
- After-tax cash flow
- $-3,598/yr
For passive investors: Depreciation is non-cash, so a rental often shows a tax loss while cash-flowing — sheltering income. Rental losses are passive: they offset passive income freely, and up to $25,000/yr can offset ordinary (W-2) income if you actively participate and your MAGI is under $100k (phasing out to $0 by $150k); unused losses carry forward. On sale, claimed depreciation is recaptured at up to 25%, and gains may owe capital-gains tax (a 1031 exchange can defer both). Figures are a year-1 estimate at your 24.0% rate — not tax advice; consult a CPA.
Schools (NCES district)
- District
- Montgomery County Public School District
- NCES district ID
- 5102520
- Math proficiency
- 57% ▼ -29.00%
- Reading proficiency
- 70% ▼ -11.00%
- Median HH income
- $46,618
- Composite
- 53.6/100
- National rank
- #1440
- State rank
- #47 of 131 in VA
Livability — Christiansburg
- Score
- 81/100
- State rank
- #53
- US rank
- #1452
Category grades
Schools grade is shown separately in the Schools card above.
Census & demographics
- Census place
- Christiansburg, VA
- County
- Montgomery County · 78,218 people
- City population
- 29,677
- Metro
- Blacksburg-Christiansburg, VA
- Population (ZIP)
- 29,677
- Household income
- $76,800
- Rent vs Own
- Severe rent burden
- 861.0
Population outlook (Montgomery County) Hauer SSP2
- Today (2025)
- 105,748 people
- By 2030
- 110,301 · +4.3%
- By 2040
- 115,652 · +9.4%
- By 2050
- 119,651 · +13.1%
- By 2075
- 126,005 · +19.2%
- By 2100
- 129,771 · +22.7%
Race, ethnicity, and origin ACS 2023
- Neighborhood character
- Predominantly White (86%)
- Race & ethnicity
- White 86% Two or more races 5% Black 4% Hispanic / Latino 4% Asian 3%
- Common ancestry
- Italian 3% Slovak 3% Serbian 2%
- Foreign-born
- 5% · Canada, South Korea, Jamaica
- Languages at home
- 94% English-only · Spanish 3% Other Indo-European 2% Korean 1%
Political lean MEDSL · Montgomery
- 2024 margin
- Toss-up / Even · D 50.9% · R 47.4% · Other 1.7%
- 2008→2024 swing
- -1.4pp toward R · 2008: 4.9pp · 2024: 3.5pp
- All cycles
- 2024: D+3.5 2020: D+5.8 2016: D+1.3 2012: R+0.2 2008: D+4.9
Not yet ingested
- Civics
- —
Market trends
- HPI YoY
- ▼ -94.98%
- Current HPI
- 267.2504
- Rent YoY
- ▲ 1.05%
- Metro
- Blacksburg-Christiansburg, VA
- State GDP YoY
- ▲ 2.40%
- F500 in state
- 50
Industry mix (Fortune 500 HQ in VA)
| Industry | F500 HQs | Revenue |
|---|---|---|
| Aerospace / Defense | 4 | $236B |
|
||
| Technology / Defense | 3 | $32B |
|
||
| Financial Services | 2 | $176B |
|
||
| Utilities | 2 | $27B |
|
||
| Insurance | 2 | $25B |
|
||
| Technology | 2 | $15B |
|
||
Price history
+71.5% since first listed5 events — show timeline
- 2026-05-17 Pending — NRVMLS
- 2026-05-15 Listed $360,000 NRVMLS
- 2019-02-26 Sold (Public Records) $202,000 Public Records
- 2019-02-26 Sold (MLS) $202,000 NRVMLS
- 2018-10-08 Listed $209,880 NRVMLS
Property tax history
+2.2%/yrLatest (2025): $2,006 · +1.3% YoY. Source: county tax records.
Cash-flow waterfall
monthlySold comps — $/sqft
last 12 mo · ≤1 miLoading sold comps…