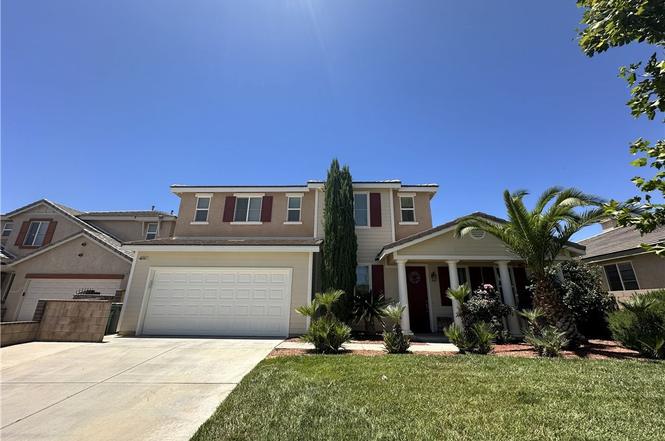
40741 Turnberry Ct · Palmdale, CA
Flood risk 1/10 · Minimal
- FEMA flood zone
- X (unshaded)
- Chance of flooding over 30 yrs
- 0.0%
- Est. flood insurance / yr
- $507 – $1,088
Fire risk 8/10 · Major
- Est. fire insurance / yr
- $659 – $1,223
Heat risk 6/10 · Moderate
- Hot days now (above 99°F)
- 5 days/yr
- Hot days in 30 yrs
- 12 days/yr
Wind risk 1/10 · Minimal
- Chance of severe wind over 30 yrs
- —
Air-quality risk 10/10 · Severe
- Unhealthy air days now
- 28 days/yr
- Unhealthy air days in 30 yrs
- 33 days/yr
Risk factors via First Street. Map © Google.
Why this score? — see what drove the C- grade
The composite is a weighted blend of 9 inputs, each scored 0–100. Each bar is that input's sub-score; the figure is the points it added to the 100-point composite (weight × sub-score).
- Cash flow +18.4/30.0
- ARV discount +9.3/15.0
- DSCR +5.8/10.0
- 1% rule +4.6/10.0
- Schools +4.1/10.0
- Rent growth +3.1/5.0
- Livability +2.8/5.0
- Condition / age +2.5/5.0
- Appreciation +0.0/10.0
$689,000
🖨 Deal sheet 📄 Offer letter ✓ Due diligence
Listing remarks MLS
Discover your dream home in the prestigious Rancho Vista Golf Course community of Palmdale, CA! This stunning 3,482 square foot residence, built in 2003, boasts five spacious bedrooms and four luxurious bathrooms, all nestled in a serene cul-de-sac location. Enjoy the convenience of nearby schools and shopping while relishing the tranquility of this beautiful neighborhood. Step inside to find a large kitchen that is a chef's delight, featuring ample counter space, abundant cabinetry, and a generous walk-in pantry. The inviting layout includes a second large upstairs bedroom complete with its own full bathroom, perfect for guests or as a private retreat. The expansive downstairs fifth bedroom, currently configured as a den or home office, offers versatile space to suit your lifestyle needs. Retreat to the magnificent large primary suite, which includes a cozy attached sitting room with a fireplace, ideal for relaxation. Step out onto the private balcony overlooking the backyard, perfect for enjoying morning coffee or evening sunsets. The opulent primary bathroom features a jacuzzi-style bathtub, a separate walk-in shower, and a spacious walk-in closet. This exceptional home combines comfort, style, and functionality in a prime location. Don't miss the opportunity to make this exquisite property your own--schedule a viewing today!
Key facts
- Private balcony
- Large kitchen
- 6,621 sq ft lot
Tags
Property features AI
Finance
- Other: No common walls (detached); Single-unit property; Living area and year-built sourced from assessor
- HOA & community: Neighborhood amenities include golf course, biking, street lighting, sidewalks, parks; suburban setting
Exterior
- Parking: Attached garage; Three garage spaces; Tandem garage; Direct garage access; Driveway parking; Total of 3 parking spaces
- Utilities: Public sewer; District/public water; Natural gas connected; Electricity connected; Cable available
- Home design: House; Two stories; Front entry; Entry level: 1; No accessory dwelling unit; Turnkey condition
- Construction: Concrete slab foundation
- Exterior features: Covered patio and slab patio; Deck; Sprinklers (front and rear) with timer; Landscaped front yard with lawn; Located on a cul-de-sac
Interior
- Kitchen: Breakfast counter/bar; Dining ell; Formal dining room; Separated dining area; Granite counters
- Bedrooms: Primary bedroom; One main-level bedroom; Walk-in closet
- Flooring: Vinyl; Carpet; Concrete
- Bathrooms: Four full bathrooms; Master bath with double sinks; Jetted tub and bathtub
- Heating & cooling: Central heating (furnace); Central cooling
- Interior features: High ceilings (9+ feet); Ceiling fan; Granite counters; Turnkey condition; Spa (above ground)
- Laundry & utility: Dedicated laundry room; Washer hookup; Gas dryer hookup
Neighborhood map
What this means for you Summary
Snapshot
- This is a 4-bed/4.0-bath single-family listed at $689k.
Deal economics
- At list price, monthly cash flow is $643 ($8k/yr) — positive.
- The deal already cash-flows at list — no discount required.
- To meet the 1% rule (rent ≥ 1% of price), the offer needs to be $663k (3.7% below list).
- Recommended offer: $663k (3.7% below list) — sets the bar for 1% rule.
- Cap rate 7.4% vs local median 4.5% in Palmdale — top-decile yield for the area; either an underpriced asset or a hidden risk that comps aren't pricing in. Stress-test before assuming the spread holds.
Location & tenants
- Location reads 55/100 on livability (#861 in CA) — a working-class tenant base; expect higher turnover. Strengths: housing A+; Watch: schools F, crime F, amenities F.
- Westside Union Elementary (suburban): math 34% / reading 49% proficiency, ranked #565 of 1,400 in CA (top 40%) — families likely to look elsewhere, expect single-tenant / working-renter base with shorter leases.
- Market conditions: Rents rising (+2.3%/yr); 387 active listings in the ZIP; 4 comparable units currently listed for rent nearby; rentals leasing fast (median 1d on market — plan ~1-2 weeks tenant-placement turnaround); high-income renter base; 19,697 units permitted in Los Angeles County in 2024 (9,426 in 5+ unit buildings).
- At $6,635/mo this rent would consume 66% of the median local household income ($120k/yr) (locally 1168% of renters already pay >50% of income on rent) — very limited rent-growth headroom before tenants either downsize or default.
Forward outlook
- Local home prices are declining (-3.0%/yr); year-one equity from $5k of loan paydown is wiped out by about $21k of value loss. Plan a longer hold.
- Los Angeles County population projected at +9% by 2050 — modest demand growth; plan on rents tracking national, not racing it.
Negotiation context
- Only 7 days on market — expect competitive offers; lowballing is unlikely to land.
- 5 sale attempts since 6y ago with the ask held roughly flat each time — persistent listings suggest the price (not the market) is what's stuck; bring a comps-based counter.
Risks & watch-outs
- Climate carrying-cost: severe wildfire risk; extreme-heat days projected 5→12/yr by 2055 (HVAC capex compounding) — expect insurance premiums to compound above CPI over the hold.
Questions for the listing agent
- Is there a deadline driving the sale (1031 exchange, divorce, estate, relocation)? That informs how much negotiation room exists.
- Schools are F-rated, which usually means shorter tenancies and higher turnover. Who's the typical renter profile here, and what's been the actual vacancy rate?
- Crime grade is F in this area — have there been break-ins, vandalism, or insurance claims at this property in the last 3 years? What carrier currently insures it and at what premium?
- What's the average days-on-market for RENTAL listings here right now (not sales)? A rising rental-DOM trend means longer vacancies and softer asking-rent achievability than the comps imply.
- What's the recent tenant-quality profile in this submarket — average credit score on applications, eviction rate, late-payment / NSF rate, and stable-employment percentage? A property-management company in the area should have these aggregated.
- How much new for-sale + rental construction is in the pipeline within 1–3 miles? Heavy new supply typically softens prices + rents 12–24 months out; constrained supply supports both.
Investment metrics
- 1% rule
- 0.96% ✗
- Cap rate
- 7.41%
- Cash-on-cash
- 4.00%
- DSCR
- 1.18
- GRM
- 8.7
CMA / ARV
- ARV (on-the-fly)
- $717,292
- Comps found
- 12
Show comp detail 12 sales within ~0.75 mi
| Address | Dist | Beds/Ba | Sqft | Sold | Price | $/sf | Match |
|---|---|---|---|---|---|---|---|
| 3642 Club Rancho | 0.40mi | 4/4.0 | 3,482 (0%) | 2mo | $664,870 | $191 | 79 |
| 3524 Tournament Dr | 0.16mi | 4/4.0 | 3,482 (0%) | 22mo | $635,000 | $182 | 74 |
| 3445 W Avenue N3 | 0.40mi | 4/3.0 | 3,320 (-5%) | 7mo | $900,000 | $271 | 63 |
| 40909 36th St W | 0.29mi | 4/3.0 | 3,293 (-5%) | 16mo | $1,100,000 | $334 | 61 |
| 3431 Fairgreen Ln | 0.27mi | 5/3.0 (+1) | 3,256 (-6%) | 12mo | $610,000 | $187 | 58 |
| 3157 Club Rancho Dr | 0.25mi | 5/3.5 (+1) | 3,146 (-10%) | 14mo | $708,000 | $225 | 54 |
| 3539 Tamarisk Dr | 0.43mi | 5/3.0 (+1) | 3,256 (-6%) | 10mo | $665,000 | $204 | 52 |
| 3730 Club Rancho Dr | 0.47mi | 5/3.0 (+1) | 3,341 (-4%) | 12mo | $670,000 | $201 | 52 |
| 3721 Club Rancho Dr | 0.46mi | 5/4.0 (+1) | 3,032 (-13%) | 2mo | $687,000 | $227 | 50 |
| 41018 40th Street West | 0.65mi | 4/3.5 | 3,248 (-7%) | 9mo | $884,500 | $272 | 49 |
| 40528 Flag Way | 0.31mi | 5/3.0 (+1) | 3,256 (-6%) | 21mo | $670,000 | $206 | 48 |
| 40333 Preston Rd | 0.67mi | 5/3.0 (+1) | 3,256 (-6%) | 2mo | $650,000 | $200 | 47 |
Match score weights: distance 35% · size 25% · config 20% · recency 20%. Top-matched comps best support the ARV.
Projected returns pro-forma
-3.0% appreciation · 2.29% rent growth · sell at horizon
- IRR
- -10.8%
- Equity multiple
- 0.61×
- Total profit
- $-75,391
- Equity at exit
- $102,732
- IRR
- -2.5%
- Equity multiple
- 0.83×
- Total profit
- $-31,941
- Equity at exit
- $59,572
Cash invested: $192,920 (down + closing). Projections, not guarantees.
Landlord ↔ Tenant lean methodology
- Overall (STATE)
- 18 Strongly Tenant-Friendly
- State California
- 18 Strongly Tenant-Friendly · D+13
- County
- — inherits STATE
- City
- — inherits STATE
ZIP-level market 93551
- Home prices YoY
- -30.3%
- Rents YoY
- 2.3%
- Active inventory
- 387
- Price-to-rent
- 8.7×
Monthly cashflow live
- Estimated rent
- $6,635 medium interval (Pro) →
- Mortgage (P&I)
- −$3,613
- Tax from tax record
- −$698 /mo · $8,377/yr
- Insurance
- −$287
- HOA
- −$0
- Vacancy / Maint / Mgmt
- −$1,393
- Net cashflow
- $643
Break-even live
UW: 25.0% down · 7.5% · 30yr · 1.5% tax · 5.0% vac · 8.0% maint · 8.0% mgmt
Financing live
Cash to close
- Down payment
- $172,250
- Closing costs
- $20,670
- Reserves months
- —
- Total cash needed
- —
Loan-product check · same deal, 3 products live
Conventional
25% down · 7.5% · 30yr
- Down + closing
- —
- Monthly P&I
- —
- Monthly cashflow
- —
- DSCR
- —
- Eligible?
- —
Personal DTI + credit; lowest rate.
DSCR
20% down · 8.5% · 30yr
- Down + closing
- —
- Monthly P&I
- —
- Monthly cashflow
- —
- DSCR
- —
- Eligible?
- —
No personal income docs; deal must DSCR.
Hard money
10% down · 12.0% · 12mo
- Down + closing
- —
- Monthly P&I
- —
- Monthly cashflow
- —
- DSCR
- —
- Eligible?
- —
Short-term bridge; refi at stabilization.
Rent comps 4 comps
| Address | Beds | Baths | Sqft | Rent | $/sqft | DOM | Units | Dist |
|---|---|---|---|---|---|---|---|---|
| 3423 Racquet Ln Palmdale, CA | 5.0 | 3.0 | 2944 | $7,500 | $2.55 | 1d | 1 | 0.41mi |
| 4138 Club Vista Dr Palmdale, CA | 5.0 | 4.0 | 3146 | $7,500 | $2.38 | 1d | 1 | 0.89mi |
| 40028 25th St W Palmdale, CA | 4.0 | 3.0 | 3242 | $6,500 | $2.00 | 1d | 1 | 1.25mi |
| 3037 West Avenue M-4 Unit M4 Lancaster, CA | 5.0 | 3.0 | 3781 | $4,395 | $1.16 | 1d | 1 | 1.39mi |
Listing history 7 events
-
2026-06-18days on market $689,000 Active 7 DOM
-
2026-06-17days on market $689,000 Active 6 DOM
-
2026-06-16days on market $689,000 Active 5 DOM
-
2026-06-15days on market $689,000 Active 4 DOM
-
2026-06-13days on market $689,000 Active 2 DOM
-
2026-06-13remarks 699-char remark
-
2026-06-13$689,000 Active 1 DOM
ⓘ Source: listings_history table (triggers on properties + properties_extension) + one-shot
backfill from property_details.listing_events for pre-trigger history.
Tax reassessment forecast CA · Resets to sale price
- Current annual tax
- $8,377 · $698/mo
- Projected year-2 tax
- $8,377 · $698/mo
- Expected delta
- $0/yr ($0/mo · 0.0%)
ⓘ Screening estimate from a state-policy table — verify with the county assessor before closing.
Climate risk First Street
- Flood 1/10 Low FEMA zone X (unshaded) · 0% chance over 30 yrs
- Wildfire 8/10 Severe
- Heat 6/10 Major 5 d/yr ≥99°F today · 12 d/yr by 30 yrs out
- Wind 1/10 Low
- Air quality 10/10 Extreme 28 unhealthy d/yr today · 33 by 30 yrs out
Nearby sold comps map
Loading sold comps map…
Walkable amenities ~0.75 mi
Loading nearby amenities…
Taxation est. · year 1
- Rental income
- $79,619
- − Mortgage interest
- −$38,595
- − Property taxes
- −$8,377
- − Insurance
- −$3,445
- − Repairs & maintenance
- −$6,369
- − Management
- −$6,369
- − Depreciation
- −$20,044
- Taxable loss
- −$3,581
- Est. tax savings @ 24.0%
- +$859
- After-tax cash flow
- $8,577/yr
For passive investors: Depreciation is non-cash, so a rental often shows a tax loss while cash-flowing — sheltering income. Rental losses are passive: they offset passive income freely, and up to $25,000/yr can offset ordinary (W-2) income if you actively participate and your MAGI is under $100k (phasing out to $0 by $150k); unused losses carry forward. On sale, claimed depreciation is recaptured at up to 25%, and gains may owe capital-gains tax (a 1031 exchange can defer both). Figures are a year-1 estimate at your 24.0% rate — not tax advice; consult a CPA.
Schools (NCES district)
- District
- Westside Union Elementary
- NCES district ID
- 0642120
- Math proficiency
- 34% ▲ 1.00%
- Reading proficiency
- 49% ▲ 1.00%
- Median HH income
- $80,763
- Composite
- 41.01/100
- National rank
- #7473
- State rank
- #565 of 1400 in CA
Livability — Palmdale
- Score
- 55/100
- State rank
- #861
- US rank
- #23501
Category grades
Schools grade is shown separately in the Schools card above.
Census & demographics
- Census place
- Palmdale, CA
- County
- Los Angeles County · 9,444,647 people
- City population
- 177,644
- Metro
- Los Angeles-Long Beach-Anaheim, CA
- Population (ZIP)
- 54,360
- Household income
- $119,801
- Rent vs Own
- Severe rent burden
- 1168.0
Population outlook (Los Angeles County) Hauer SSP2
- Today (2025)
- 10,940,515 people
- By 2030
- 11,256,481 · +2.9%
- By 2040
- 11,729,929 · +7.2%
- By 2050
- 11,948,407 · +9.2%
- By 2075
- 11,818,114 · +8.0%
- By 2100
- 10,842,928 · -0.9%
Race, ethnicity, and origin ACS 2023
- Neighborhood character
- Diverse neighborhood (Simpson 0.68)
- Race & ethnicity
- Hispanic / Latino 43% White 33% Two or more races 17% Black 10% Asian 9%
- Hispanic origin (detail)
- Mexican 31%
- Common ancestry
- Russian 1% Lithuanian 1% Slovak 1%
- Foreign-born
- 22% · Canada, Vietnam, China
- Languages at home
- 61% English-only · Spanish 29% Other Indo-European 3% Tagalog/Filipino 3%
Political lean MEDSL · Los Angeles
- 2024 margin
- Solid D (+32.9) · D 64.8% · R 31.9% · Other 3.3%
- 2008→2024 swing
- -7.4pp toward R · 2008: 40.4pp · 2024: 32.9pp
- All cycles
- 2024: D+32.9 2020: D+44.2 2016: D+48.0 2012: D+40.0 2008: D+40.4
Not yet ingested
- Civics
- —
Market trends
- HPI YoY
- ▼ -142.22%
- Current HPI
- 327.1791
- Rent YoY
- ▲ 2.29%
- Metro
- Los Angeles-Long Beach-Anaheim, CA
- State GDP YoY
- ▲ 3.21%
- F500 in state
- 116
Industry mix (Fortune 500 HQ in CA)
| Industry | F500 HQs | Revenue |
|---|---|---|
| Technology | 27 | $1,492B |
|
||
| Financial Services | 3 | $174B |
|
||
| Retail | 3 | $44B |
|
||
| Insurance | 3 | $26B |
|
||
| Media / Entertainment | 2 | $115B |
|
||
| Pharmaceuticals / Biotech | 2 | $62B |
|
||
Price history
+32.5% since first listed10 events — show timeline
- 2026-06-11 Listed $689,000 CRMLS
- 2026-06-10 Listed $689,000 AVMLS
- 2020-06-30 Listing Removed — SDMLS
- 2020-06-30 Listing Removed — CRMLS
- 2020-06-17 Listing Removed — AVMLS
- 2020-05-18 Price Changed $515,000 AVMLS
- 2020-05-18 Price Changed $515,000 CRMLS
- 2020-05-06 Listed $520,000 CRMLS
- 2020-05-05 Listed $515,000 SDMLS
- 2020-05-05 Listed $520,000 AVMLS
Property tax history
+2.3%/yrLatest (2025): $8,377 · +4.8% YoY. Source: county tax records.
Cash-flow waterfall
monthlySold comps — $/sqft
last 12 mo · ≤1 miLoading sold comps…