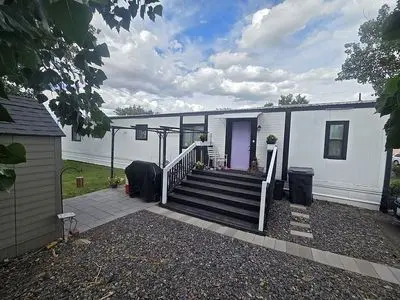
6708 Haag St · West Richland, WA
Flood risk 1/10 · Minimal
- FEMA flood zone
- X
- Chance of flooding over 30 yrs
- 0.0%
- Est. flood insurance / yr
- $507 – $1,088
Fire risk 6/10 · Moderate
- Est. fire insurance / yr
- $604 – $1,122
Heat risk 5/10 · Moderate
- Hot days now (above 98°F)
- 7 days/yr
- Hot days in 30 yrs
- 15 days/yr
Wind risk 1/10 · Minimal
- Chance of severe wind over 30 yrs
- —
Air-quality risk 8/10 · Major
- Unhealthy air days now
- 14 days/yr
- Unhealthy air days in 30 yrs
- 14 days/yr
Risk factors via First Street. Map © Google.
Why this score? — see what drove the B grade
The composite is a weighted blend of 9 inputs, each scored 0–100. Each bar is that input's sub-score; the figure is the points it added to the 100-point composite (weight × sub-score).
- Cash flow +30.0/30.0
- 1% rule +10.0/10.0
- DSCR +10.0/10.0
- ARV discount +9.2/15.0
- Schools +5.3/10.0
- Livability +3.6/5.0
- Rent growth +2.5/5.0
- Condition / age +2.5/5.0
- Appreciation +0.0/10.0
$80,000
🖨 Deal sheet 📄 Offer letter ✓ Due diligence
Listing remarks
Priced to sell with a motivated seller. Live in the desirable Desert View community park. 2 bedrooms 2 full bathrooms, craft or work space, full kitchen with extra chef sink. Updated master bathroom. Hall closet and laundry room. Fully landscaped big yard with 2 sheds for plenty of storage. Seller is selling home as is. Seller to include 3,000.00 at closing for floor upgrades or anything you choose. Family park with seasonal swimming pool clubhouse gym playground and basketball court. Easy online application for park approval. Come have a look at your new home. Affordable lot rent, 555.00 plus water sewer trash, average cost is around 650.00-730.00 depending on usage.
Key facts
- Craft or work space
- Extra chef sink
- Built 1984
Tags
Neighborhood map
What this means for you Summary
Snapshot
- This is a 2-bed/2.0-bath manufactured listed at $80k.
Deal economics
- At list price, monthly cash flow is $796 ($10k/yr) — positive.
- The deal already cash-flows at list — no discount required.
- Meets the 1% rule at list price ($2k rent vs $80k).
- Cap rate 18.2% vs local median 3.2% in West Richland — top-decile yield for the area; either an underpriced asset or a hidden risk that comps aren't pricing in. Stress-test before assuming the spread holds.
Location & tenants
- Location reads 71/100 on livability (#236 in WA) — a middle-class / working-renter tenant base. Strengths: crime A+, employment A+, housing A+; Watch: cost of living D+, amenities F, commute F.
- Richland School District (urban): math 52% / reading 64% proficiency, ranked #61 of 291 in WA (top 21%) — acceptable for families but not a draw, mixed tenant base, ~2y average lease.
- Market conditions: 243 active listings in the ZIP; 5 comparable units currently listed for rent nearby; rentals leasing fast (median 14d on market — plan ~1-2 weeks tenant-placement turnaround); high-income renter base; 1,532 units permitted in Benton County in 2024 (389 in 5+ unit buildings).
- This rent is only 16% of the median local income ($122k/yr) — well below the 30% rent-burden line; pricing power to push rent on renewal without tenant pushback.
Forward outlook
- Local home prices are declining (-3.0%/yr); year-one equity from $553 of loan paydown is wiped out by about $2k of value loss. Plan a longer hold.
- Benton County population projected at +32% by 2050 — long-run rental-demand tailwind backs the buy-and-hold thesis.
- At projected returns (-3.0% appreciation + 3.0% rent growth), your $22k cash investment doubles in ~3 years — after that, you're playing with house money.
Negotiation context
- Only 10 days on market — expect competitive offers; lowballing is unlikely to land.
Risks & watch-outs
- Climate carrying-cost: major wildfire risk; extreme-heat days projected 7→15/yr by 2055 (HVAC capex compounding) — expect insurance premiums to compound above CPI over the hold.
Questions for the listing agent
- Is there a deadline driving the sale (1031 exchange, divorce, estate, relocation)? That informs how much negotiation room exists.
- Schools are B-rated — typically a magnet for longer-tenancy family renters. What's the average tenant stay here, and is there a school-zone premium baked into asking?
- What's the average days-on-market for RENTAL listings here right now (not sales)? A rising rental-DOM trend means longer vacancies and softer asking-rent achievability than the comps imply.
- What's the recent tenant-quality profile in this submarket — average credit score on applications, eviction rate, late-payment / NSF rate, and stable-employment percentage? A property-management company in the area should have these aggregated.
- How much new for-sale + rental construction is in the pipeline within 1–3 miles? Heavy new supply typically softens prices + rents 12–24 months out; constrained supply supports both.
Investment metrics
- 1% rule
- 2.01% ✓
- Cap rate
- 18.23%
- Cash-on-cash
- 42.64%
- DSCR
- 2.90
- GRM
- 4.1
CMA / ARV
- ARV (on-the-fly)
- $83,160
- Comps found
- 12
Show comp detail 12 sales within ~0.75 mi
| Address | Dist | Beds/Ba | Sqft | Sold | Price | $/sf | Match |
|---|---|---|---|---|---|---|---|
| 6408 Haag St | 0.19mi | 2/2.0 | 924 (0%) | 6mo | $89,500 | $97 | 86 |
| 6705 S Morrison St | 0.15mi | 2/2.0 | 924 (0%) | 16mo | $85,000 | $92 | 80 |
| 313 Sahara Ct #686 | 0.25mi | 2/2.0 | 924 (0%) | 11mo | $65,000 | $70 | 79 |
| 313 Sahara Ct | 0.25mi | 2/2.0 | 924 (0%) | 11mo | $65,000 | $70 | 79 |
| 207 N 68th Ave #501 | 0.15mi | 3/2.0 (+1) | 996 (+8%) | 0mo | $75,000 | $75 | 75 |
| 6311 Desert View Dr | 0.27mi | 2/2.0 | 938 (+2%) | 12mo | $76,000 | $81 | 75 |
| 324 Mojave Ct | 0.24mi | 2/1.0 | 960 (+4%) | 7mo | $86,000 | $90 | 72 |
| 6600 Haag St | 0.10mi | 3/1.0 (+1) | 924 (0%) | 19mo | $83,000 | $90 | 70 |
| 6707 Haag St | 0.02mi | 2/1.0 | 972 (+5%) | 21mo | $75,000 | $77 | 69 |
| 868 N 62nd Ave | 0.66mi | 2/2.0 | 924 (0%) | 1mo | $195,000 | $211 | 68 |
| 107 N 68th Ave | 0.10mi | 3/1.0 (+1) | 938 (+2%) | 19mo | $90,000 | $96 | 68 |
| 892 N 62nd Ave | 0.68mi | 3/2.0 (+1) | 960 (+4%) | 21mo | $269,900 | $281 | 40 |
Match score weights: distance 35% · size 25% · config 20% · recency 20%. Top-matched comps best support the ARV.
Projected returns pro-forma
-3.0% appreciation · 3.0% rent growth · sell at horizon
- IRR
- 39.4%
- Equity multiple
- 2.68×
- Total profit
- $37,705
- Equity at exit
- $11,928
- IRR
- 45.8%
- Equity multiple
- 5.38×
- Total profit
- $98,013
- Equity at exit
- $6,917
Cash invested: $22,400 (down + closing). Projections, not guarantees.
Landlord ↔ Tenant lean methodology
- Overall (STATE)
- 28 Tenant-Leaning
- State Washington
- 28 Tenant-Leaning · D+8
- County
- — inherits STATE
- City
- — inherits STATE
ZIP-level market 99353
- Active inventory
- 243
- Price-to-rent
- 4.1×
Monthly cashflow live
- Estimated rent
- $1,611 high interval (Pro) →
- Mortgage (P&I)
- −$420
- Tax from tax record
- −$24 /mo · $283/yr
- Insurance
- −$33
- HOA
- −$0
- Vacancy / Maint / Mgmt
- −$338
- Net cashflow
- $796
Break-even live
UW: 25.0% down · 7.5% · 30yr · 1.5% tax · 5.0% vac · 8.0% maint · 8.0% mgmt
Financing live
Cash to close
- Down payment
- $20,000
- Closing costs
- $2,400
- Reserves months
- —
- Total cash needed
- —
Loan-product check · same deal, 3 products live
Conventional
25% down · 7.5% · 30yr
- Down + closing
- —
- Monthly P&I
- —
- Monthly cashflow
- —
- DSCR
- —
- Eligible?
- —
Personal DTI + credit; lowest rate.
DSCR
20% down · 8.5% · 30yr
- Down + closing
- —
- Monthly P&I
- —
- Monthly cashflow
- —
- DSCR
- —
- Eligible?
- —
No personal income docs; deal must DSCR.
Hard money
10% down · 12.0% · 12mo
- Down + closing
- —
- Monthly P&I
- —
- Monthly cashflow
- —
- DSCR
- —
- Eligible?
- —
Short-term bridge; refi at stabilization.
Rent comps 5 comps
| Address | Beds | Baths | Sqft | Rent | $/sqft | DOM | Units | Dist |
|---|---|---|---|---|---|---|---|---|
| 5889 W Van Giesen St Unit 4 West Richland, WA | 1.0 | 1.0 | 584 | $895 | $1.53 | 43d | 1 | 0.65mi |
| 870 Walton Pl West Richland, WA | 2.0 | 2.0 | 919 | $1,495 | $1.63 | 13d | 1 | 0.78mi |
| 7850 Paradise Way West Richland, WA | 2.0 | 2.0 | 929 | $1,500 | $1.61 | 13d | 4 | 0.91mi |
| 8000 Paradise Way West Richland, WA | 2.0 | 2.0 | 924 | $1,575 | $1.70 | 13d | 2 | 0.97mi |
| 8152 Paradise Way West Richland, WA | 2.0–3.0 | 2.0–2.5 | 1262 | $2,095 | $1.66 | 13d | 7 | 1.07mi |
Listing history 9 events
-
2026-06-18days on market $80,000 Active 10 DOM
-
2026-06-17days on market $80,000 Active 9 DOM
-
2026-06-16days on market $80,000 Active 8 DOM
-
2026-06-15days on market $80,000 Active 7 DOM
-
2026-06-14days on market $80,000 Active 5 DOM
-
2026-06-13days on market $80,000 Active 4 DOM
-
2026-06-10days on market $80,000 Active 2 DOM
-
2026-06-09remarks 677-char remark
-
2026-06-09$80,000 Active 1 DOM
ⓘ Source: listings_history table (triggers on properties + properties_extension) + one-shot
backfill from property_details.listing_events for pre-trigger history.
Tax reassessment forecast WA · Resets to sale price
- Current annual tax
- $283 · $24/mo
- Projected year-2 tax
- $784 · $65/mo
- Expected delta
- +$501/yr (+$42/mo · 176.7%)
ⓘ Screening estimate from a state-policy table — verify with the county assessor before closing.
Climate risk First Street
- Flood 1/10 Low FEMA zone X · 0% chance over 30 yrs
- Wildfire 6/10 Major
- Heat 5/10 Major 7 d/yr ≥98°F today · 15 d/yr by 30 yrs out
- Wind 1/10 Low
- Air quality 8/10 Severe 14 unhealthy d/yr today · 14 by 30 yrs out
Nearby sold comps map
Loading sold comps map…
Walkable amenities ~0.75 mi
Loading nearby amenities…
Taxation est. · year 1
- Rental income
- $19,327
- − Mortgage interest
- −$4,481
- − Property taxes
- −$283
- − Insurance
- −$400
- − Repairs & maintenance
- −$1,546
- − Management
- −$1,546
- − Depreciation
- −$2,327
- Taxable income
- $8,743
- Est. tax owed @ 24.0%
- −$2,098
- After-tax cash flow
- $7,452/yr
For passive investors: Depreciation is non-cash, so a rental often shows a tax loss while cash-flowing — sheltering income. Rental losses are passive: they offset passive income freely, and up to $25,000/yr can offset ordinary (W-2) income if you actively participate and your MAGI is under $100k (phasing out to $0 by $150k); unused losses carry forward. On sale, claimed depreciation is recaptured at up to 25%, and gains may owe capital-gains tax (a 1031 exchange can defer both). Figures are a year-1 estimate at your 24.0% rate — not tax advice; consult a CPA.
Schools (NCES district)
- District
- Richland School District
- NCES district ID
- 5307320
- Math proficiency
- 52% ▬ 0.00%
- Reading proficiency
- 64% ▼ -1.00%
- Median HH income
- $70,475
- Composite
- 53.04/100
- National rank
- #3244
- State rank
- #61 of 291 in WA
Livability — West Richland
- Score
- 71/100
- State rank
- #236
- US rank
- #7220
Category grades
Schools grade is shown separately in the Schools card above.
Census & demographics
- Census place
- West Richland, WA
- County
- Benton County · 186,895 people
- City population
- 19,251
- Metro
- Kennewick-Richland, WA
- Population (ZIP)
- 19,251
- Household income
- $121,845
- Rent vs Own
- Severe rent burden
- 254.0
Population outlook (Benton County) Hauer SSP2
- Today (2025)
- 219,421 people
- By 2030
- 233,813 · +6.6%
- By 2040
- 262,134 · +19.5%
- By 2050
- 290,100 · +32.2%
- By 2075
- 363,525 · +65.7%
- By 2100
- 418,667 · +90.8%
Race, ethnicity, and origin ACS 2023
- Neighborhood character
- Predominantly White (74%)
- Race & ethnicity
- White 74% Hispanic / Latino 15% Two or more races 15% Asian 2%
- Hispanic origin (detail)
- Mexican 13%
- Common ancestry
- Portuguese 4% Italian 4% Lithuanian 4%
- Foreign-born
- 7% · Canada, Vietnam, China
- Languages at home
- 87% English-only · Spanish 10% Other Asian/Pacific 1% Arabic 1%
Political lean MEDSL · Benton
- 2024 margin
- Strong R (+21.9) · D 37.7% · R 59.6% · Other 2.7%
- 2008→2024 swing
- +4.2pp toward D · 2008: -26.1pp · 2024: -21.9pp
- All cycles
- 2024: R+21.9 2020: R+21.0 2016: R+26.6 2012: R+27.0 2008: R+26.1
Not yet ingested
- Civics
- —
Market trends
- HPI YoY
- ▼ -218.63%
- Current HPI
- 239.5096
- Rent YoY
- —
- Metro
- Kennewick-Richland, WA
- State GDP YoY
- ▲ 4.65%
- F500 in state
- 22
Industry mix (Fortune 500 HQ in WA)
| Industry | F500 HQs | Revenue |
|---|---|---|
| Retail | 2 | $269B |
|
||
| Technology / Retail | 1 | $638B |
|
||
| Technology | 1 | $245B |
|
||
| Telecommunications | 1 | $38B |
|
||
| Food / Beverage | 1 | $36B |
|
||
| Automotive / Trucks | 1 | $34B |
|
||
Price history
1 event — show timeline
- 2026-06-09 Listed $80,000 FSBO.com
Property tax history
+9.5%/yrLatest (2026): $283 · +33.8% YoY. Source: county tax records.
Cash-flow waterfall
monthlySold comps — $/sqft
last 12 mo · ≤1 miLoading sold comps…