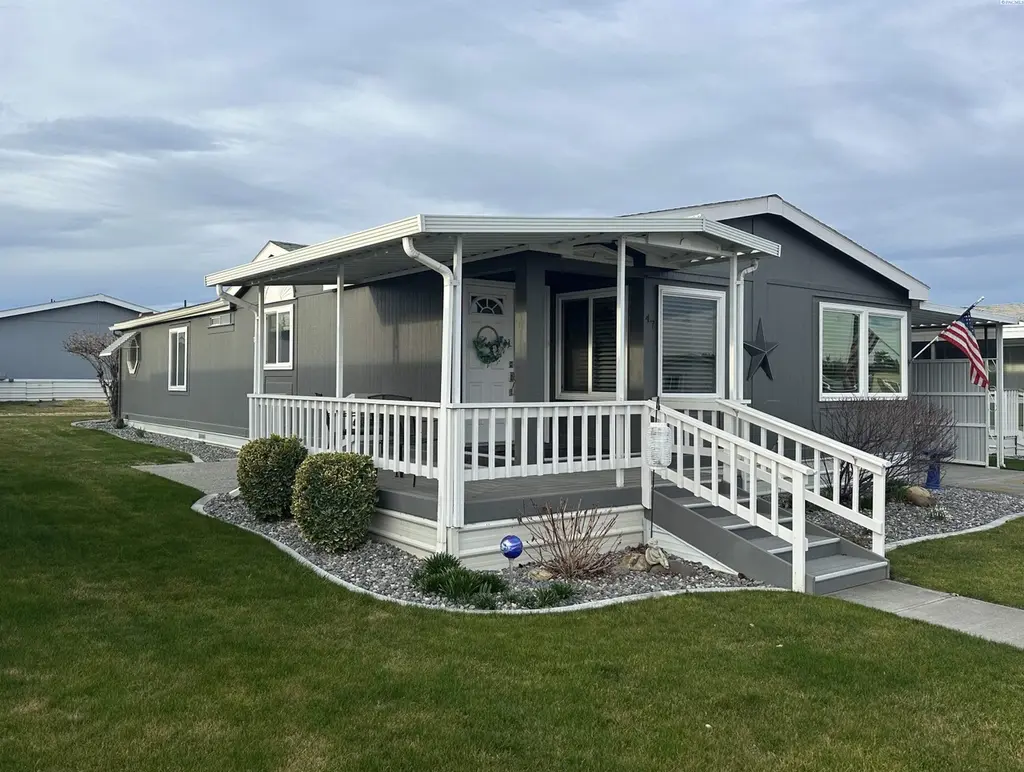
312 S Columbia Center Blvd #47 · Kennewick, WA
Flood risk 1/10 · Minimal
- FEMA flood zone
- X
- Chance of flooding over 30 yrs
- 0.0%
- Est. flood insurance / yr
- $507 – $1,088
Fire risk 4/10 · Minor
- Est. fire insurance / yr
- $604 – $1,122
Heat risk 5/10 · Moderate
- Hot days now (above 98°F)
- 7 days/yr
- Hot days in 30 yrs
- 14 days/yr
Wind risk 1/10 · Minimal
- Chance of severe wind over 30 yrs
- —
Air-quality risk 8/10 · Major
- Unhealthy air days now
- 14 days/yr
- Unhealthy air days in 30 yrs
- 15 days/yr
Risk factors via First Street. Map © Google.
Why this score? — see what drove the B grade
The composite is a weighted blend of 9 inputs, each scored 0–100. Each bar is that input's sub-score; the figure is the points it added to the 100-point composite (weight × sub-score).
- Cash flow +30.0/30.0
- DSCR +10.0/10.0
- 1% rule +8.2/10.0
- ARV discount +7.5/15.0
- Schools +4.6/10.0
- Livability +3.9/5.0
- Rent growth +3.3/5.0
- Condition / age +2.5/5.0
- Appreciation +0.0/10.0
$138,000
🖨 Deal sheet 📄 Offer letter ✓ Due diligence
Listing remarks MLS
MLS# 291357 This completely updated manufactured home is located in the 55+ Desert Pines Community. Desert Pines offers a low-maintenance, worry-free community. This home has been be thoughtfully updated. Updates include the replacement of all plumbing lines, all new plumbing fixtures, new flooring and carpet throughout the home, updated lighting and base trim, refinished doors and cabinets, newly painted interior, new countertops, a new dishwasher, and more! Home includes a washing machine and a dryer. Homesite has a lighted shed easily accessible from the large carport. The home’s exterior was painted in 2024. Park amenities include water, trash, and RV storage. Prospective buyers must be approved by Desert Pines prior to offer acceptance. Inquire with Desert Pines Community management for current lot rent and requirements. Home is vacant and. Property is owned by a Washington State licensed real estate broker. Please contact the listing broker for a showing and for information on how to obtain keys, which are located at the home.
Key facts
- Standing shower
- Ample storage
- Double sink vanity
Tags
Neighborhood map
What this means for you Summary
Snapshot
- This is a 2-bed/2.0-bath manufactured listed at $138k.
Deal economics
- At list price, monthly cash flow is $612 ($7k/yr) — positive.
- The deal already cash-flows at list — no discount required.
- Meets the 1% rule at list price ($2k rent vs $138k).
- Recommended offer: $126k (9.0% below list) — sets the bar for market timing.
- Cap rate 11.6% vs local median 3.3% in Kennewick — top-decile yield for the area; either an underpriced asset or a hidden risk that comps aren't pricing in. Stress-test before assuming the spread holds.
Location & tenants
- Location reads 78/100 on livability (#131 in WA, #2,599 nationally) — a middle-class / working-renter tenant base. Strengths: commute A+, housing A+, health & safety A; Watch: schools D+, amenities D+, crime F.
- Kennewick School District (urban): math 43% / reading 58% proficiency, ranked #141 of 291 in WA (top 48%) — acceptable for families but not a draw, mixed tenant base, ~2y average lease.
- Market conditions: Rents rising (+3.4%/yr); 286 active listings in the ZIP; 16 comparable units currently listed for rent nearby; rentals lingering (median 44d on market — plan ~5-8 weeks vacancy on turnover, expect pricing pressure); 50% of comp listings sitting > 30 days — soft ceiling on asking rent; 1,532 units permitted in Benton County in 2024 (389 in 5+ unit buildings).
- This rent runs 35% of the median local income ($63k/yr) — at the standard rent-burdened threshold; future hikes will face affordability resistance.
Forward outlook
- Local home prices are declining (-3.0%/yr); year-one equity from $954 of loan paydown is wiped out by about $4k of value loss. Plan a longer hold.
- Benton County population projected at +32% by 2050 — long-run rental-demand tailwind backs the buy-and-hold thesis.
- At projected returns (-3.0% appreciation + 3.4% rent growth), your $39k cash investment doubles in ~7 years — after that, you're playing with house money.
Negotiation context
- It's been on market 93 days — a 9% lower offer ($126k) is reasonable based on typical stale-listing flexibility.
- 2 sale attempts since 7y ago; this cycle's ask has dropped $10k (7%) from the opening price — seller is motivated, your offer sets the floor, not the list.
Risks & watch-outs
- Climate carrying-cost: extreme-heat days projected 7→14/yr by 2055 (HVAC capex compounding) — expect insurance premiums to compound above CPI over the hold.
Questions for the listing agent
- It's been on market 93 days. Have you received any prior offers? Is the seller open to a 9% concession, seller financing, or rate buy-down credit?
- Why hasn't it sold? Are there any deal-killer items the seller is aware of (foundation, flood, title, zoning, code violations)?
- Is there a deadline driving the sale (1031 exchange, divorce, estate, relocation)? That informs how much negotiation room exists.
- Schools are D-rated, which usually means shorter tenancies and higher turnover. Who's the typical renter profile here, and what's been the actual vacancy rate?
- Crime grade is F in this area — have there been break-ins, vandalism, or insurance claims at this property in the last 3 years? What carrier currently insures it and at what premium?
- What's the average days-on-market for RENTAL listings here right now (not sales)? A rising rental-DOM trend means longer vacancies and softer asking-rent achievability than the comps imply.
- What's the recent tenant-quality profile in this submarket — average credit score on applications, eviction rate, late-payment / NSF rate, and stable-employment percentage? A property-management company in the area should have these aggregated.
- How much new for-sale + rental construction is in the pipeline within 1–3 miles? Heavy new supply typically softens prices + rents 12–24 months out; constrained supply supports both.
Investment metrics
- 1% rule
- 1.32% ✓
- Cap rate
- 11.61%
- Cash-on-cash
- 19.00%
- DSCR
- 1.85
- GRM
- 6.3
CMA / ARV
- ARV (median comp)
- $76,000
- List price
- $138,000
- Delta
- 81.58%
- Verdict
- OVERPRICED
- Comps
- 17 within 1.0 mi
Show comp detail 12 sales within ~0.75 mi
| Address | Dist | Beds/Ba | Sqft | Sold | Price | $/sf | Match |
|---|---|---|---|---|---|---|---|
| 312 S Columbia Center Blvd. #72 Blvd #72 | 0.05mi | 2/2.0 | 1,456 (-2%) | 3mo | $43,000 | $30 | 92 |
| 312 S Columbia Center Blvd. #56 Blvd #56 | 0.05mi | 2/2.0 | 1,512 (+2%) | 11mo | $118,500 | $78 | 86 |
| 312 S Columbia Center Blvd. #95 Blvd #95 | 0.05mi | 3/2.0 (+1) | 1,440 (-3%) | 2mo | $34,250 | $24 | 85 |
| 312 S Columbia Center Blvd #69 | 0.05mi | 3/2.0 (+1) | 1,484 (-0%) | 9mo | $62,000 | $42 | 84 |
| 312 S Columbia Center Blvd., #68 Blvd | 0.03mi | 3/2.0 (+1) | 1,488 (0%) | 12mo | $142,000 | $95 | 84 |
| 312 S Columbia Center Blvd Unit 21 Blvd #21 | 0.13mi | 3/2.0 (+1) | 1,456 (-2%) | 11mo | $129,000 | $89 | 76 |
| 312 S Columbia Center Blvd. #63 Blvd #63 | 0.10mi | 3/2.0 (+1) | 1,404 (-6%) | 6mo | $65,500 | $47 | 76 |
| 7901 W Clearwater Ave #108 | 0.09mi | 3/2.0 (+1) | 1,560 (+5%) | 8mo | $91,500 | $59 | 76 |
| 312 S Columbia Center Blvd #90 | 0.09mi | 3/2.0 (+1) | 1,620 (+9%) | 11mo | $110,000 | $68 | 67 |
| 312 S Columbia Center Blvd #71 Blvd #71 | 0.05mi | 3/2.0 (+1) | 1,296 (-13%) | 6mo | $70,000 | $54 | 66 |
| 7901 W Clearwater Ave #154 Ave | 0.16mi | 3/2.0 (+1) | 1,296 (-13%) | 5mo | $90,000 | $69 | 62 |
| 7901 W Clearwater Ave #137 | 0.24mi | 3/2.0 (+1) | 1,296 (-13%) | 2mo | $102,500 | $79 | 61 |
Match score weights: distance 35% · size 25% · config 20% · recency 20%. Top-matched comps best support the ARV.
Projected returns pro-forma
-3.0% appreciation · 3.39% rent growth · sell at horizon
- IRR
- 11.2%
- Equity multiple
- 1.45×
- Total profit
- $17,267
- Equity at exit
- $20,576
- IRR
- 20.5%
- Equity multiple
- 2.76×
- Total profit
- $67,969
- Equity at exit
- $11,932
Cash invested: $38,640 (down + closing). Projections, not guarantees.
Landlord ↔ Tenant lean methodology
- Overall (STATE)
- 28 Tenant-Leaning
- State Washington
- 28 Tenant-Leaning · D+8
- County
- — inherits STATE
- City
- — inherits STATE
ZIP-level market 99336
- Rents YoY
- 3.4%
- Active inventory
- 286
- Price-to-rent
- 6.3×
Monthly cashflow live
- Estimated rent
- $1,822 high interval (Pro) →
- Mortgage (P&I)
- −$724
- Tax from tax record
- −$46 /mo · $554/yr
- Insurance
- −$58
- HOA
- −$0
- Vacancy / Maint / Mgmt
- −$383
- Net cashflow
- $612
Break-even live
UW: 25.0% down · 7.5% · 30yr · 1.5% tax · 5.0% vac · 8.0% maint · 8.0% mgmt
Financing live
Cash to close
- Down payment
- $34,500
- Closing costs
- $4,140
- Reserves months
- —
- Total cash needed
- —
Loan-product check · same deal, 3 products live
Conventional
25% down · 7.5% · 30yr
- Down + closing
- —
- Monthly P&I
- —
- Monthly cashflow
- —
- DSCR
- —
- Eligible?
- —
Personal DTI + credit; lowest rate.
DSCR
20% down · 8.5% · 30yr
- Down + closing
- —
- Monthly P&I
- —
- Monthly cashflow
- —
- DSCR
- —
- Eligible?
- —
No personal income docs; deal must DSCR.
Hard money
10% down · 12.0% · 12mo
- Down + closing
- —
- Monthly P&I
- —
- Monthly cashflow
- —
- DSCR
- —
- Eligible?
- —
Short-term bridge; refi at stabilization.
Rent comps 16 comps
| Address | Beds | Baths | Sqft | Rent | $/sqft | DOM | Units | Dist |
|---|---|---|---|---|---|---|---|---|
| 502 S Florida Pl Kennewick, WA | 2.0 | 1.0 | 1003 | $1,850 | $1.84 | 43d | 1 | 0.24mi |
| 8180 W 4th Ave Kennewick, WA | 2.0–3.0 | 2.0 | 1202 | $1,925 | $1.60 | 13d | 4 | 0.30mi |
| 7803 W Deschutes Ave Kennewick, WA | 1.0–3.0 | 1.0–2.0 | 925 | $1,770 | $1.91 | 13d | 13 | 0.32mi |
| 7960 W 10th Ave Kennewick, WA | 1.0–2.0 | 1.0–2.0 | 946 | $2,345 | $2.48 | 13d | 9 | 0.57mi |
| 7968 W 10th Ave Kennewick, WA | 1.0–3.0 | 1.0–2.0 | 951 | $1,875 | $1.97 | 13d | 10 | 0.57mi |
| 6809 W Kennewick Ave Unit C Kennewick, WA | 2.0 | 1.0 | 1043 | $1,250 | $1.20 | 43d | 1 | 0.78mi |
| 8831 W Entiat Ave Kennewick, WA | 3.0 | 2.0 | 1232 | $1,995 | $1.62 | 43d | 1 | 0.85mi |
| 24 S Quay St Unit 3 Kennewick, WA | 3.0 | 1.5 | 1128 | $1,625 | $1.44 | 13d | 1 | 0.85mi |
| 725 N Center Pkwy Kennewick, WA | 1.0–3.0 | 1.0–2.0 | 1086 | $1,906 | $1.75 | 13d | 9 | 0.92mi |
| 1080 N Montana St Kennewick, WA | 3.0 | 2.0 | 1842 | $2,600 | $1.41 | 43d | 1 | 0.99mi |
| 883 S Zeelar St Kennewick, WA | 3.0 | 2.5 | 1735 | $2,395 | $1.38 | 43d | 1 | 1.22mi |
| 33 N Jefferson Pl Unit 110 Kennewick, WA | 3.0 | 2.5 | 1536 | $1,950 | $1.27 | 43d | 1 | 1.37mi |
| 5702 W Kennewick Pl #110 Kennewick, WA | 3.0 | 2.5 | 1435 | $1,695 | $1.18 | 13d | 1 | 1.43mi |
| 100 N Irving Pl Kennewick, WA | 1.0–3.0 | 1.0–1.5 | 939 | $1,488 | $1.58 | 13d | 11 | 1.49mi |
| 100 N Irving Pl Unit K101 Kennewick, WA | 3.0 | 1.5 | 1120 | $1,700 | $1.52 | 44d | 1 | 1.50mi |
| 100 N Irving Pl Unit H101 Kennewick, WA | 3.0 | 1.5 | 1120 | $1,699 | $1.52 | 44d | 1 | 1.50mi |
Listing history 19 events
-
2026-06-18days on market $138,000 Active 93 DOM
-
2026-06-17days on market $138,000 Active 92 DOM
-
2026-06-16days on market $138,000 Active 91 DOM
-
2026-06-15days on market $138,000 Active 90 DOM
-
2026-06-14days on market $138,000 Active 88 DOM
-
2026-06-13days on market $138,000 Active 87 DOM
-
2026-06-10days on market $138,000 Active 85 DOM
-
2026-06-09days on market $138,000 Active 84 DOM
-
2026-06-08days on market $138,000 Active 83 DOM
-
2026-06-07days on market $138,000 Active 82 DOM
-
2026-06-05days on market $138,000 Active 79 DOM
-
2026-06-03days on market $138,000 Active 78 DOM
-
2026-06-02days on market $138,000 Active 77 DOM
-
2026-06-01days on market $138,000 Active 76 DOM
-
2026-05-31days on market $138,000 Active 75 DOM
-
2026-05-30days on market $138,000 Active 74 DOM
-
2026-04-27price $138,000 1054-char remark
Show marketing remark (1054 chars)
MLS# 291357 This completely updated manufactured home is located in the 55+ Desert Pines Community. Desert Pines offers a low-maintenance, worry-free community. This home has been be thoughtfully updated. Updates include the replacement of all plumbing lines, all new plumbing fixtures, new flooring and carpet throughout the home, updated lighting and base trim, refinished doors and cabinets, newly painted interior, new countertops, a new dishwasher, and more! Home includes a washing machine and a dryer. Homesite has a lighted shed easily accessible from the large carport. The home’s exterior was painted in 2024. Park amenities include water, trash, and RV storage. Prospective buyers must be approved by Desert Pines prior to offer acceptance. Inquire with Desert Pines Community management for current lot rent and requirements. Home is vacant and. Property is owned by a Washington State licensed real estate broker. Please contact the listing broker for a showing and for information on how to obtain keys, which are located at the home.
-
2026-03-18$148,000 Active 1054-char remark
Show marketing remark (1054 chars)
MLS# 291357 This completely updated manufactured home is located in the 55+ Desert Pines Community. Desert Pines offers a low-maintenance, worry-free community. This home has been be thoughtfully updated. Updates include the replacement of all plumbing lines, all new plumbing fixtures, new flooring and carpet throughout the home, updated lighting and base trim, refinished doors and cabinets, newly painted interior, new countertops, a new dishwasher, and more! Home includes a washing machine and a dryer. Homesite has a lighted shed easily accessible from the large carport. The home’s exterior was painted in 2024. Park amenities include water, trash, and RV storage. Prospective buyers must be approved by Desert Pines prior to offer acceptance. Inquire with Desert Pines Community management for current lot rent and requirements. Home is vacant and. Property is owned by a Washington State licensed real estate broker. Please contact the listing broker for a showing and for information on how to obtain keys, which are located at the home.
-
2019-01-08$75,000
ⓘ Source: listings_history table (triggers on properties + properties_extension) + one-shot
backfill from property_details.listing_events for pre-trigger history.
Tax reassessment forecast WA · Resets to sale price
- Current annual tax
- $554 · $46/mo
- Projected year-2 tax
- $1,352 · $113/mo
- Expected delta
- +$798/yr (+$67/mo · 144.0%)
ⓘ Screening estimate from a state-policy table — verify with the county assessor before closing.
Climate risk First Street
- Flood 1/10 Low FEMA zone X · 0% chance over 30 yrs
- Wildfire 4/10 Moderate
- Heat 5/10 Major 7 d/yr ≥98°F today · 14 d/yr by 30 yrs out
- Wind 1/10 Low
- Air quality 8/10 Severe 14 unhealthy d/yr today · 15 by 30 yrs out
Nearby sold comps map
Loading sold comps map…
Walkable amenities ~0.75 mi
Loading nearby amenities…
Taxation est. · year 1
- Rental income
- $21,860
- − Mortgage interest
- −$7,730
- − Property taxes
- −$554
- − Insurance
- −$690
- − Repairs & maintenance
- −$1,749
- − Management
- −$1,749
- − Depreciation
- −$4,015
- Taxable income
- $5,373
- Est. tax owed @ 24.0%
- −$1,290
- After-tax cash flow
- $6,051/yr
For passive investors: Depreciation is non-cash, so a rental often shows a tax loss while cash-flowing — sheltering income. Rental losses are passive: they offset passive income freely, and up to $25,000/yr can offset ordinary (W-2) income if you actively participate and your MAGI is under $100k (phasing out to $0 by $150k); unused losses carry forward. On sale, claimed depreciation is recaptured at up to 25%, and gains may owe capital-gains tax (a 1031 exchange can defer both). Figures are a year-1 estimate at your 24.0% rate — not tax advice; consult a CPA.
Schools (NCES district)
- District
- Kennewick School District
- NCES district ID
- 5303930
- Math proficiency
- 43% ▼ -1.00%
- Reading proficiency
- 58% ▬ 0.00%
- Median HH income
- $54,191
- Composite
- 45.56/100
- National rank
- #5667
- State rank
- #141 of 291 in WA
Livability — Kennewick
- Score
- 78/100
- State rank
- #131
- US rank
- #2599
Category grades
Schools grade is shown separately in the Schools card above.
Census & demographics
- Census place
- Kennewick, WA
- County
- Benton County · 186,895 people
- City population
- 104,655
- Metro
- Kennewick-Richland, WA
- Population (ZIP)
- 50,735
- Household income
- $62,527
- Rent vs Own
- Severe rent burden
- 2605.0
Population outlook (Benton County) Hauer SSP2
- Today (2025)
- 219,421 people
- By 2030
- 233,813 · +6.6%
- By 2040
- 262,134 · +19.5%
- By 2050
- 290,100 · +32.2%
- By 2075
- 363,525 · +65.7%
- By 2100
- 418,667 · +90.8%
Race, ethnicity, and origin ACS 2023
- Neighborhood character
- Diverse neighborhood (Simpson 0.56)
- Race & ethnicity
- White 55% Hispanic / Latino 37% Two or more races 15% Black 3% Asian 2% Native American 1%
- Hispanic origin (detail)
- Mexican 31% Cuban 2%
- Common ancestry
- Portuguese 4% Slovak 3% Romanian 1%
- Foreign-born
- 16% · Canada, Jamaica
- Languages at home
- 68% English-only · Spanish 29% Arabic 1%
Political lean MEDSL · Benton
- 2024 margin
- Strong R (+21.9) · D 37.7% · R 59.6% · Other 2.7%
- 2008→2024 swing
- +4.2pp toward D · 2008: -26.1pp · 2024: -21.9pp
- All cycles
- 2024: R+21.9 2020: R+21.0 2016: R+26.6 2012: R+27.0 2008: R+26.1
Not yet ingested
- Civics
- —
Market trends
- HPI YoY
- ▼ -408.26%
- Current HPI
- 256.1143
- Rent YoY
- ▲ 3.39%
- Metro
- Kennewick-Richland, WA
- State GDP YoY
- ▲ 4.65%
- F500 in state
- 22
Industry mix (Fortune 500 HQ in WA)
| Industry | F500 HQs | Revenue |
|---|---|---|
| Retail | 2 | $269B |
|
||
| Technology / Retail | 1 | $638B |
|
||
| Technology | 1 | $245B |
|
||
| Telecommunications | 1 | $38B |
|
||
| Food / Beverage | 1 | $36B |
|
||
| Automotive / Trucks | 1 | $34B |
|
||
Price history
+84.0% since first listed3 events — show timeline
- 2026-04-27 Price Changed $138,000 PACMLS
- 2026-03-18 Listed $148,000 PACMLS
- 2019-01-08 Listed $75,000 PACMLS
Property tax history
-0.3%/yrLatest (2026): $554 · -5.7% YoY. Source: county tax records.
Cash-flow waterfall
monthlySold comps — $/sqft
last 12 mo · ≤1 miLoading sold comps…