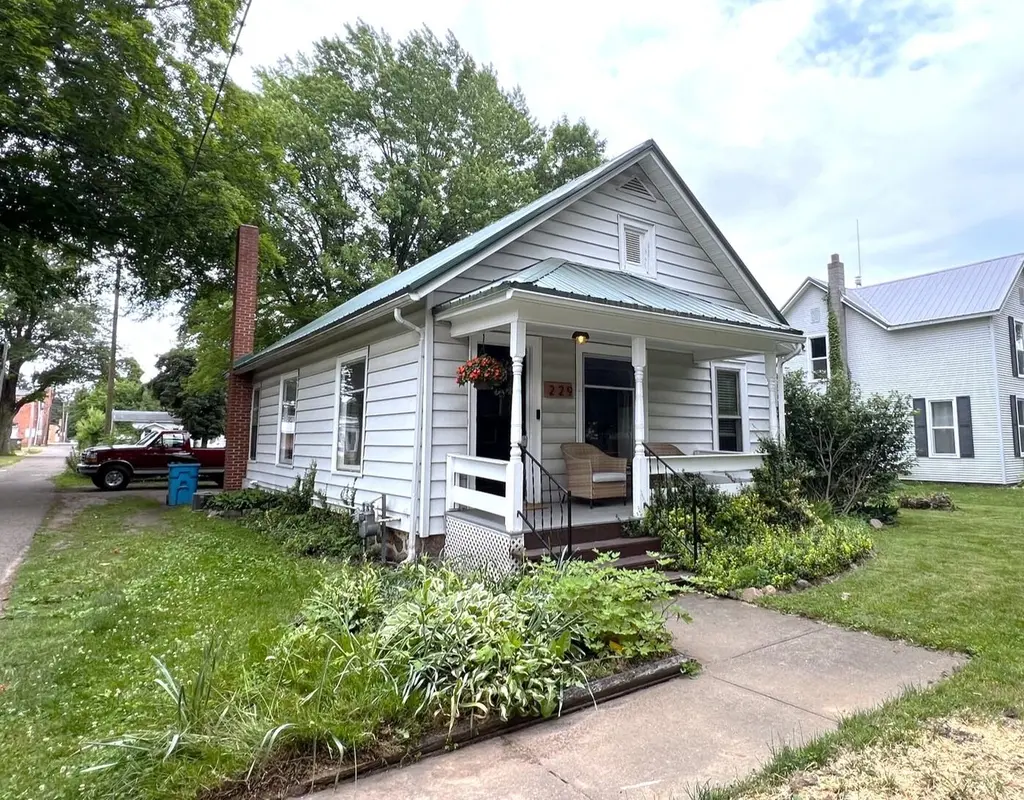
229 5th St · Burr Oak, MI
Flood risk 1/10 · Minimal
- FEMA flood zone
- X (unshaded)
- Chance of flooding over 30 yrs
- 0.0%
- Est. flood insurance / yr
- $473 – $860
Fire risk 1/10 · Minimal
- Est. fire insurance / yr
- $784 – $1,456
Heat risk 2/10 · Minimal
- Hot days now (above 98°F)
- 7 days/yr
- Hot days in 30 yrs
- 16 days/yr
Wind risk 2/10 · Minimal
- Chance of severe wind over 30 yrs
- —
Air-quality risk 2/10 · Minimal
- Unhealthy air days now
- 1 days/yr
- Unhealthy air days in 30 yrs
- 2 days/yr
Risk factors via First Street. Map © Google.
Why this score? — see what drove the D grade
The composite is a weighted blend of 9 inputs, each scored 0–100. Each bar is that input's sub-score; the figure is the points it added to the 100-point composite (weight × sub-score).
- ARV discount +10.8/15.0
- Cash flow +9.7/30.0
- Appreciation +5.7/10.0
- Livability +3.2/5.0
- DSCR +2.7/10.0
- Schools +2.6/10.0
- Rent growth +2.5/5.0
- Condition / age +2.5/5.0
- 1% rule +2.0/10.0
$128,000
🖨 Deal sheet 📄 Offer letter ✓ Due diligence
Listing remarks
Charming one-story home filled with character and timeless appeal! Beautiful original woodwork and hardwood floors create a warm and inviting atmosphere throughout. The open floor plan features spacious rooms, including a large kitchen, formal dining room, and comfortable living room--perfect for everyday living and entertaining. The main-floor laundry room offers additional storage and pantry space for added convenience. This home includes two bedrooms, a back mudroom entrance, and a covered front porch ideal for relaxing. The attached one-car garage is currently set up as an entertaining area, providing flexible use of the space. The kitchen stove and refrigerator are included, making thi
Key facts
- Open floor plan
- Formal dining room
- Large kitchen
Tags
Property features AI
Exterior
- Parking: Detached garage with garage door opener (1 car)
- Utilities: Public water; Public sewer; Natural gas connected; Phone available
- Home design: Single-family residence; Residential zoning
- Construction: Vinyl siding; Metal roof; Partial finished lower level
- Exterior features: Level lot; Cross street at W. Front and Eagle
Interior
- Kitchen: Refrigerator; Range
- Flooring: Wood flooring
- Bathrooms: 1 full bathroom
- Heating & cooling: Forced air heating (natural gas); Ceiling fan(s)
- Interior features: Partial basement; 6 total rooms
- Laundry & utility: Main-level laundry
Neighborhood map
What this means for you Summary
Snapshot
- This is a 2-bed/1.0-bath single-family listed at $128k.
Deal economics
- At list price, monthly cash flow is $-84 ($-1k/yr) — negative.
- To cash-flow at today's rent, offer at most $113k (11.6% below list).
- To meet the 1% rule (rent ≥ 1% of price), the offer needs to be $90k (29.7% below list).
- Recommended offer: $90k (29.7% below list) — sets the bar for 1% rule.
Location & tenants
- Location reads 65/100 on livability (#452 in MI) — a middle-class / working-renter tenant base. Strengths: cost of living A+, housing A+, health & safety A-; Watch: employment C-, schools F, crime F.
- Burr Oak Community School District (rural): math 25% / reading 30% proficiency, ranked #569 of 760 in MI (top 75%) — low school quality limits family demand, transient renter base, plan for 1-2y turnover; 63% free/reduced lunch — lower-income household profile, screen leases tightly.
- Market conditions: 8 active listings in the ZIP; 125 units permitted in St. Joseph County in 2024 (0 in 5+ unit buildings).
Forward outlook
- In year one you build about $3k of equity ($885 loan paydown + $2k appreciation (1.4% local appreciation)).
- St. Joseph County population projected at -16% by 2050 — secular population decline; favor cash flow + early exit over multi-decade hold.
Negotiation context
- Only 9 days on market — expect competitive offers; lowballing is unlikely to land.
- 2 sale attempts since 4y ago with the ask held roughly flat each time — persistent listings suggest the price (not the market) is what's stuck; bring a comps-based counter.
- Current owner paid $50k; list at $128k implies a 156% gain — meaningful room to come down on a strong offer.
Risks & watch-outs
- Watch-outs: built in 1924 — expect roof / HVAC / electrical / plumbing capex.
Questions for the listing agent
- What do current leases actually rent for vs. the listed asking? Can we see a recent rent roll and the last 12 months of T-12 income?
- Built in 1924 — when were the roof, HVAC, electrical panel, plumbing, and water heater last replaced?
- Is there a deadline driving the sale (1031 exchange, divorce, estate, relocation)? That informs how much negotiation room exists.
- Schools are F-rated, which usually means shorter tenancies and higher turnover. Who's the typical renter profile here, and what's been the actual vacancy rate?
- Crime grade is F in this area — have there been break-ins, vandalism, or insurance claims at this property in the last 3 years? What carrier currently insures it and at what premium?
- The area grade is low — what's the realistic commute time and amenity access for the typical tenant pool here? Any planned neighborhood developments (good or bad) we should know about?
- What's the average days-on-market for RENTAL listings here right now (not sales)? A rising rental-DOM trend means longer vacancies and softer asking-rent achievability than the comps imply.
- What's the recent tenant-quality profile in this submarket — average credit score on applications, eviction rate, late-payment / NSF rate, and stable-employment percentage? A property-management company in the area should have these aggregated.
- How much new for-sale + rental construction is in the pipeline within 1–3 miles? Heavy new supply typically softens prices + rents 12–24 months out; constrained supply supports both.
Investment metrics
- 1% rule
- 0.70% ✗
- Cap rate
- 5.51%
- Cash-on-cash
- -2.81%
- DSCR
- 0.87
- GRM
- 11.8
CMA / ARV
- ARV (on-the-fly)
- $138,240
- Comps found
- 4
Show comp detail 4 sales within ~0.75 mi
| Address | Dist | Beds/Ba | Sqft | Sold | Price | $/sf | Match |
|---|---|---|---|---|---|---|---|
| 238 Mill St | 0.19mi | 3/2.0 (+1) | 999 (+4%) | 5mo | $175,000 | $175 | 71 |
| 604 W Front St | 0.19mi | 2/1.0 | 1,077 (+12%) | 1mo | $155,000 | $144 | 70 |
| 121 S 3rd St | 0.15mi | 3/1.0 (+1) | 900 (-6%) | 20mo | $52,000 | $58 | 61 |
| 66280 Burr Oak Rd | 0.72mi | 1/1.0 (-1) | 1,088 (+13%) | 21mo | $155,000 | $142 | 22 |
Match score weights: distance 35% · size 25% · config 20% · recency 20%. Top-matched comps best support the ARV.
Projected returns pro-forma
1.41% appreciation · 3.0% rent growth · sell at horizon
- IRR
- -0.2%
- Equity multiple
- 0.99×
- Total profit
- $-405
- Equity at exit
- $46,450
- IRR
- 4.3%
- Equity multiple
- 1.55×
- Total profit
- $19,874
- Equity at exit
- $63,916
Cash invested: $35,840 (down + closing). Projections, not guarantees.
Landlord ↔ Tenant lean methodology
- Overall (STATE)
- 62 Landlord-Friendly
- State Michigan
- 62 Landlord-Friendly · EVEN
- County
- — inherits STATE
- City
- — inherits STATE
ZIP-level market 49030
- Home prices YoY
- 0.6%
- Active inventory
- 8
- Price-to-rent
- 11.8×
Monthly cashflow live
- Estimated rent
- $900 medium interval (Pro) →
- Mortgage (P&I)
- −$671
- Tax from tax record
- −$71 /mo · $848/yr
- Insurance
- −$53
- HOA
- −$0
- Vacancy / Maint / Mgmt
- −$189
- Net cashflow
- $-84
Break-even live
Sensitivity live
| Price | -10% $-11 | -5% $-48 | +0% $-84 | +5% $-120 | +10% $-156 |
|---|---|---|---|---|---|
| Rent | -10% $-155 | -5% $-119 | +0% $-84 | +5% $-48 | +10% $-13 |
| Rate | -1.0pp $-19 | -0.5pp $-51 | base $-84 | +0.5pp $-117 | +1.0pp $-151 |
UW: 25.0% down · 7.5% · 30yr · 1.5% tax · 5.0% vac · 8.0% maint · 8.0% mgmt
Financing live
Cash to close
- Down payment
- $32,000
- Closing costs
- $3,840
- Reserves months
- —
- Total cash needed
- —
Loan-product check · same deal, 3 products live
Conventional
25% down · 7.5% · 30yr
- Down + closing
- —
- Monthly P&I
- —
- Monthly cashflow
- —
- DSCR
- —
- Eligible?
- —
Personal DTI + credit; lowest rate.
DSCR
20% down · 8.5% · 30yr
- Down + closing
- —
- Monthly P&I
- —
- Monthly cashflow
- —
- DSCR
- —
- Eligible?
- —
No personal income docs; deal must DSCR.
Hard money
10% down · 12.0% · 12mo
- Down + closing
- —
- Monthly P&I
- —
- Monthly cashflow
- —
- DSCR
- —
- Eligible?
- —
Short-term bridge; refi at stabilization.
Listing history 8 events
-
2026-06-18days on market $128,000 Active 9 DOM
-
2026-06-17days on market $128,000 Active 8 DOM
-
2026-06-16days on market $128,000 Active 7 DOM
-
2026-06-15days on market $128,000 Active 6 DOM
-
2026-06-13days on market $128,000 Active 4 DOM
-
2026-06-12days on market $128,000 Active 3 DOM
-
2026-06-09remarks 699-char remark
-
2026-06-09$128,000 Active 1 DOM
ⓘ Source: listings_history table (triggers on properties + properties_extension) + one-shot
backfill from property_details.listing_events for pre-trigger history.
Tax reassessment forecast MI · Partial reset (capped growth)
- Current annual tax
- $848 · $71/mo
- Projected year-2 tax
- $1,410 · $117/mo
- Expected delta
- +$562/yr (+$47/mo · 66.2%)
ⓘ Screening estimate from a state-policy table — verify with the county assessor before closing.
Climate risk First Street
- Flood 1/10 Low FEMA zone X (unshaded) · 0% chance over 30 yrs
- Wildfire 1/10 Low
- Heat 2/10 Low 7 d/yr ≥98°F today · 16 d/yr by 30 yrs out
- Wind 2/10 Low
- Air quality 2/10 Low 1 unhealthy d/yr today · 2 by 30 yrs out
Nearby sold comps map
Loading sold comps map…
Walkable amenities ~0.75 mi
Loading nearby amenities…
Taxation est. · year 1
- Rental income
- $10,805
- − Mortgage interest
- −$7,170
- − Property taxes
- −$848
- − Insurance
- −$640
- − Repairs & maintenance
- −$864
- − Management
- −$864
- − Depreciation
- −$3,724
- Taxable loss
- −$3,306
- Est. tax savings @ 24.0%
- +$793
- After-tax cash flow
- $-214/yr
For passive investors: Depreciation is non-cash, so a rental often shows a tax loss while cash-flowing — sheltering income. Rental losses are passive: they offset passive income freely, and up to $25,000/yr can offset ordinary (W-2) income if you actively participate and your MAGI is under $100k (phasing out to $0 by $150k); unused losses carry forward. On sale, claimed depreciation is recaptured at up to 25%, and gains may owe capital-gains tax (a 1031 exchange can defer both). Figures are a year-1 estimate at your 24.0% rate — not tax advice; consult a CPA.
Schools (NCES district)
- District
- Burr Oak Community School District
- NCES district ID
- 2607410
- Math proficiency
- 25% ▲ 15.00%
- Reading proficiency
- 30% ▲ 10.00%
- Median HH income
- $42,589
- Composite
- 26.35/100
- National rank
- #12672
- State rank
- #569 of 760 in MI
Livability — Burr Oak
- Score
- 65/100
- State rank
- #452
- US rank
- #12662
Category grades
Schools grade is shown separately in the Schools card above.
Census & demographics
- Census place
- Burr Oak, MI
- Population (ZIP)
- 2,435
Population outlook (St. Joseph County) Hauer SSP2
- Today (2025)
- 58,726 people
- By 2030
- 57,030 · -2.9%
- By 2040
- 53,266 · -9.3%
- By 2050
- 49,343 · -16.0%
- By 2075
- 40,441 · -31.1%
- By 2100
- 31,981 · -45.5%
Race, ethnicity, and origin ACS 2023
- Neighborhood character
- Predominantly White (89%)
- Race & ethnicity
- White 89% Two or more races 8% Hispanic / Latino 7%
- Hispanic origin (detail)
- Mexican 6%
- Common ancestry
- Italian 7% Iranian 4% Slovak 3%
- Foreign-born
- 4% · Canada
- Languages at home
- 85% English-only · German/W. Germanic 10% Spanish 5%
Political lean MEDSL · St. Joseph
- 2024 margin
- Solid R (+34.0) · D 32.2% · R 66.2% · Other 1.5%
- 2008→2024 swing
- -31.8pp toward R · 2008: -2.2pp · 2024: -34.0pp
- All cycles
- 2024: R+34.0 2020: R+31.7 2016: R+31.0 2012: R+12.3 2008: R+2.2
Not yet ingested
- Civics
- —
Market trends
- HPI YoY
- ▲ 1.41%
- Current HPI
- 221.0439
- Rent YoY
- —
- Metro
- —
- State GDP YoY
- ▲ 1.37%
- F500 in state
- 28
Industry mix (Fortune 500 HQ in MI)
| Industry | F500 HQs | Revenue |
|---|---|---|
| Automotive Parts | 3 | $48B |
|
||
| Automotive | 2 | $372B |
|
||
| Chemicals | 1 | $45B |
|
||
| Automotive Retail | 1 | $29B |
|
||
| Healthcare / Medical Devices | 1 | $23B |
|
||
| Automotive Technology | 1 | $20B |
|
||
Price history
+156.0% since first listed4 events — show timeline
- 2026-06-09 Listed $128,000 REALCOMP
- 2022-09-19 Listing Removed — REALCOMP
- 2022-07-20 Listed $99,000 REALCOMP
- 2019-08-20 Sold (Public Records) $50,000 Public Records
Property tax history
+6.0%/yrLatest (2025): $848 · -26.8% YoY. Source: county tax records.
Cash-flow waterfall
monthlySold comps — $/sqft
last 12 mo · ≤1 miLoading sold comps…