 5-Plex
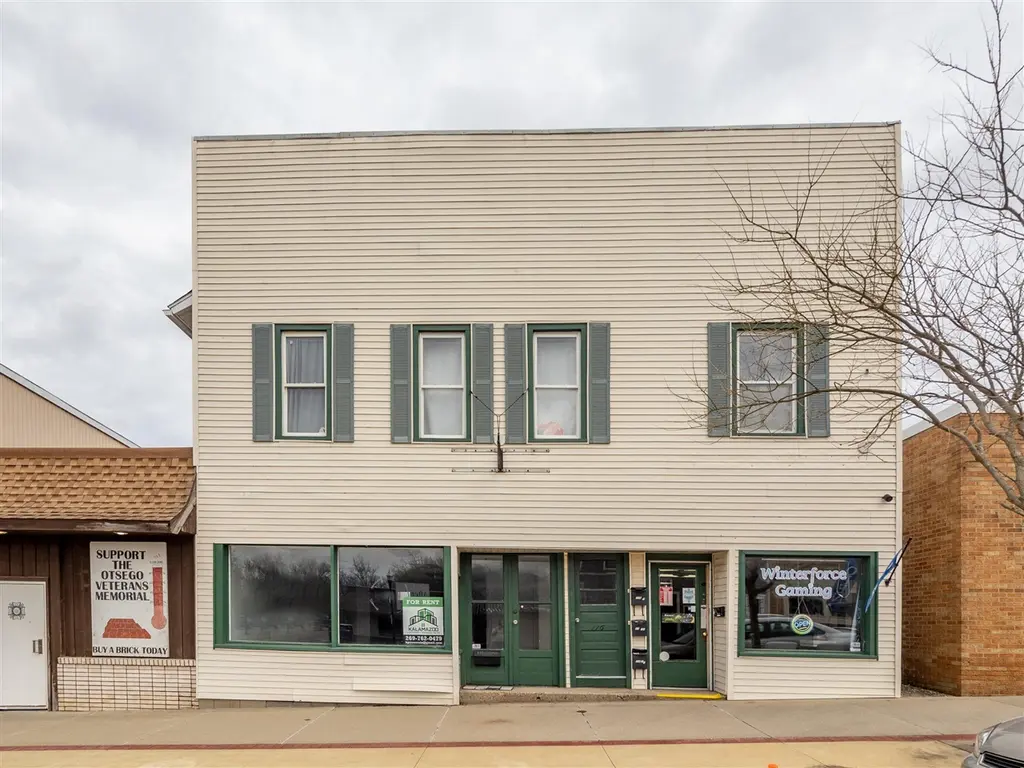
120 N Farmer St · Otsego, MI
Flood risk 1/10 · Minimal
- FEMA flood zone
- X
- Chance of flooding over 30 yrs
- 0.0%
- Est. flood insurance / yr
- $435 – $905
Fire risk 1/10 · Minimal
- Est. fire insurance / yr
- $784 – $1,456
Heat risk 3/10 · Minor
- Hot days now (above threshold)
- 7 days/yr
- Hot days in 30 yrs
- 16 days/yr
Wind risk No data
- Chance of severe wind over 30 yrs
- —
Air-quality risk 2/10 · Minimal
- Unhealthy air days now
- 1 days/yr
- Unhealthy air days in 30 yrs
- 1 days/yr
Risk factors via First Street. Map © Google.
Why this score? — see what drove the B- grade
The composite is a weighted blend of 9 inputs, each scored 0–100. Each bar is that input's sub-score; the figure is the points it added to the 100-point composite (weight × sub-score).
- Cash flow +30.0/30.0
- DSCR +10.0/10.0
- 1% rule +9.3/10.0
- ARV discount +7.5/15.0
- Schools +4.1/10.0
- Livability +3.7/5.0
- Rent growth +2.5/5.0
- Condition / age +2.5/5.0
- Appreciation +0.0/10.0
$375,000
🖨 Deal sheet 📄 Offer letter ✓ Due diligence
Multi-family units
County records classify this as Multi-Family (2-4 Unit). Listing-text estimate: 5 units. estimate disagrees with records
Listing remarks MLS
Turnkey investment opportunity in the heart of downtown Otsego! This 5-unit mixed-use building offers strong, consistent cash flow with a current gross income of $4,030/month and an impressively low expense ratio. A major bonus for investors--city-owned parking means reduced maintenance responsibilities and costs, as the municipality handles parking areas and sidewalks. The property features a versatile unit mix, including two approximately 950 sq ft main-floor commercial suites with excellent street presence, plus three residential units: a well-appointed 1-bedroom/1-bath apartment, a spacious 2-bedroom/1-bath unit, and a studio apartment. All units have seen significant updates, providing a clean, modern feel that attracts and retains quality tenants. Whether you're looking to expand your portfolio or secure a stable, income-producing asset, this property checks all the boxes. Fully occupied, professionally positioned, and truly turnkey--this is a rare opportunity to own alow-maintenance, passive income generator in a growing downtown market.
Key facts
- Significant updates
- Mixed-use building
- City-owned parking
Tags
Neighborhood map
What this means for you Summary
Snapshot
- This is a 1×1bd/1ba + 1×2bd/1ba + 3×3bd/1ba units multifamily listed at $375k.
Deal economics
- At list price, monthly cash flow is $2k ($20k/yr) — positive. Per door: $332/mo.
- The deal already cash-flows at list — no discount required.
- Meets the 1% rule at list price ($5k rent vs $375k).
- Recommended offer: $352k (6.0% below list) — sets the bar for market timing.
- Cap rate 11.6% vs local median 1.8% in Otsego — top-decile yield for the area; either an underpriced asset or a hidden risk that comps aren't pricing in. Stress-test before assuming the spread holds.
Location & tenants
- Location reads 73/100 on livability (#216 in MI) — a middle-class / working-renter tenant base. Strengths: cost of living A+, housing A+, schools A-; Watch: employment D+, amenities F, commute F.
- Otsego Public Schools (town): math 39% / reading 57% proficiency, ranked #118 of 540 in MI (top 22%) — families likely to look elsewhere, expect single-tenant / working-renter base with shorter leases.
- Market conditions: 76 active listings in the ZIP; 419 units permitted in Allegan County in 2024 (0 in 5+ unit buildings).
Forward outlook
- Local home prices are declining (-3.0%/yr); year-one equity from $3k of loan paydown is wiped out by about $11k of value loss. Plan a longer hold.
- At projected returns (-3.0% appreciation + 3.0% rent growth), your $105k cash investment doubles in ~7 years — after that, you're playing with house money.
Negotiation context
- It's been on market 62 days — a 6% lower offer ($352k) is reasonable based on typical stale-listing flexibility.
- 12 sale attempts since 19y ago with the ask held roughly flat each time — persistent listings suggest the price (not the market) is what's stuck; bring a comps-based counter.
Risks & watch-outs
- Watch-outs: built in 1870 — expect roof / HVAC / electrical / plumbing capex.
Questions for the listing agent
- It's been on market 62 days. Have you received any prior offers? Is the seller open to a 6% concession, seller financing, or rate buy-down credit?
- Can we see the unit-by-unit rent roll, current vacancy, and any below-market leases? What's the average tenancy length?
- What capital expenditures (roof, boiler, parking lot, exteriors) have been made in the last 5 years, and what's planned in the next 2?
- Built in 1870 — when were the roof, HVAC, electrical panel, plumbing, and water heater last replaced?
- Why hasn't it sold? Are there any deal-killer items the seller is aware of (foundation, flood, title, zoning, code violations)?
- Is there a deadline driving the sale (1031 exchange, divorce, estate, relocation)? That informs how much negotiation room exists.
- Schools are A-rated — typically a magnet for longer-tenancy family renters. What's the average tenant stay here, and is there a school-zone premium baked into asking?
- What's the average days-on-market for RENTAL listings here right now (not sales)? A rising rental-DOM trend means longer vacancies and softer asking-rent achievability than the comps imply.
- What's the recent tenant-quality profile in this submarket — average credit score on applications, eviction rate, late-payment / NSF rate, and stable-employment percentage? A property-management company in the area should have these aggregated.
- How much new apartment / multifamily construction is in the pipeline within 1–3 miles? Heavy new supply (>2% of stock underway) typically softens rents 12–24 months out; light construction supports rent growth.
Investment metrics
- 1% rule
- 1.43% ✓
- Cap rate
- 11.60%
- Cash-on-cash
- 18.96%
- DSCR
- 1.84
- GRM
- 5.8
CMA / ARV
No comps found within radius.
Projected returns pro-forma
-3.0% appreciation · 3.0% rent growth · sell at horizon
- IRR
- 10.8%
- Equity multiple
- 1.43×
- Total profit
- $44,956
- Equity at exit
- $55,914
- IRR
- 19.9%
- Equity multiple
- 2.67×
- Total profit
- $175,506
- Equity at exit
- $32,423
Cash invested: $105,000 (down + closing). Projections, not guarantees.
Landlord ↔ Tenant lean methodology
- Overall (STATE)
- 62 Landlord-Friendly
- State Michigan
- 62 Landlord-Friendly · EVEN
- County
- — inherits STATE
- City
- — inherits STATE
ZIP-level market 49078
- Home prices YoY
- -32.7%
- Active inventory
- 76
- Price-to-rent
- 32.9×
Monthly cashflow live
- Estimated rent
- $5,380 medium interval (Pro) →
- Mortgage (P&I)
- −$1,967
- Tax est. 1.5%
- −$469 /mo · $5,625/yr
- Insurance
- −$156
- HOA
- −$0
- Vacancy / Maint / Mgmt
- −$1,130
- Net cashflow
- $1,659
Break-even live
5-unit breakdown (identical units grouped — click to expand)
| Units | Beds | Baths | Est. rent |
|---|---|---|---|
| 1× unit | 1 | 1 | $950 |
| 1× unit | 2 | 1 | $950 |
| 3× units | 3 | 1 | $3,480 |
| #3 | 3 | 1 | $1,160 |
| #4 | 3 | 1 | $1,160 |
| #5 | 3 | 1 | $1,160 |
| Total (5 units) | $5,380 | ||
UW: 25.0% down · 7.5% · 30yr · 1.5% tax · 5.0% vac · 8.0% maint · 8.0% mgmt
Financing live
Cash to close
- Down payment
- $93,750
- Closing costs
- $11,250
- Reserves months
- —
- Total cash needed
- —
Loan-product check · same deal, 3 products live
Conventional
25% down · 7.5% · 30yr
- Down + closing
- —
- Monthly P&I
- —
- Monthly cashflow
- —
- DSCR
- —
- Eligible?
- —
Personal DTI + credit; lowest rate.
DSCR
20% down · 8.5% · 30yr
- Down + closing
- —
- Monthly P&I
- —
- Monthly cashflow
- —
- DSCR
- —
- Eligible?
- —
No personal income docs; deal must DSCR.
Hard money
10% down · 12.0% · 12mo
- Down + closing
- —
- Monthly P&I
- —
- Monthly cashflow
- —
- DSCR
- —
- Eligible?
- —
Short-term bridge; refi at stabilization.
Listing history 39 events
-
2026-06-18days on market $375,000 Active 62 DOM
-
2026-06-17days on market $375,000 Active 61 DOM
-
2026-06-16days on market $375,000 Active 60 DOM
-
2026-06-15days on market $375,000 Active 59 DOM
-
2026-06-14days on market $375,000 Active 57 DOM
-
2026-06-13days on market $375,000 Active 56 DOM
-
2026-06-10days on market $375,000 Active 54 DOM
-
2026-06-09days on market $375,000 Active 53 DOM
-
2026-06-08days on market $375,000 Active 52 DOM
-
2026-06-07days on market $375,000 Active 51 DOM
-
2026-06-05days on market $375,000 Active 48 DOM
-
2026-06-02days on market $375,000 Active 46 DOM
-
2026-06-01days on market $375,000 Active 45 DOM
-
2026-05-31days on market $375,000 Active 44 DOM
-
2026-05-30days on market $375,000 Active 43 DOM
-
2026-04-17$375,000 Active 1060-char remark
Show marketing remark (989 chars)
Turnkey investment opportunity in the heart of downtown Otsego! This 5-unit mixed-use building offers strong, consistent cash flow with a current gross income of $4,030/month and an impressively low expense ratio. A major bonus for investors--city-owned parking means reduced maintenance responsibilities and costs, as the municipality handles parking areas and sidewalks. The property features a versatile unit mix, including two approximately 950 sq ft main-floor commercial suites with excellent street presence, plus three residential units: a well-appointed 1-bedroom/1-bath apartment, a spacious 2-bedroom/1-bath unit, and a studio apartment. All units have seen significant updates, providing a clean, modern feel that attracts and retains quality tenants. Whether you're looking to expand your portfolio or secure a stable, income-producing asset, this property checks all the boxes. Fully occupied, professionally positioned, and truly turnkey--this is a rare opportunity to own a
-
2026-04-17$375,000 Active 989-char remark
Show marketing remark (989 chars)
Turnkey investment opportunity in the heart of downtown Otsego! This 5-unit mixed-use building offers strong, consistent cash flow with a current gross income of $4,030/month and an impressively low expense ratio. A major bonus for investors--city-owned parking means reduced maintenance responsibilities and costs, as the municipality handles parking areas and sidewalks. The property features a versatile unit mix, including two approximately 950 sq ft main-floor commercial suites with excellent street presence, plus three residential units: a well-appointed 1-bedroom/1-bath apartment, a spacious 2-bedroom/1-bath unit, and a studio apartment. All units have seen significant updates, providing a clean, modern feel that attracts and retains quality tenants. Whether you're looking to expand your portfolio or secure a stable, income-producing asset, this property checks all the boxes. Fully occupied, professionally positioned, and truly turnkey--this is a rare opportunity to own a
-
2025-09-30historical
-
2025-09-30status Active
-
2025-09-29price $475,000
-
2025-08-19historical
-
2025-08-19status Active
-
2025-06-17historical
-
2025-06-17status Active
-
2025-06-16price $560,000
-
2025-06-14historical
-
2025-06-14status Active
-
2025-06-04historical
-
2025-06-04status Active
-
2025-06-03historical
-
2025-06-03status Active
-
2025-05-31historical
-
2025-05-29$585,000 Active
-
2022-05-06historical
-
2022-02-23$345,000
-
2020-05-31historical
-
2020-01-13$279,000
-
2014-09-25historical
-
2007-05-07$134,900
ⓘ Source: listings_history table (triggers on properties + properties_extension) + one-shot
backfill from property_details.listing_events for pre-trigger history.
Climate risk First Street
- Flood 1/10 Low FEMA zone X · 0% chance over 30 yrs
- Wildfire 1/10 Low
- Heat 3/10 Moderate
- Air quality 2/10 Low 1 unhealthy d/yr today · 1 by 30 yrs out
Nearby sold comps map
Loading sold comps map…
Walkable amenities ~0.75 mi
Loading nearby amenities…
Taxation est. · year 1
- Rental income
- $64,560
- − Mortgage interest
- −$21,006
- − Property taxes
- −$5,625
- − Insurance
- −$1,875
- − Repairs & maintenance
- −$5,165
- − Management
- −$5,165
- − Depreciation
- −$10,909
- Taxable income
- $14,815
- Est. tax owed @ 24.0%
- −$3,556
- After-tax cash flow
- $16,348/yr
For passive investors: Depreciation is non-cash, so a rental often shows a tax loss while cash-flowing — sheltering income. Rental losses are passive: they offset passive income freely, and up to $25,000/yr can offset ordinary (W-2) income if you actively participate and your MAGI is under $100k (phasing out to $0 by $150k); unused losses carry forward. On sale, claimed depreciation is recaptured at up to 25%, and gains may owe capital-gains tax (a 1031 exchange can defer both). Figures are a year-1 estimate at your 24.0% rate — not tax advice; consult a CPA.
Schools (NCES district)
- District
- Otsego Public Schools
- NCES district ID
- 2627060
- Math proficiency
- 39% ▼ -13.00%
- Reading proficiency
- 57% ▼ -10.00%
- Median HH income
- $52,776
- Composite
- 41.32/100
- National rank
- #3507
- State rank
- #118 of 540 in MI
Livability — Otsego
- Score
- 73/100
- State rank
- #216
- US rank
- #5349
Category grades
Schools grade is shown separately in the Schools card above.
Census & demographics
- Census place
- Otsego, MI
- Population (ZIP)
- 10,469
Population outlook (Allegan County) Hauer SSP2
- Today (2025)
- 120,251 people
- By 2030
- 122,204 · +1.6%
- By 2040
- 123,979 · +3.1%
- By 2050
- 122,340 · +1.7%
- By 2075
- 116,088 · -3.5%
- By 2100
- 98,461 · -18.1%
Race, ethnicity, and origin ACS 2023
- Neighborhood character
- Predominantly White (86%)
- Race & ethnicity
- White 86% Two or more races 6% Hispanic / Latino 4%
- Common ancestry
- Iranian 9% Italian 4% Romanian 4%
- Foreign-born
- 4% · Canada
- Languages at home
- 92% English-only · Spanish 4% Other Indo-European 4%
Political lean MEDSL · Allegan
- 2024 margin
- Strong R (+27.2) · D 35.7% · R 62.9% · Other 1.5%
- 2008→2024 swing
- -16.5pp toward R · 2008: -10.7pp · 2024: -27.2pp
- All cycles
- 2024: R+27.2 2020: R+25.2 2016: R+28.8 2012: R+19.2 2008: R+10.7
Not yet ingested
- Civics
- —
Market trends
- HPI YoY
- ▼ -119.20%
- Current HPI
- 245.4119
- Rent YoY
- —
- Metro
- —
- State GDP YoY
- ▲ 1.37%
- F500 in state
- 28
Industry mix (Fortune 500 HQ in MI)
| Industry | F500 HQs | Revenue |
|---|---|---|
| Automotive Parts | 3 | $48B |
|
||
| Automotive | 2 | $372B |
|
||
| Chemicals | 1 | $45B |
|
||
| Automotive Retail | 1 | $29B |
|
||
| Healthcare / Medical Devices | 1 | $23B |
|
||
| Automotive Technology | 1 | $20B |
|
||
Price history
+178.0% since first listed24 events — show timeline
- 2026-04-17 Listed $375,000 MiRealSource-MiMLS
- 2026-04-17 Listed $375,000 REALCOMP
- 2025-09-30 Listing Removed — MiRealSource-MiMLS
- 2025-09-30 Relisted — MiRealSource-MiMLS
- 2025-09-29 Price Changed $475,000 MiRealSource-MiMLS
- 2025-08-19 Listing Removed — MiRealSource-MiMLS
- 2025-08-19 Relisted — MiRealSource-MiMLS
- 2025-06-17 Listing Removed — MiRealSource-MiMLS
- 2025-06-17 Relisted — MiRealSource-MiMLS
- 2025-06-16 Price Changed $560,000 MiRealSource-MiMLS
- 2025-06-14 Listing Removed — MiRealSource-MiMLS
- 2025-06-14 Relisted — MiRealSource-MiMLS
- 2025-06-04 Listing Removed — MiRealSource-MiMLS
- 2025-06-04 Relisted — MiRealSource-MiMLS
- 2025-06-03 Listing Removed — MiRealSource-MiMLS
- 2025-06-03 Relisted — MiRealSource-MiMLS
- 2025-05-31 Listing Removed — MiRealSource-MiMLS
- 2025-05-29 Listed $585,000 MiRealSource-MiMLS
- 2022-05-06 Listing Removed — MiRealSource-MiMLS
- 2022-02-23 Listed $345,000 MiRealSource-MiMLS
- 2020-05-31 Listing Removed — MiRealSource-MiMLS
- 2020-01-13 Listed $279,000 MiRealSource-MiMLS
- 2014-09-25 Listing Removed — SW Michigan MLS
- 2007-05-07 Listed $134,900 SW Michigan MLS
Cash-flow waterfall
monthlySold comps — $/sqft
last 12 mo · ≤1 miLoading sold comps…