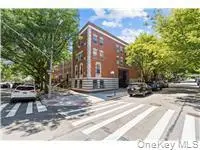
300 W 137th St Unit 300D · New York, NY
Flood risk 4/10 · Minor
- FEMA flood zone
- X (unshaded)
- Chance of flooding over 30 yrs
- 0.13%
- Est. flood insurance / yr
- $507 – $1,088
Fire risk 1/10 · Minimal
- Est. fire insurance / yr
- $691 – $1,283
Heat risk 6/10 · Moderate
- Hot days now (above 99°F)
- 7 days/yr
- Hot days in 30 yrs
- 15 days/yr
Wind risk 6/10 · Moderate
- Chance of severe wind over 30 yrs
- 27.0%
Air-quality risk 4/10 · Minor
- Unhealthy air days now
- 5 days/yr
- Unhealthy air days in 30 yrs
- 6 days/yr
Risk factors via First Street. Map © Google.
Why this score? — see what drove the C- grade
The composite is a weighted blend of 9 inputs, each scored 0–100. Each bar is that input's sub-score; the figure is the points it added to the 100-point composite (weight × sub-score).
- Cash flow +12.9/30.0
- Appreciation +9.0/10.0
- ARV discount +7.5/15.0
- Schools +5.0/10.0
- Rent growth +4.7/5.0
- DSCR +3.9/10.0
- Livability +3.8/5.0
- 1% rule +3.5/10.0
- Condition / age +2.5/5.0
$800,000
🖨 Deal sheet 📄 Offer letter ✓ Due diligence
Listing remarks
Updated three-bedroom duplex in the heart of Harlem, featuring bamboo wood floors and a spacious open-concept layout perfect for both everyday living and effortless entertaining. The home offers a bright, sun-drenched living room, a dedicated dining area, and generous living space throughout. Recently painted and thoughtfully upgraded, the home features a ceramic-tiled bathroom with stainless-steel faucets and sleek frosted LED lighting for a modern touch. Set within a beautiful brick building with classic wrought iron steps, this residence seamlessly blends modern updates with timeless Harlem charm, all in a vibrant and highly convenient location.
Key facts
- Bamboo wood floors
- Frosted led lighting
- Open-concept layout
Tags
Property features AI
Exterior
- Parking: No carport; Parking: waitlist
- Utilities: Sewer: none; Utilities: see remarks
- Home design: Townhouse condominium; Entry level: 2; Two-story
- Construction: Brick construction
- Exterior features: Brick construction; Not waterfront
Interior
- Kitchen: Gas Oven
- Bedrooms: Pets allowed
- Bathrooms: 2 full bathrooms
- Heating & cooling: Baseboard heating; Other heating
- Interior features: Other interior features; Attic: see remarks; 8 total rooms; Two stories
Neighborhood map
What this means for you Summary
Snapshot
- This is a 3-bed/2.0-bath condo listed at $800k.
Deal economics
- At list price, monthly cash flow is $-56 ($-666/yr) — negative.
- To cash-flow at today's rent, offer at most $790k (1.2% below list).
- To meet the 1% rule (rent ≥ 1% of price), the offer needs to be $677k (15.3% below list).
- Recommended offer: $677k (15.3% below list) — sets the bar for 1% rule.
- Cap rate 6.2% vs local median 2.6% in New York — top-decile yield for the area; either an underpriced asset or a hidden risk that comps aren't pricing in. Stress-test before assuming the spread holds.
Location & tenants
- Location reads 75/100 on livability (#268 in NY, #4,188 nationally) — a middle-class / working-renter tenant base. Strengths: amenities A+, commute A+, health & safety A; Watch: crime F, cost of living F.
- Market conditions: Rents rising fast (+8.8%/yr); 72 active listings in the ZIP; 12 comparable units currently listed for rent nearby; rentals at typical pace (median 18d on market — plan ~3-4 weeks tenant-placement turnaround); lower-income renter base — watch delinquency; 4,467 units permitted in New York County in 2024 (4,463 in 5+ unit buildings).
- At $6,774/mo this rent would consume 204% of the median local household income ($40k/yr) (locally 4110% of renters already pay >50% of income on rent) — very limited rent-growth headroom before tenants either downsize or default.
Forward outlook
- In year one you build about $70k of equity ($6k loan paydown + $64k appreciation (8.1% local appreciation)).
- New York County population projected at +21% by 2050 — long-run rental-demand tailwind backs the buy-and-hold thesis.
- At projected returns (8.1% appreciation + 8.0% rent growth), your $224k cash investment doubles in ~3 years — after that, you're playing with house money.
- By year 2, paydown + projected appreciation supports a ~$112k cash-out refi (75% LTV) — recoverable capital for the next deal without selling this one.
Negotiation context
- It's been on market 21 days — a 2% lower offer ($788k) is reasonable based on typical stale-listing flexibility.
- Current owner paid $169k; list at $800k implies a 373% gain — meaningful room to come down on a strong offer.
Risks & watch-outs
- Climate carrying-cost: major wind risk, 27% chance of damaging wind over 30y; extreme-heat days projected 7→15/yr by 2055 (HVAC capex compounding) — expect insurance premiums to compound above CPI over the hold.
Questions for the listing agent
- What do current leases actually rent for vs. the listed asking? Can we see a recent rent roll and the last 12 months of T-12 income?
- Any open or pending special assessments — roof, HVAC, plumbing, elevator, façade? What's the per-unit balance and payoff schedule, and is the seller paying it off at close or rolling it to the buyer?
- Is there a deadline driving the sale (1031 exchange, divorce, estate, relocation)? That informs how much negotiation room exists.
- Schools are B-rated — typically a magnet for longer-tenancy family renters. What's the average tenant stay here, and is there a school-zone premium baked into asking?
- Crime grade is F in this area — have there been break-ins, vandalism, or insurance claims at this property in the last 3 years? What carrier currently insures it and at what premium?
- What's the average days-on-market for RENTAL listings here right now (not sales)? A rising rental-DOM trend means longer vacancies and softer asking-rent achievability than the comps imply.
- What's the recent tenant-quality profile in this submarket — average credit score on applications, eviction rate, late-payment / NSF rate, and stable-employment percentage? A property-management company in the area should have these aggregated.
- How much new apartment / multifamily construction is in the pipeline within 1–3 miles? Heavy new supply (>2% of stock underway) typically softens rents 12–24 months out; light construction supports rent growth.
Investment metrics
- 1% rule
- 0.85% ✗
- Cap rate
- 6.21%
- Cash-on-cash
- -0.30%
- DSCR
- 0.99
- GRM
- 9.8
CMA / ARV
No comps found within radius.
Projected returns pro-forma
8.05% appreciation · 8.0% rent growth · sell at horizon
- IRR
- 21.7%
- Equity multiple
- 2.63×
- Total profit
- $364,225
- Equity at exit
- $610,312
- IRR
- 21.5%
- Equity multiple
- 6.13×
- Total profit
- $1,149,770
- Equity at exit
- $1,213,885
Cash invested: $224,000 (down + closing). Projections, not guarantees.
Landlord ↔ Tenant lean methodology
- Overall (CITY)
- 0 Strongly Tenant-Friendly
- State New York
- 15 Strongly Tenant-Friendly · D+10
- County
- — inherits STATE
- City New York
- 0 Strongly Tenant-Friendly · D+34
ZIP-level market 10030
- Home prices YoY
- 2.3%
- Rents YoY
- 8.8%
- Active inventory
- 72
- Price-to-rent
- 9.8×
Monthly cashflow live
- Estimated rent
- $6,774 high interval (Pro) →
- Mortgage (P&I)
- −$4,195
- Tax from tax record
- −$879 /mo · $10,544/yr
- Insurance
- −$333
- HOA
- −$0
- Vacancy / Maint / Mgmt
- −$1,423
- Net cashflow
- $-56
Break-even live
UW: 25.0% down · 7.5% · 30yr · 1.5% tax · 5.0% vac · 8.0% maint · 8.0% mgmt
Financing live
Cash to close
- Down payment
- $200,000
- Closing costs
- $24,000
- Reserves months
- —
- Total cash needed
- —
Loan-product check · same deal, 3 products live
Conventional
25% down · 7.5% · 30yr
- Down + closing
- —
- Monthly P&I
- —
- Monthly cashflow
- —
- DSCR
- —
- Eligible?
- —
Personal DTI + credit; lowest rate.
DSCR
20% down · 8.5% · 30yr
- Down + closing
- —
- Monthly P&I
- —
- Monthly cashflow
- —
- DSCR
- —
- Eligible?
- —
No personal income docs; deal must DSCR.
Hard money
10% down · 12.0% · 12mo
- Down + closing
- —
- Monthly P&I
- —
- Monthly cashflow
- —
- DSCR
- —
- Eligible?
- —
Short-term bridge; refi at stabilization.
Rent comps 12 comps
| Address | Beds | Baths | Sqft | Rent | $/sqft | DOM | Units | Dist |
|---|---|---|---|---|---|---|---|---|
| 52 Convent Ave Unit 30 New York, NY | 3.0 | 2.0 | 1300 | $7,500 | $5.77 | 24d | 1 | 0.43mi |
| 114 W 131st St Apt 2 New York, NY | 3.0 | 2.0 | 2000 | $6,750 | $3.38 | 24d | 1 | 0.44mi |
| 114 W 131st St Apt 2 New York, NY | 3.0 | 2.0 | 2000 | $6,150 | $3.08 | 17d | 1 | 0.44mi |
| 12 W 127th St Unit 1 New York, NY | 3.0 | 3.5 | 1899 | $8,999 | $4.74 | 24d | 1 | 0.73mi |
| 543 W 122nd St Unit 27C New York, NY | 2.0 | 2.0 | 1313 | $10,995 | $8.37 | 10d | 1 | 0.85mi |
| 543 W 122nd St New York, NY | 2.0 | 1.0–2.0 | 1057 | $10,995 | $10.40 | 2d | 7 | 0.85mi |
| 2413 3rd Ave Bronx, NY | 1.0–3.0 | 1.0–2.0 | 857 | $4,997 | $5.83 | 11d | 23 | 0.99mi |
| 5 Lincoln Ave Bronx, NY | 1.0–3.0 | 1.0–2.5 | 1011 | $7,411 | $7.33 | 2d | 183 | 1.09mi |
| 61 Malcolm X Blvd New York, NY | 2.0 | 2.0 | 1300 | $4,795 | $3.69 | 24d | 1 | 1.25mi |
| 120 E 116th St Unit 3R New York, NY | 4.0 | 2.0 | 1100 | $4,995 | $4.54 | 7d | 1 | 1.35mi |
| 1 Morningside Dr New York, NY | 3.0 | 1.0–2.0 | 1655 | $9,980 | $6.03 | 1d | 1 | 1.35mi |
| 545 W 110th St Unit 6A New York, NY | 2.0 | 2.0 | 1441 | $7,500 | $5.20 | 24d | 1 | 1.42mi |
HOA detail condo
- Monthly dues
- $0 · $0/yr
- Assessments
- None detected in remarks — confirm with the listing agent.
Listing history 13 events
-
2026-06-18days on market $800,000 Active 21 DOM
-
2026-06-17days on market $800,000 Active 20 DOM
-
2026-06-16days on market $800,000 Active 19 DOM
-
2026-06-15days on market $800,000 Active 18 DOM
-
2026-06-13days on market $800,000 Active 16 DOM
-
2026-06-10days on market $800,000 Active 12 DOM
-
2026-06-08days on market $800,000 Active 11 DOM
-
2026-06-08days on market $800,000 Active 10 DOM
-
2026-06-04days on market $800,000 Active 7 DOM
-
2026-06-03days on market $800,000 Active 6 DOM
-
2026-06-02days on market $800,000 Active 5 DOM
-
2026-06-01days on market $800,000 Active 4 DOM
-
2026-05-31days on market $800,000 Active 3 DOM
ⓘ Source: listings_history table (triggers on properties + properties_extension) + one-shot
backfill from property_details.listing_events for pre-trigger history.
Tax reassessment forecast NY · Partial reset (capped growth)
- Current annual tax
- $10,544 · $879/mo
- Projected year-2 tax
- $12,032 · $1,003/mo
- Expected delta
- +$1,488/yr (+$124/mo · 14.1%)
ⓘ Screening estimate from a state-policy table — verify with the county assessor before closing.
Climate risk First Street
- Flood 4/10 Moderate FEMA zone X (unshaded) · 13% chance over 30 yrs
- Wildfire 1/10 Low
- Heat 6/10 Major 7 d/yr ≥99°F today · 15 d/yr by 30 yrs out
- Wind 6/10 Major 27% chance of damaging wind over 30 yrs
- Air quality 4/10 Moderate 5 unhealthy d/yr today · 6 by 30 yrs out
Nearby sold comps map
Loading sold comps map…
Walkable amenities ~0.75 mi
Loading nearby amenities…
Taxation est. · year 1
- Rental income
- $81,292
- − Mortgage interest
- −$44,812
- − Property taxes
- −$10,544
- − Insurance
- −$4,000
- − Repairs & maintenance
- −$6,503
- − Management
- −$6,503
- − Depreciation
- −$23,273
- Taxable loss
- −$14,344
- Est. tax savings @ 24.0%
- +$3,442
- After-tax cash flow
- $2,776/yr
For passive investors: Depreciation is non-cash, so a rental often shows a tax loss while cash-flowing — sheltering income. Rental losses are passive: they offset passive income freely, and up to $25,000/yr can offset ordinary (W-2) income if you actively participate and your MAGI is under $100k (phasing out to $0 by $150k); unused losses carry forward. On sale, claimed depreciation is recaptured at up to 25%, and gains may owe capital-gains tax (a 1031 exchange can defer both). Figures are a year-1 estimate at your 24.0% rate — not tax advice; consult a CPA.
Schools (NCES district)
No district data.
Livability — New York
- Score
- 75/100
- State rank
- #268
- US rank
- #4188
Category grades
Schools grade is shown separately in the Schools card above.
Census & demographics
- Census place
- New York, NY
- County
- New York County · 1,599,927 people
- City population
- 7,731,280
- Metro
- New York-Newark-Jersey City, NY-NJ-PA
- Population (ZIP)
- 29,297
- Household income
- $39,802
- Rent vs Own
- Severe rent burden
- 4110.0
Population outlook (New York County) Hauer SSP2
- Today (2025)
- 1,825,725 people
- By 2030
- 1,904,611 · +4.3%
- By 2040
- 2,052,719 · +12.4%
- By 2050
- 2,206,601 · +20.9%
- By 2075
- 2,509,427 · +37.4%
- By 2100
- 2,702,933 · +48.0%
Race, ethnicity, and origin ACS 2023
- Neighborhood character
- Diverse neighborhood (Simpson 0.62)
- Race & ethnicity
- Black 54% Hispanic / Latino 27% White 9% Two or more races 8% Asian 5%
- Hispanic origin (detail)
- Mexican 4% Puerto Rican 6% Dominican 11%
- Common ancestry
- Hispanic 1% Scotch-Irish 1% Romanian 1%
- Foreign-born
- 27% · Canada, China, South Korea
- Languages at home
- 63% English-only · Spanish 21% French/Haitian/Cajun 5% Chinese 2%
Political lean MEDSL · New York
- 2024 margin
- Solid D (+64.8) · D 82.4% · R 17.6%
- 2008→2024 swing
- -7.4pp toward R · 2008: 72.2pp · 2024: 64.8pp
- All cycles
- 2024: D+64.8 2020: D+74.5 2016: D+77.2 2012: D+69.6 2008: D+72.2
Not yet ingested
- Civics
- —
Market trends
- HPI YoY
- ▲ 8.05%
- Current HPI
- 354.2971
- Rent YoY
- ▲ 8.84%
- Metro
- New York-Newark-Jersey City, NY-NJ-PA
- State GDP YoY
- ▲ 2.60%
- F500 in state
- 92
Industry mix (Fortune 500 HQ in NY)
| Industry | F500 HQs | Revenue |
|---|---|---|
| Financial Services | 10 | $950B |
|
||
| Consumer Goods | 9 | $162B |
|
||
| Insurance | 4 | $225B |
|
||
| Telecommunications | 2 | $144B |
|
||
| Pharmaceuticals | 2 | $112B |
|
||
| Media / Entertainment | 2 | $69B |
|
||
Price history
+373.4% since first listed2 events — show timeline
- 2026-05-27 Listed $800,000 OneKey® MLS as Distributed by MLS Grid
- 1995-04-11 Sold (Public Records) $169,000 Public Records
Property tax history
+12.7%/yrLatest (2025): $10,544 · +1.8% YoY. Source: county tax records.
Cash-flow waterfall
monthlySold comps — $/sqft
last 12 mo · ≤1 miLoading sold comps…