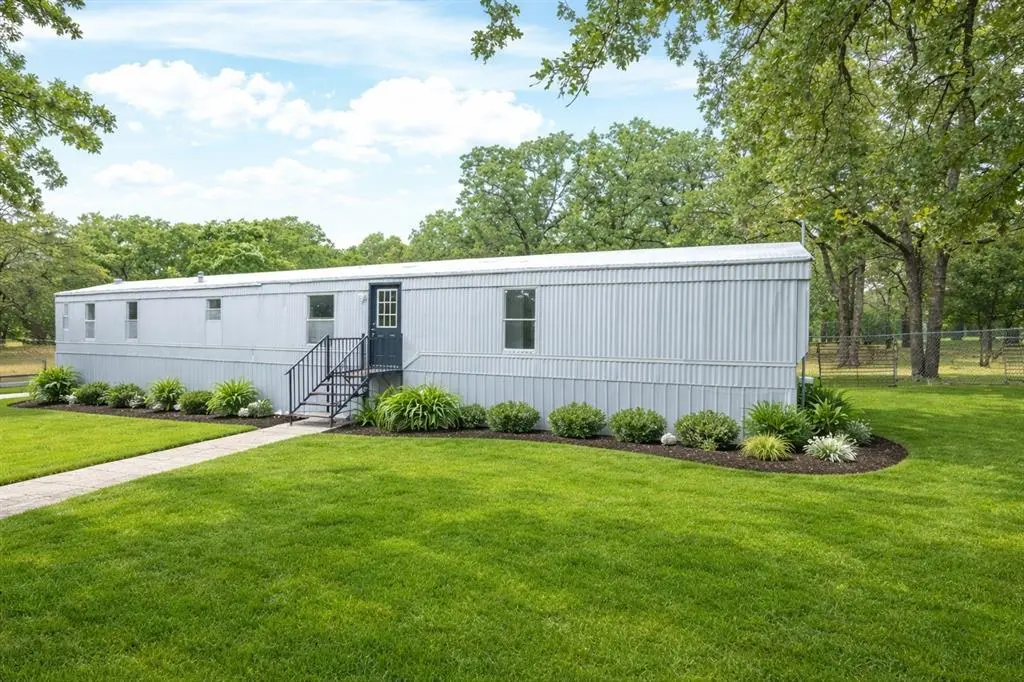
146 Deerwood Ln · Reno, TX
Flood risk 1/10 · Minimal
- FEMA flood zone
- X (unshaded)
- Chance of flooding over 30 yrs
- 0.0%
- Est. flood insurance / yr
- $507 – $1,088
Fire risk 7/10 · Major
- Est. fire insurance / yr
- $1,222 – $2,270
Heat risk 7/10 · Major
- Hot days now (above 109°F)
- 6 days/yr
- Hot days in 30 yrs
- 19 days/yr
Wind risk 4/10 · Minor
- Chance of severe wind over 30 yrs
- 24.0%
Air-quality risk 2/10 · Minimal
- Unhealthy air days now
- 1 days/yr
- Unhealthy air days in 30 yrs
- 1 days/yr
Risk factors via First Street. Map © Google.
Why this score? — see what drove the C grade
The composite is a weighted blend of 9 inputs, each scored 0–100. Each bar is that input's sub-score; the figure is the points it added to the 100-point composite (weight × sub-score).
- Cash flow +19.7/30.0
- ARV discount +15.0/15.0
- DSCR +6.2/10.0
- 1% rule +4.1/10.0
- Schools +3.3/10.0
- Livability +3.0/5.0
- Rent growth +2.5/5.0
- Condition / age +2.5/5.0
- Appreciation +0.0/10.0
$210,000
🖨 Deal sheet (PDF) 📄 Offer letter ✓ Due diligence
Listing remarks MLS
Beautiful single-wide mobile home, recently remodeled, featuring an open-concept layout. Several new air ducts have been installed, and the HVAC system has been professionally cleaned. Situated on unrestricted land (buyer or buyer's Agent to verify), offering flexibility for future use. This move-in ready property is waiting for you. Start the new year in a new home call your realtor today for a private tour
Key facts
- New air ducts
- Hvac system cleaned
- Unrestricted land
Tags
Neighborhood map
What this means for you Summary
Snapshot
- This is a 3-bed/2.0-bath single-family listed at $210k.
Deal economics
- At list price, monthly cash flow is $246 ($3k/yr) — positive.
- The deal already cash-flows at list — no discount required.
- To meet the 1% rule (rent ≥ 1% of price), the offer needs to be $191k (8.9% below list).
- Recommended offer: $185k (12.0% below list) — sets the bar for market timing.
- Cap rate 7.7% vs local median 2.0% in Reno — top-decile yield for the area; either an underpriced asset or a hidden risk that comps aren't pricing in. Stress-test before assuming the spread holds.
Location & tenants
- Location reads 59/100 on livability (#1,131 in TX) — a working-class tenant base; expect higher turnover. Strengths: cost of living A+, housing A+, crime A; Watch: employment D+, schools D-, amenities F.
- Springtown ISD (town): math 36% / reading 40% proficiency, ranked #435 of 826 in TX (top 53%) — families likely to look elsewhere, expect single-tenant / working-renter base with shorter leases.
- Market conditions: 519 active listings in the ZIP; solid renter incomes; 437 units permitted in Parker County in 2024 (0 in 5+ unit buildings).
Forward outlook
- Local home prices are declining (-3.0%/yr); year-one equity from $1k of loan paydown is wiped out by about $6k of value loss. Plan a longer hold.
- Parker County population projected at +32% by 2050 — long-run rental-demand tailwind backs the buy-and-hold thesis.
Negotiation context
- It's been on market 171 days — a 12% lower offer ($185k) is reasonable based on typical stale-listing flexibility.
- 4 sale attempts with the ask held roughly flat each time — persistent listings suggest the price (not the market) is what's stuck; bring a comps-based counter.
Risks & watch-outs
- Climate carrying-cost: major wildfire risk; extreme-heat days projected 6→19/yr by 2055 (HVAC capex compounding) — expect insurance premiums to compound above CPI over the hold.
Questions for the listing agent
- It's been on market 171 days. Have you received any prior offers? Is the seller open to a 12% concession, seller financing, or rate buy-down credit?
- Why hasn't it sold? Are there any deal-killer items the seller is aware of (foundation, flood, title, zoning, code violations)?
- Is there a deadline driving the sale (1031 exchange, divorce, estate, relocation)? That informs how much negotiation room exists.
- Schools are D-rated, which usually means shorter tenancies and higher turnover. Who's the typical renter profile here, and what's been the actual vacancy rate?
- What's the average days-on-market for RENTAL listings here right now (not sales)? A rising rental-DOM trend means longer vacancies and softer asking-rent achievability than the comps imply.
- What's the recent tenant-quality profile in this submarket — average credit score on applications, eviction rate, late-payment / NSF rate, and stable-employment percentage? A property-management company in the area should have these aggregated.
- How much new for-sale + rental construction is in the pipeline within 1–3 miles? Heavy new supply typically softens prices + rents 12–24 months out; constrained supply supports both.
Investment metrics
- 1% rule
- 0.91% ✗
- Cap rate
- 7.70%
- Cash-on-cash
- 5.01%
- DSCR
- 1.22
- GRM
- 9.1
CMA / ARV
- ARV (median comp)
- $257,806
- List price
- $210,000
- Delta
- -18.54%
- Verdict
- UNDERPRICED
- Comps
- 7 within 1.0 mi
Projected returns pro-forma
-3.0% appreciation · 3.0% rent growth · sell at horizon
- IRR
- -8.6%
- Equity multiple
- 0.69×
- Total profit
- $-18,474
- Equity at exit
- $31,312
- IRR
- 0.9%
- Equity multiple
- 1.06×
- Total profit
- $3,707
- Equity at exit
- $18,157
Cash invested: $58,800 (down + closing). Projections, not guarantees.
Landlord ↔ Tenant lean methodology
- Overall (STATE)
- 87 Strongly Landlord-Friendly
- State Texas
- 87 Strongly Landlord-Friendly · R+5
- County
- — inherits STATE
- City
- — inherits STATE
ZIP-level market 76082
- Home prices YoY
- -21.5%
- Active inventory
- 519
- Price-to-rent
- 9.1×
Monthly cashflow live
- Estimated rent
- $1,914 medium interval (Pro) →
- Mortgage (P&I)
- −$1,101
- Tax from tax record
- −$78 /mo · $932/yr
- Insurance
- −$88
- HOA
- −$0
- Vacancy / Maint / Mgmt
- −$402
- Net cashflow
- $246
Break-even live
Sensitivity live
| Price | -10% $364 | -5% $305 | +0% $246 | +5% $186 | +10% $127 |
|---|---|---|---|---|---|
| Rent | -10% $94 | -5% $170 | +0% $246 | +5% $321 | +10% $397 |
| Rate | -1.0pp $351 | -0.5pp $299 | base $246 | +0.5pp $191 | +1.0pp $136 |
UW: 25.0% down · 7.5% · 30yr · 1.5% tax · 5.0% vac · 8.0% maint · 8.0% mgmt
Financing live
Cash to close
- Down payment
- $52,500
- Closing costs
- $6,300
- Reserves months
- —
- Total cash needed
- —
Loan-product check · same deal, 3 products live
Conventional
25% down · 7.5% · 30yr
- Down + closing
- —
- Monthly P&I
- —
- Monthly cashflow
- —
- DSCR
- —
- Eligible?
- —
Personal DTI + credit; lowest rate.
DSCR
20% down · 8.5% · 30yr
- Down + closing
- —
- Monthly P&I
- —
- Monthly cashflow
- —
- DSCR
- —
- Eligible?
- —
No personal income docs; deal must DSCR.
Hard money
10% down · 12.0% · 12mo
- Down + closing
- —
- Monthly P&I
- —
- Monthly cashflow
- —
- DSCR
- —
- Eligible?
- —
Short-term bridge; refi at stabilization.
Listing history 32 events
-
2026-06-18days on market $210,000 Active 171 DOM
-
2026-06-17days on market $210,000 Active 170 DOM
-
2026-06-16days on market $210,000 Active 169 DOM
-
2026-06-15days on market $210,000 Active 168 DOM
-
2026-06-13days on market $210,000 Active 166 DOM
-
2026-06-13days on market $210,000 Active 165 DOM
-
2026-06-09days on market $210,000 Active 162 DOM
-
2026-06-08days on market $210,000 Active 161 DOM
-
2026-06-07days on market $210,000 Active 160 DOM
-
2026-06-04days on market $210,000 Active 157 DOM
-
2026-06-03days on market $210,000 Active 156 DOM
-
2026-06-02days on market $210,000 Active 155 DOM
-
2026-06-01days on market $210,000 Active 154 DOM
-
2026-05-31days on market $210,000 Active 153 DOM
-
2025-12-29$210,000 Active 413-char remark
Show marketing remark (413 chars)
Beautiful single-wide mobile home, recently remodeled, featuring an open-concept layout. Several new air ducts have been installed, and the HVAC system has been professionally cleaned. Situated on unrestricted land (buyer or buyer's Agent to verify), offering flexibility for future use. This move-in ready property is waiting for you. Start the new year in a new home call your realtor today for a private tour
-
2025-12-20historical $1,500
-
2025-10-18$1,500
-
2025-09-23historical
-
2025-06-21price $190,000
-
2025-06-12$210,000 Active
-
2025-03-05soldstatus
-
2025-03-04soldstatus Closed
-
2025-02-15status Pending
-
2025-02-08historical Active Option Contract
-
2025-02-03$89,900 Active
-
2013-11-19soldstatus
-
2007-04-26soldstatus
-
2007-03-02soldstatus
-
2006-10-20soldstatus
-
2006-02-03soldstatus
-
2001-05-16soldstatus
-
2001-02-01soldstatus
ⓘ Source: listings_history table (triggers on properties + properties_extension) + one-shot
backfill from property_details.listing_events for pre-trigger history.
Tax reassessment forecast TX · Resets to sale price
- Current annual tax
- $932 · $78/mo
- Projected year-2 tax
- $3,843 · $320/mo
- Expected delta
- +$2,911/yr (+$243/mo · 312.5%)
ⓘ Screening estimate from a state-policy table — verify with the county assessor before closing.
Climate risk First Street
- Flood 1/10 Low FEMA zone X (unshaded) · 0% chance over 30 yrs
- Wildfire 7/10 Severe
- Heat 7/10 Severe 6 d/yr ≥109°F today · 19 d/yr by 30 yrs out
- Wind 4/10 Moderate 24% chance of damaging wind over 30 yrs
- Air quality 2/10 Low 1 unhealthy d/yr today · 1 by 30 yrs out
Nearby sold comps map
Loading sold comps map…
Walkable amenities ~0.75 mi
Loading nearby amenities…
Taxation est. · year 1
- Rental income
- $22,966
- − Mortgage interest
- −$11,763
- − Property taxes
- −$932
- − Insurance
- −$1,050
- − Repairs & maintenance
- −$1,837
- − Management
- −$1,837
- − Depreciation
- −$6,109
- Taxable loss
- −$562
- Est. tax savings @ 24.0%
- +$135
- After-tax cash flow
- $3,082/yr
For passive investors: Depreciation is non-cash, so a rental often shows a tax loss while cash-flowing — sheltering income. Rental losses are passive: they offset passive income freely, and up to $25,000/yr can offset ordinary (W-2) income if you actively participate and your MAGI is under $100k (phasing out to $0 by $150k); unused losses carry forward. On sale, claimed depreciation is recaptured at up to 25%, and gains may owe capital-gains tax (a 1031 exchange can defer both). Figures are a year-1 estimate at your 24.0% rate — not tax advice; consult a CPA.
Schools (NCES district)
- District
- Springtown ISD
- NCES district ID
- 4841280
- Math proficiency
- 36% ▼ -14.00%
- Reading proficiency
- 40% ▼ -2.00%
- Median HH income
- $56,136
- Composite
- 33.41/100
- National rank
- #5474
- State rank
- #435 of 826 in TX
Livability — Reno
- Score
- 59/100
- State rank
- #1131
- US rank
- #20008
Category grades
Schools grade is shown separately in the Schools card above.
Census & demographics
- County
- Parker County · 144,797 people
- Metro
- Dallas-Fort Worth-Arlington, TX
- Population (ZIP)
- 24,880
- Household income
- $92,485
- Rent vs Own
- Severe rent burden
- 333.0
Population outlook (Parker County) Hauer SSP2
- Today (2025)
- 147,426 people
- By 2030
- 157,863 · +7.1%
- By 2040
- 177,519 · +20.4%
- By 2050
- 194,786 · +32.1%
- By 2075
- 238,799 · +62.0%
- By 2100
- 264,126 · +79.2%
Race, ethnicity, and origin ACS 2023
- Neighborhood character
- Predominantly White (80%)
- Race & ethnicity
- White 80% Hispanic / Latino 13% Two or more races 11%
- Hispanic origin (detail)
- Mexican 12%
- Common ancestry
- Slovak 3% Lithuanian 2% Italian 2%
- Foreign-born
- 4% · Canada
- Languages at home
- 93% English-only · Spanish 6%
Political lean MEDSL · Parker
- 2024 margin
- Solid R (+66.4) · D 16.4% · R 82.8%
- 2008→2024 swing
- -11.2pp toward R · 2008: -55.2pp · 2024: -66.4pp
- All cycles
- 2024: R+66.4 2020: R+64.4 2016: R+67.5 2012: R+65.8 2008: R+55.2
Not yet ingested
- Civics
- —
Market trends
- HPI YoY
- ▼ -71.65%
- Current HPI
- 262.1991
- Rent YoY
- —
- Metro
- Dallas-Fort Worth-Arlington, TX
- State GDP YoY
- ▲ 3.95%
- F500 in state
- 110
Industry mix (Fortune 500 HQ in TX)
| Industry | F500 HQs | Revenue |
|---|---|---|
| Energy | 16 | $1,198B |
|
||
| Technology | 5 | $198B |
|
||
| Engineering / Construction | 4 | $72B |
|
||
| Energy Services | 3 | $60B |
|
||
| Utilities | 3 | $41B |
|
||
| Healthcare | 2 | $330B |
|
||
Price history
+133.6% since first listed18 events — show timeline
- 2025-12-29 Listed $210,000 NTREIS
- 2025-12-20 Rental Removed $1,500 NTREIS
- 2025-10-18 Listed for Rent $1,500 NTREIS
- 2025-09-23 Listing Removed — NTREIS
- 2025-06-21 Price Changed $190,000 NTREIS
- 2025-06-12 Listed $210,000 NTREIS
- 2025-03-05 Sold (Public Records) — Public Records
- 2025-03-04 Sold (MLS) — NTREIS
- 2025-02-15 Pending — NTREIS
- 2025-02-08 Contingent — NTREIS
- 2025-02-03 Listed $89,900 NTREIS
- 2013-11-19 Sold (Public Records) — Public Records
- 2007-04-26 Sold (Public Records) — Public Records
- 2007-03-02 Sold (Public Records) — Public Records
- 2006-10-20 Sold (Public Records) — Public Records
- 2006-02-03 Sold (Public Records) — Public Records
- 2001-05-16 Sold (Public Records) — Public Records
- 2001-02-01 Sold (Public Records) — Public Records
Property tax history
+0.9%/yrLatest (2025): $932 · +14.0% YoY. Source: county tax records.
Cash-flow waterfall
monthlySold comps — $/sqft
last 12 mo · ≤1 miLoading sold comps…