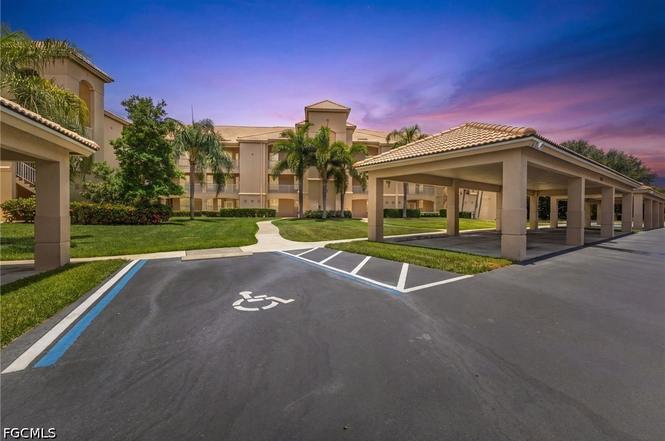
9110 Southmont Cv #101 · Harlem Heights, FL
Flood risk 8/10 · Major
- FEMA flood zone
- AE
- Chance of flooding over 30 yrs
- 0.97%
- Est. flood insurance / yr
- $1,737 – $8,500
Fire risk 4/10 · Minor
- Est. fire insurance / yr
- $947 – $1,759
Heat risk 10/10 · Severe
- Hot days now (above 107°F)
- 7 days/yr
- Hot days in 30 yrs
- 29 days/yr
Wind risk 10/10 · Severe
- Chance of severe wind over 30 yrs
- 99.0%
Air-quality risk 2/10 · Minimal
- Unhealthy air days now
- 1 days/yr
- Unhealthy air days in 30 yrs
- 1 days/yr
Risk factors via First Street. Map © Google.
Why this score? — see what drove the B grade
The composite is a weighted blend of 9 inputs, each scored 0–100. Each bar is that input's sub-score; the figure is the points it added to the 100-point composite (weight × sub-score).
- Cash flow +30.0/30.0
- 1% rule +10.0/10.0
- DSCR +10.0/10.0
- ARV discount +7.5/15.0
- Schools +4.1/10.0
- Livability +3.8/5.0
- Condition / age +2.5/5.0
- Rent growth +2.2/5.0
- Appreciation +0.0/10.0
$264,900
🖨 Deal sheet 📄 Offer letter ✓ Due diligence
Listing remarks MLS
IMMMACULATE LIGHT AND BRIGHT 3 BED/2 BED AMELIA FIRST FLOOR END UNIT LOCATED IN LEXINGTON'S LAKE VILLAGE! 18 TILE IN KITCHEN, ENTRY, DINING, AND LIVING AREAS! JANUARY 2013 A/C, 2009 HOT WATER HEATER, NEWLY SCREENED ENTRY AND LANAI (FEBRUARY 2013) CUSTOM MADE CORNICES PLUS SELLING FURNISHED! PAY AS YOU PLAY GOLF!
Key facts
- Split-bedroom layout
- Screened front entry
- $1,150 HOA
Tags
Property features AI
Finance
- Other: Pets allowed with conditions (maximum 2 pets; breed restrictions may apply)
- Financial info: Association fee billed quarterly
- HOA & community: Homeowners association (quarterly fees); Association covers management, cable TV, internet, irrigation water, grounds maintenance, pest control, recreation facilities, reserve fund, road maintenance, sewer, street lights, security, trash and water; Community amenities include clubhouse, fitness center, pool, cabana, tennis courts, pickleball, park, restaurant and private membership options; On-site management; Community of approximately 300 units; Community features: elevator, gated access, tennis courts, street lights
Exterior
- Parking: Assigned parking; Detached carport; One covered space
- Security: Gated community with guard; Security gate; Security guard; Smoke detector(s)
- Utilities: Public water; Public sewer; Cable available; High-speed internet available; Municipal irrigation
- Home design: Condominium (multi-unit community); Three stories; Entry level: 1; Faces southeast; Resale property
- Construction: Block, concrete and stucco construction; Tile roof
- Exterior features: Lanai; Porch; Screened porch; Sprinkler/Irrigation (automatic); Paved road access; Northwest exposure
Interior
- Kitchen: Dishwasher; Electric cooktop; Range; Self-cleaning oven; Microwave; Refrigerator; Freezer; Pantry; Breakfast bar
- Bedrooms: Split bedroom layout (bedrooms separated from main living areas)
- Flooring: Vinyl
- Bathrooms: 2 full bathrooms; Dual sinks; Separate shower
- Heating & cooling: Central heating (electric); Central air conditioning (electric)
- Interior features: Furnished; Breakfast bar; Dual sinks; Family/dining room; Living/dining room; Pantry; Separate shower; Shower only; Cable TV; Split bedrooms; Single hung windows
- Laundry & utility: Washer
Neighborhood map
What this means for you Summary
Snapshot
- This is a 3-bed/2.0-bath condo listed at $265k.
Deal economics
- At list price, monthly cash flow is $703 ($8k/yr) — positive.
- The deal already cash-flows at list — no discount required.
- Meets the 1% rule at list price ($5k rent vs $265k).
- Cap rate 11.4% vs local median 2.9% in Harlem Heights — top-decile yield for the area; either an underpriced asset or a hidden risk that comps aren't pricing in. Stress-test before assuming the spread holds.
Location & tenants
- Location reads 75/100 on livability (#263 in FL, #4,209 nationally) — a middle-class / working-renter tenant base. Strengths: crime A+, cost of living A+, health & safety A+; Watch: schools F, amenities F, employment F.
- Lee (suburban): math 47% / reading 50% proficiency, ranked #42 of 73 in FL (top 58%) — families likely to look elsewhere, expect single-tenant / working-renter base with shorter leases.
- Market conditions: Rents soft (-1.2%/yr); 1244 active listings in the ZIP; 22 comparable units currently listed for rent nearby; rentals at typical pace (median 15d on market — plan ~3-4 weeks tenant-placement turnaround); solid renter incomes; 15,411 units permitted in Lee County in 2024 (4,686 in 5+ unit buildings).
- At $5,109/mo this rent would consume 81% of the median local household income ($75k/yr) (locally 1944% of renters already pay >50% of income on rent) — very limited rent-growth headroom before tenants either downsize or default.
Forward outlook
- Local home prices are declining (-3.0%/yr); year-one equity from $2k of loan paydown is wiped out by about $8k of value loss. Plan a longer hold.
- Lee County population projected at +44% by 2050 — long-run rental-demand tailwind backs the buy-and-hold thesis.
Negotiation context
- Only 1 days on market — expect competitive offers; lowballing is unlikely to land.
- 2 sale attempts with the ask held roughly flat each time — persistent listings suggest the price (not the market) is what's stuck; bring a comps-based counter.
- Current owner paid $169k; list at $265k implies a 57% gain — meaningful room to come down on a strong offer.
Risks & watch-outs
- Watch-outs: flood insurance adds $427/mo; HOA is 23% of rent.
- Climate carrying-cost: in FEMA flood zone AE (mandatory federal flood insurance); severe wind risk, 99% chance of damaging wind over 30y; extreme-heat days projected 7→29/yr by 2055 (HVAC capex compounding) — expect insurance premiums to compound above CPI over the hold.
Questions for the listing agent
- What's the actual annual flood-insurance premium (NFIP or private), and is the property in a SFHA with mandatory coverage?
- What does the HOA fee cover, when was the last increase, and are there any pending special assessments or reserve-fund shortfalls?
- Any open or pending special assessments — roof, HVAC, plumbing, elevator, façade? What's the per-unit balance and payoff schedule, and is the seller paying it off at close or rolling it to the buyer?
- Is there a deadline driving the sale (1031 exchange, divorce, estate, relocation)? That informs how much negotiation room exists.
- Schools are F-rated, which usually means shorter tenancies and higher turnover. Who's the typical renter profile here, and what's been the actual vacancy rate?
- What's the average days-on-market for RENTAL listings here right now (not sales)? A rising rental-DOM trend means longer vacancies and softer asking-rent achievability than the comps imply.
- What's the recent tenant-quality profile in this submarket — average credit score on applications, eviction rate, late-payment / NSF rate, and stable-employment percentage? A property-management company in the area should have these aggregated.
- How much new apartment / multifamily construction is in the pipeline within 1–3 miles? Heavy new supply (>2% of stock underway) typically softens rents 12–24 months out; light construction supports rent growth.
Investment metrics
- 1% rule
- 1.93% ✓
- Cap rate
- 11.41%
- Cash-on-cash
- 18.28%
- DSCR
- 1.81
- GRM
- 4.3
CMA / ARV
No comps found within radius.
Projected returns pro-forma
-3.0% appreciation · 0.0% rent growth · sell at horizon
- IRR
- -4.6%
- Equity multiple
- 0.84×
- Total profit
- $-12,119
- Equity at exit
- $39,497
- IRR
- -1.7%
- Equity multiple
- 0.91×
- Total profit
- $-6,694
- Equity at exit
- $22,904
Cash invested: $74,172 (down + closing). Projections, not guarantees.
Landlord ↔ Tenant lean methodology
- Overall (STATE)
- 87 Strongly Landlord-Friendly
- State Florida
- 87 Strongly Landlord-Friendly · R+3
- County
- — inherits STATE
- City
- — inherits STATE
ZIP-level market 33908
- Home prices YoY
- -32.8%
- Rents YoY
- -1.2%
- Active inventory
- 1244
- Price-to-rent
- 4.3×
Monthly cashflow live
- Estimated rent
- $5,109 high interval (Pro) →
- Mortgage (P&I)
- −$1,389
- Tax from tax record
- −$257 /mo · $3,087/yr
- Insurance
- −$110
- Flood insurance flood zone
- −$427 /mo · $5,118/yr
- HOA
- −$1,150
- Vacancy / Maint / Mgmt
- −$1,073
- Net cashflow
- $703
Break-even live
UW: 25.0% down · 7.5% · 30yr · 1.5% tax · 5.0% vac · 8.0% maint · 8.0% mgmt
Financing live
Cash to close
- Down payment
- $66,225
- Closing costs
- $7,947
- Reserves months
- —
- Total cash needed
- —
Loan-product check · same deal, 3 products live
Conventional
25% down · 7.5% · 30yr
- Down + closing
- —
- Monthly P&I
- —
- Monthly cashflow
- —
- DSCR
- —
- Eligible?
- —
Personal DTI + credit; lowest rate.
DSCR
20% down · 8.5% · 30yr
- Down + closing
- —
- Monthly P&I
- —
- Monthly cashflow
- —
- DSCR
- —
- Eligible?
- —
No personal income docs; deal must DSCR.
Hard money
10% down · 12.0% · 12mo
- Down + closing
- —
- Monthly P&I
- —
- Monthly cashflow
- —
- DSCR
- —
- Eligible?
- —
Short-term bridge; refi at stabilization.
Rent comps 22 comps
| Address | Beds | Baths | Sqft | Rent | $/sqft | DOM | Units | Dist |
|---|---|---|---|---|---|---|---|---|
| 9140 Southmont Cv #102 Fort Myers, FL | 3.0 | 2.0 | 1331 | $2,500 | $1.88 | 14d | 1 | 0.03mi |
| 17100 Bridgestone Ct #303 Fort Myers, FL | 2.0 | 2.0 | 1175 | $4,575 | $3.89 | 14d | 1 | 0.16mi |
| 17020 Willowcrest Way Fort Myers, FL | 2.0–3.0 | 2.0 | 1344 | $6,300 | $4.69 | 16d | 2 | 0.18mi |
| 9170 Southmont Cv Fort Myers, FL | 2.0–3.0 | 2.0 | 1358 | $6,300 | $4.64 | 14d | 1 | 0.18mi |
| 9190 Southmont Cv #309 Fort Myers, FL | 3.0 | 2.0 | 1331 | $6,500 | $4.88 | 2d | 1 | 0.18mi |
| 8837 E Bay Cir Fort Myers, FL | 2.0 | 2.0 | 1156 | $2,600 | $2.25 | 23d | 1 | 0.23mi |
| 17120 Bridgestone Ct #104 Fort Myers, FL | 2.0 | 2.0 | 1282 | $2,400 | $1.87 | 23d | 1 | 0.25mi |
| 17120 Bridgestone Ct #104 Fort Myers, FL | 2.0 | 2.0 | 1175 | $2,400 | $2.04 | 3d | 1 | 0.25mi |
| 16491 Millstone Cir #207 Fort Myers, FL | 2.0 | 2.0 | 1348 | $2,000 | $1.48 | 14d | 1 | 0.36mi |
| 16481 Millstone Cir #207 Fort Myers, FL | 3.0 | 2.0 | 1348 | $2,700 | $2.00 | 23d | 1 | 0.40mi |
| 9240 Willowcrest Ct Fort Myers, FL | 2.0 | 2.0 | 1752 | $8,500 | $4.85 | 14d | 1 | 0.41mi |
| 16471 Millstone Cir #303 Fort Myers, FL | 2.0 | 2.0 | 1068 | $6,100 | $5.71 | 14d | 1 | 0.44mi |
| 9201 Bayberry Bnd #103 Fort Myers, FL | 2.0 | 2.0 | 1724 | $3,500 | $2.03 | 23d | 1 | 0.45mi |
| 17006 Middlebrook Ct Fort Myers, FL | 2.0 | 2.0 | 1498 | $6,300 | $4.21 | 16d | 1 | 0.53mi |
| 17006 Middlebrook Ct Fort Myers, FL | 2.0 | 2.0 | 1247 | $6,300 | $5.05 | 14d | 1 | 0.53mi |
| 16320 Willowcrest Way Fort Myers, FL | 2.0 | 2.0 | 1751 | $8,700 | $4.97 | 14d | 1 | 0.57mi |
| 16440 Millstone Cir #203 Fort Myers, FL | 2.0 | 2.0 | 1067 | $6,300 | $5.90 | 14d | 1 | 0.60mi |
| 9241 Bayberry Bnd #103 Fort Myers, FL | 3.0 | 2.0 | 1584 | $4,725 | $2.98 | 14d | 1 | 0.60mi |
| 9240 Bayberry Bnd #103 Fort Myers, FL | 3.0 | 2.0 | 1584 | $6,600 | $4.17 | 23d | 1 | 0.61mi |
| 16421 Millstone Cir Fort Myers, FL | 2.0 | 2.0 | 1068 | $4,400 | $4.12 | 16d | 2 | 0.62mi |
| 16430 Millstone Cir #103 Fort Myers, FL | 2.0 | 2.0 | 1067 | $6,300 | $5.90 | 14d | 1 | 0.63mi |
| 9250 Bayberry Bnd #202 Fort Myers, FL | 2.0 | 2.0 | 1669 | $4,950 | $2.97 | 14d | 1 | 0.64mi |
HOA detail condo
- Monthly dues
- $1,150 · $13,800/yr
- Likely covers
- water
- Assessments
- None detected in remarks — confirm with the listing agent.
Listing history 2 events
-
2026-06-17remarks 699-char remark
-
2026-06-17$264,900 Active 1 DOM
ⓘ Source: listings_history table (triggers on properties + properties_extension) + one-shot
backfill from property_details.listing_events for pre-trigger history.
Tax reassessment forecast FL · Resets to sale price
- Current annual tax
- $3,087 · $257/mo
- Projected year-2 tax
- $3,087 · $257/mo
- Expected delta
- $0/yr ($0/mo · 0.0%)
ⓘ Screening estimate from a state-policy table — verify with the county assessor before closing.
Climate risk First Street
- Flood 8/10 Severe FEMA zone AE · 97% chance over 30 yrs
- Wildfire 4/10 Moderate
- Heat 10/10 Extreme 7 d/yr ≥107°F today · 29 d/yr by 30 yrs out
- Wind 10/10 Extreme 99% chance of damaging wind over 30 yrs
- Air quality 2/10 Low 1 unhealthy d/yr today · 1 by 30 yrs out
Nearby sold comps map
Loading sold comps map…
Walkable amenities ~0.75 mi
Loading nearby amenities…
Taxation est. · year 1
- Rental income
- $61,312
- − Mortgage interest
- −$14,839
- − Property taxes
- −$3,087
- − Insurance
- −$6,443
- − Repairs & maintenance
- −$4,905
- − Management
- −$4,905
- − HOA
- −$13,800
- − Depreciation
- −$7,706
- Taxable income
- $5,628
- Est. tax owed @ 24.0%
- −$1,351
- After-tax cash flow
- $7,086/yr
For passive investors: Depreciation is non-cash, so a rental often shows a tax loss while cash-flowing — sheltering income. Rental losses are passive: they offset passive income freely, and up to $25,000/yr can offset ordinary (W-2) income if you actively participate and your MAGI is under $100k (phasing out to $0 by $150k); unused losses carry forward. On sale, claimed depreciation is recaptured at up to 25%, and gains may owe capital-gains tax (a 1031 exchange can defer both). Figures are a year-1 estimate at your 24.0% rate — not tax advice; consult a CPA.
Schools (NCES district)
- District
- Lee
- NCES district ID
- 1201080
- Math proficiency
- 47% ▼ -11.00%
- Reading proficiency
- 50% ▼ -4.00%
- Median HH income
- $49,518
- Composite
- 41.49/100
- National rank
- #3458
- State rank
- #42 of 73 in FL
Livability — Harlem Heights
- Score
- 75/100
- State rank
- #263
- US rank
- #4209
Category grades
Schools grade is shown separately in the Schools card above.
Census & demographics
- County
- Lee County · 788,662 people
- Metro
- Cape Coral-Fort Myers, FL
- Population (ZIP)
- 37,423
- Household income
- $75,396
- Rent vs Own
- Severe rent burden
- 1944.0
Population outlook (Lee County) Hauer SSP2
- Today (2025)
- 871,946 people
- By 2030
- 955,468 · +9.6%
- By 2040
- 1,113,587 · +27.7%
- By 2050
- 1,256,891 · +44.1%
- By 2075
- 1,560,270 · +78.9%
- By 2100
- 1,726,848 · +98.0%
Race, ethnicity, and origin ACS 2023
- Neighborhood character
- Predominantly White (88%)
- Race & ethnicity
- White 88% Hispanic / Latino 6% Two or more races 5% Black 3% Asian 1%
- Hispanic origin (detail)
- Mexican 1% Puerto Rican 2%
- Common ancestry
- Romanian 5% Lithuanian 4% Slovak 3%
- Foreign-born
- 10% · Canada, Jamaica
- Languages at home
- 90% English-only · Spanish 4% Russian/Polish/Slavic 1% Other Indo-European 1%
Political lean MEDSL · Lee
- 2024 margin
- Strong R (+28.4) · D 35.5% · R 63.9%
- 2008→2024 swing
- -18.0pp toward R · 2008: -10.4pp · 2024: -28.4pp
- All cycles
- 2024: R+28.4 2020: R+19.2 2016: R+20.4 2012: R+16.6 2008: R+10.4
Not yet ingested
- Civics
- —
Market trends
- HPI YoY
- ▼ -102.22%
- Current HPI
- 209.7595
- Rent YoY
- ▼ -1.18%
- Metro
- Cape Coral-Fort Myers, FL
- State GDP YoY
- ▲ 3.28%
- F500 in state
- 36
Industry mix (Fortune 500 HQ in FL)
| Industry | F500 HQs | Revenue |
|---|---|---|
| Industrial Technology | 2 | $29B |
|
||
| Insurance | 2 | $17B |
|
||
| Retail | 1 | $60B |
|
||
| Technology Distribution | 1 | $58B |
|
||
| Homebuilding | 1 | $35B |
|
||
| Technology Manufacturing | 1 | $35B |
|
||
Price history
+118.9% since first listed9 events — show timeline
- 2026-06-16 Listed $264,900 FORTMLS
- 2025-06-09 Listing Removed — NAPLESMLS
- 2025-03-28 Listed $350,000 NAPLESMLS
- 2013-04-22 Sold (Public Records) $169,000 Public Records
- 2013-04-19 Sold (MLS) $169,000 FORTMLS
- 2013-03-06 Price Changed $177,000 FORTMLS
- 2005-08-17 Sold (Public Records) $295,000 Public Records
- 2005-08-08 Sold (MLS) $295,000 FORTMLS
- 1998-12-03 Sold (Public Records) $121,000 Public Records
Property tax history
+2.5%/yrLatest (2025): $3,087 · -4.7% YoY. Source: county tax records.
Cash-flow waterfall
monthlySold comps — $/sqft
last 12 mo · ≤1 miLoading sold comps…