333 Old Robstown Rd · Corpus Christi, TX
Flood risk 1/10 · Minimal
- FEMA flood zone
- X (unshaded)
- Chance of flooding over 30 yrs
- 0.0%
- Est. flood insurance / yr
- $507 – $1,088
Fire risk 1/10 · Minimal
- Est. fire insurance / yr
- $1,222 – $2,270
Heat risk 10/10 · Severe
- Hot days now (above 107°F)
- 6 days/yr
- Hot days in 30 yrs
- 21 days/yr
Wind risk 9/10 · Severe
- Chance of severe wind over 30 yrs
- 99.0%
Air-quality risk 1/10 · Minimal
- Unhealthy air days now
- 0 days/yr
- Unhealthy air days in 30 yrs
- 0 days/yr
Risk factors via First Street. Map © Google.
Why this score? — see what drove the B+ grade
The composite is a weighted blend of 9 inputs, each scored 0–100. Each bar is that input's sub-score; the figure is the points it added to the 100-point composite (weight × sub-score).
- Cash flow +30.0/30.0
- 1% rule +10.0/10.0
- DSCR +10.0/10.0
- Appreciation +9.2/10.0
- ARV discount +7.5/15.0
- Livability +3.9/5.0
- Schools +2.8/10.0
- Rent growth +2.5/5.0
- Condition / age +2.5/5.0
$59,900
🖨 Deal sheet 📄 Offer letter ✓ Due diligence
Listing remarks
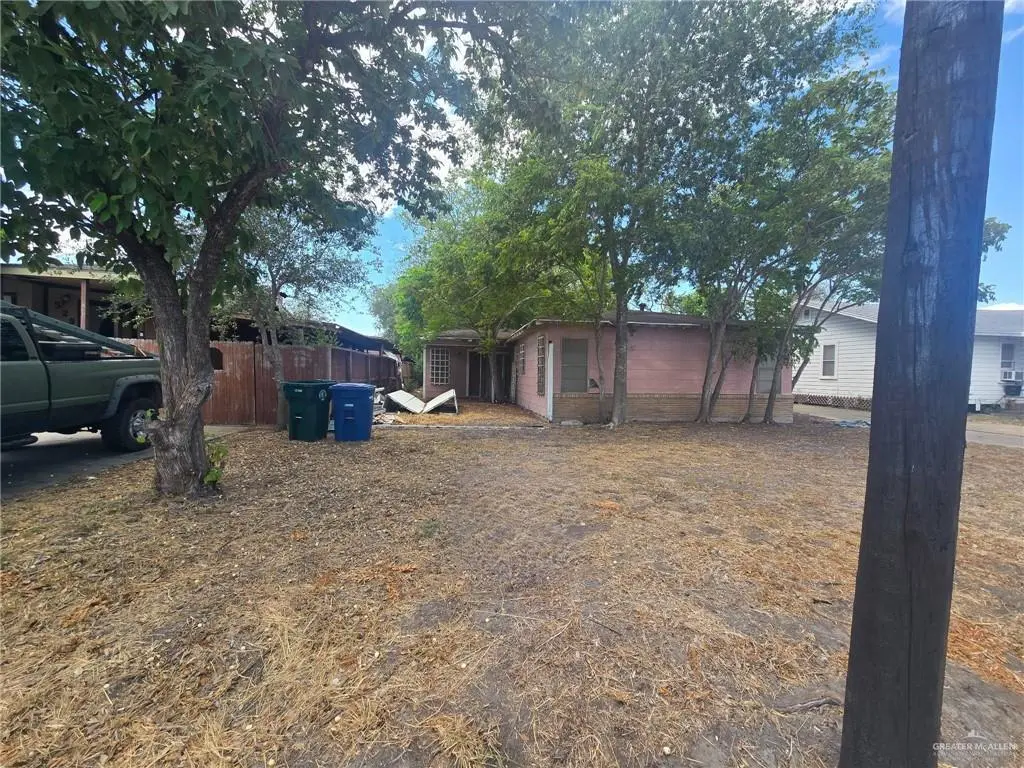
Exceptional value-add opportunity in an established Corpus Christi neighborhood. This 3-bedroom, 1-bath home offers living space with a traditional layout, ready for your creative vision. The property features a long driveway, a detached garage, and a spacious backyard with excellent flexibility for future improvements, expansions, or outdoor living upgrades. Ideally situated on a residential street, it provides quick, convenient access to local businesses, major roadways, and surrounding residential developments. Perfect for investors, contractors, or builders looking to renovate, rebuild, or add a high-potential asset to a long-term rental portfolio. Strong upside potential throughout. Pr
Key facts
- Spacious backyard
- Long driveway
- Detached garage
Tags
Property features AI
Finance
- Other: Lot about 0.19 acre (8,368 sq ft)
- HOA & community: No homeowners association
Exterior
- Parking: Detached garage (1 covered garage space, 1 total parking space)
- Utilities: Public water
- Home design: Single-story property; Frame/wood siding
- Construction: Composition shingle roof; Slab foundation; Frame/Wood construction with siding; Built area approximately 983 square feet
- Exterior features: Other exterior features; Paved road access; Public water
Interior
- Kitchen: Gas water heater; No conveying appliances
- Flooring: Hardwood; Tile; Vinyl
- Bathrooms: 1 full bathroom
- Interior features: Countertops (other); Window coverings; Living area
- Laundry & utility: Laundry room
Neighborhood map
What this means for you Summary
Snapshot
- This is a 3-bed/1.0-bath single-family listed at $60k.
Deal economics
- At list price, monthly cash flow is $278 ($3k/yr) — positive.
- The deal already cash-flows at list — no discount required.
- Meets the 1% rule at list price ($972 rent vs $60k).
- Recommended offer: $59k (1.5% below list) — sets the bar for market timing.
- Cap rate 11.9% vs local median 3.6% in Corpus Christi — top-decile yield for the area; either an underpriced asset or a hidden risk that comps aren't pricing in. Stress-test before assuming the spread holds.
Location & tenants
- Location reads 78/100 on livability (#66 in TX, #2,404 nationally) — a middle-class / working-renter tenant base. Strengths: commute A+, cost of living A+, housing A+; Watch: crime F.
- Corpus Christi ISD (urban): math 31% / reading 35% proficiency, ranked #562 of 826 in TX (top 68%) — families likely to look elsewhere, expect single-tenant / working-renter base with shorter leases; 63% free/reduced lunch — lower-income household profile, screen leases tightly.
- Market conditions: 36 active listings in the ZIP; 10 comparable units currently listed for rent nearby; rentals at typical pace (median 21d on market — plan ~3-4 weeks tenant-placement turnaround); 1,397 units permitted in Nueces County in 2024 (47 in 5+ unit buildings).
Forward outlook
- In year one you build about $5k of equity ($414 loan paydown + $5k appreciation (8.5% local appreciation)).
- Nueces County population projected at +36% by 2050 — long-run rental-demand tailwind backs the buy-and-hold thesis.
- At projected returns (8.5% appreciation + 3.0% rent growth), your $17k cash investment doubles in ~2 years — after that, you're playing with house money.
- By year 6, paydown + projected appreciation supports a ~$31k cash-out refi (75% LTV) — recoverable capital for the next deal without selling this one.
Negotiation context
- It's been on market 30 days — a 2% lower offer ($59k) is reasonable based on typical stale-listing flexibility.
Risks & watch-outs
- Watch-outs: property tax is 3.0% of price; built in 1957 — expect roof / HVAC / electrical / plumbing capex.
- Climate carrying-cost: severe wind risk, 99% chance of damaging wind over 30y; extreme-heat days projected 6→21/yr by 2055 (HVAC capex compounding) — expect insurance premiums to compound above CPI over the hold.
Questions for the listing agent
- Built in 1957 — when were the roof, HVAC, electrical panel, plumbing, and water heater last replaced?
- Property tax is high relative to price — has the assessment been appealed recently, and will the sale trigger a re-assessment?
- Is there a deadline driving the sale (1031 exchange, divorce, estate, relocation)? That informs how much negotiation room exists.
- Crime grade is F in this area — have there been break-ins, vandalism, or insurance claims at this property in the last 3 years? What carrier currently insures it and at what premium?
- What's the average days-on-market for RENTAL listings here right now (not sales)? A rising rental-DOM trend means longer vacancies and softer asking-rent achievability than the comps imply.
- What's the recent tenant-quality profile in this submarket — average credit score on applications, eviction rate, late-payment / NSF rate, and stable-employment percentage? A property-management company in the area should have these aggregated.
- How much new for-sale + rental construction is in the pipeline within 1–3 miles? Heavy new supply typically softens prices + rents 12–24 months out; constrained supply supports both.
Investment metrics
- 1% rule
- 1.62% ✓
- Cap rate
- 11.86%
- Cash-on-cash
- 19.88%
- DSCR
- 1.88
- GRM
- 5.1
CMA / ARV
- ARV (on-the-fly)
- $125,824
- Comps found
- 12
Show comp detail 12 sales within ~0.75 mi
| Address | Dist | Beds/Ba | Sqft | Sold | Price | $/sf | Match |
|---|---|---|---|---|---|---|---|
| 251 W Longview St | 0.33mi | 3/1.0 | 1,013 (+3%) | 2mo | $59,000 | $58 | 78 |
| 314 Old Robstown | 0.06mi | 3/2.0 | 1,121 (+14%) | 8mo | $162,500 | $145 | 63 |
| 214 Shawnee | 0.43mi | 3/1.0 | 922 (-6%) | 12mo | $119,000 | $129 | 59 |
| 444 Dixon Dr | 0.38mi | 2/1.0 (-1) | 1,052 (+7%) | 9mo | $134,500 | $128 | 58 |
| 326 Virginia Ave | 0.62mi | 3/1.0 | 915 (-7%) | 3mo | $135,000 | $148 | 57 |
| 541 Villa Dr | 0.47mi | 2/1.0 (-1) | 928 (-6%) | 9mo | $46,900 | $51 | 57 |
| 423 Fairview Dr | 0.37mi | 3/1.5 | 1,110 (+13%) | 4mo | $120,000 | $108 | 56 |
| 222 Westgate Dr | 0.51mi | 2/1.0 (-1) | 1,067 (+8%) | 4mo | $59,999 | $56 | 54 |
| 357 W Saxet Dr | 0.30mi | 3/1.0 | 1,128 (+15%) | 11mo | $188,900 | $167 | 52 |
| 615 Dolores St | 0.73mi | 3/2.0 | 918 (-7%) | 8mo | $130,400 | $142 | 44 |
| 921 Nandina Dr | 0.74mi | 3/1.0 | 1,057 (+8%) | 13mo | $72,000 | $68 | 42 |
| 334 Osage St | 0.74mi | 3/2.0 | 840 (-14%) | 10mo | $36,000 | $43 | 29 |
Match score weights: distance 35% · size 25% · config 20% · recency 20%. Top-matched comps best support the ARV.
Projected returns pro-forma
8.49% appreciation · 3.0% rent growth · sell at horizon
- IRR
- 36.5%
- Equity multiple
- 3.64×
- Total profit
- $44,313
- Equity at exit
- $47,510
- IRR
- 32.3%
- Equity multiple
- 7.90×
- Total profit
- $115,680
- Equity at exit
- $96,283
Cash invested: $16,772 (down + closing). Projections, not guarantees.
Landlord ↔ Tenant lean methodology
- Overall (STATE)
- 87 Strongly Landlord-Friendly
- State Texas
- 87 Strongly Landlord-Friendly · R+5
- County
- — inherits STATE
- City
- — inherits STATE
ZIP-level market 78408
- Home prices YoY
- 6.8%
- Active inventory
- 36
- Price-to-rent
- 5.1×
Monthly cashflow live
- Estimated rent
- $972 high interval (Pro) →
- Mortgage (P&I)
- −$314
- Tax from tax record
- −$151 /mo · $1,807/yr
- Insurance
- −$25
- HOA
- −$0
- Vacancy / Maint / Mgmt
- −$204
- Net cashflow
- $278
Break-even live
UW: 25.0% down · 7.5% · 30yr · 1.5% tax · 5.0% vac · 8.0% maint · 8.0% mgmt
Financing live
Cash to close
- Down payment
- $14,975
- Closing costs
- $1,797
- Reserves months
- —
- Total cash needed
- —
Loan-product check · same deal, 3 products live
Conventional
25% down · 7.5% · 30yr
- Down + closing
- —
- Monthly P&I
- —
- Monthly cashflow
- —
- DSCR
- —
- Eligible?
- —
Personal DTI + credit; lowest rate.
DSCR
20% down · 8.5% · 30yr
- Down + closing
- —
- Monthly P&I
- —
- Monthly cashflow
- —
- DSCR
- —
- Eligible?
- —
No personal income docs; deal must DSCR.
Hard money
10% down · 12.0% · 12mo
- Down + closing
- —
- Monthly P&I
- —
- Monthly cashflow
- —
- DSCR
- —
- Eligible?
- —
Short-term bridge; refi at stabilization.
Rent comps 10 comps
| Address | Beds | Baths | Sqft | Rent | $/sqft | DOM | Units | Dist |
|---|---|---|---|---|---|---|---|---|
| 3115 Agnes St Corpus Christi, TX | 2.0 | 1.0 | 428 | $828 | $1.93 | 43d | 3 | 0.58mi |
| 3762 Up River Rd Corpus Christi, TX | 1.0–2.0 | 1.0–2.0 | 855 | $1,199 | $1.40 | 13d | 6 | 0.60mi |
| 725 Villa Dr Unit 7 Corpus Christi, TX | 2.0 | 1.0 | 628 | $649 | $1.03 | 43d | 1 | 0.61mi |
| 725 Villa Dr Corpus Christi, TX | 2.0 | 1.0 | 650 | $649 | $1.00 | 13d | 1 | 0.62mi |
| 3302 Up River Rd Corpus Christi, TX | 2.0 | 1.0 | 710 | $699 | $0.98 | 13d | 1 | 0.63mi |
| 2937 Ruth St Corpus Christi, TX | 2.0 | 1.0 | 676 | $950 | $1.41 | 43d | 1 | 0.86mi |
| 4505 Up River Rd Corpus Christi, TX | 2.0 | 1.0 | 966 | $1,450 | $1.50 | 13d | 1 | 0.88mi |
| 1114 25th St Corpus Christi, TX | 1.0–2.0 | 1.0 | 712 | $1,050 | $1.47 | 13d | 6 | 1.19mi |
| 2245 Comanche St Unit A Corpus Christi, TX | 3.0 | 1.0 | 1016 | $1,350 | $1.33 | 21d | 1 | 1.23mi |
| 2402 Segrest St Corpus Christi, TX | 2.0 | 1.0 | 1120 | $825 | $0.74 | 21d | 1 | 1.43mi |
Listing history 17 events
-
2026-06-19price $59,900 Active 30 DOM
-
2026-06-18days on market $65,000 Active 30 DOM
-
2026-06-17days on market $65,000 Active 29 DOM
-
2026-06-16days on market $65,000 Active 28 DOM
-
2026-06-15days on market $65,000 Active 27 DOM
-
2026-06-14days on market $65,000 Active 25 DOM
-
2026-06-10days on market $65,000 Active 22 DOM
-
2026-06-09days on market $65,000 Active 21 DOM
-
2026-06-08days on market $65,000 Active 20 DOM
-
2026-06-07days on market $65,000 Active 19 DOM
-
2026-06-05days on market $65,000 Active 16 DOM
-
2026-06-03days on market $65,000 Active 15 DOM
-
2026-06-02days on market $65,000 Active 14 DOM
-
2026-06-01days on market $65,000 Active 13 DOM
-
2026-05-31days on market $65,000 Active 12 DOM
-
2026-05-30days on market $65,000 Active 11 DOM
-
2026-05-19$65,000 Active
ⓘ Source: listings_history table (triggers on properties + properties_extension) + one-shot
backfill from property_details.listing_events for pre-trigger history.
Tax reassessment forecast TX · Resets to sale price
- Current annual tax
- $1,807 · $151/mo
- Projected year-2 tax
- $1,807 · $151/mo
- Expected delta
- $0/yr ($0/mo · 0.0%)
ⓘ Screening estimate from a state-policy table — verify with the county assessor before closing.
Climate risk First Street
- Flood 1/10 Low FEMA zone X (unshaded) · 0% chance over 30 yrs
- Wildfire 1/10 Low
- Heat 10/10 Extreme 6 d/yr ≥107°F today · 21 d/yr by 30 yrs out
- Wind 9/10 Extreme 99% chance of damaging wind over 30 yrs
- Air quality 1/10 Low 0 unhealthy d/yr today · 0 by 30 yrs out
Nearby sold comps map
Loading sold comps map…
Walkable amenities ~0.75 mi
Loading nearby amenities…
Taxation est. · year 1
- Rental income
- $11,658
- − Mortgage interest
- −$3,355
- − Property taxes
- −$1,807
- − Insurance
- −$300
- − Repairs & maintenance
- −$933
- − Management
- −$933
- − Depreciation
- −$1,743
- Taxable income
- $2,588
- Est. tax owed @ 24.0%
- −$621
- After-tax cash flow
- $2,713/yr
For passive investors: Depreciation is non-cash, so a rental often shows a tax loss while cash-flowing — sheltering income. Rental losses are passive: they offset passive income freely, and up to $25,000/yr can offset ordinary (W-2) income if you actively participate and your MAGI is under $100k (phasing out to $0 by $150k); unused losses carry forward. On sale, claimed depreciation is recaptured at up to 25%, and gains may owe capital-gains tax (a 1031 exchange can defer both). Figures are a year-1 estimate at your 24.0% rate — not tax advice; consult a CPA.
Schools (NCES district)
- District
- Corpus Christi ISD
- NCES district ID
- 4815270
- Math proficiency
- 31% ▼ -18.00%
- Reading proficiency
- 35% ▼ -7.00%
- Median HH income
- $45,672
- Composite
- 28.27/100
- National rank
- #6793
- State rank
- #562 of 826 in TX
Livability — Corpus Christi
- Score
- 78/100
- State rank
- #66
- US rank
- #2404
Category grades
Schools grade is shown separately in the Schools card above.
Census & demographics
- Census place
- Corpus Christi, TX
- City population
- 296,836
- Population (ZIP)
- 9,631
Population outlook (Nueces County) Hauer SSP2
- Today (2025)
- 418,037 people
- By 2030
- 447,123 · +7.0%
- By 2040
- 505,911 · +21.0%
- By 2050
- 567,522 · +35.8%
- By 2075
- 729,686 · +74.6%
- By 2100
- 847,087 · +102.6%
Race, ethnicity, and origin ACS 2023
- Neighborhood character
- Predominantly Hispanic (84%)
- Race & ethnicity
- Hispanic / Latino 84% Two or more races 39% White 8% Black 7%
- Hispanic origin (detail)
- Mexican 78%
- Foreign-born
- 10% · Canada, Vietnam
- Languages at home
- 46% English-only · Spanish 53% Vietnamese 1%
Political lean MEDSL · Nueces
- 2024 margin
- R (+11.5) · D 43.8% · R 55.3%
- 2008→2024 swing
- -7.1pp toward R · 2008: -4.4pp · 2024: -11.5pp
- All cycles
- 2024: R+11.5 2020: R+2.9 2016: R+1.5 2012: R+3.2 2008: R+4.4
Not yet ingested
- Civics
- —
Market trends
- HPI YoY
- ▲ 8.49%
- Current HPI
- 132.544
- Rent YoY
- —
- Metro
- —
- State GDP YoY
- ▲ 3.95%
- F500 in state
- 110
Industry mix (Fortune 500 HQ in TX)
| Industry | F500 HQs | Revenue |
|---|---|---|
| Energy | 16 | $1,198B |
|
||
| Technology | 5 | $198B |
|
||
| Engineering / Construction | 4 | $72B |
|
||
| Energy Services | 3 | $60B |
|
||
| Utilities | 3 | $41B |
|
||
| Healthcare | 2 | $330B |
|
||
Price history
1 event — show timeline
- 2026-05-19 Listed $65,000 MCALLENMLS
Property tax history
+1.6%/yrLatest (2025): $1,807 · -16.8% YoY. Source: county tax records.
Cash-flow waterfall
monthlySold comps — $/sqft
last 12 mo · ≤1 miLoading sold comps…