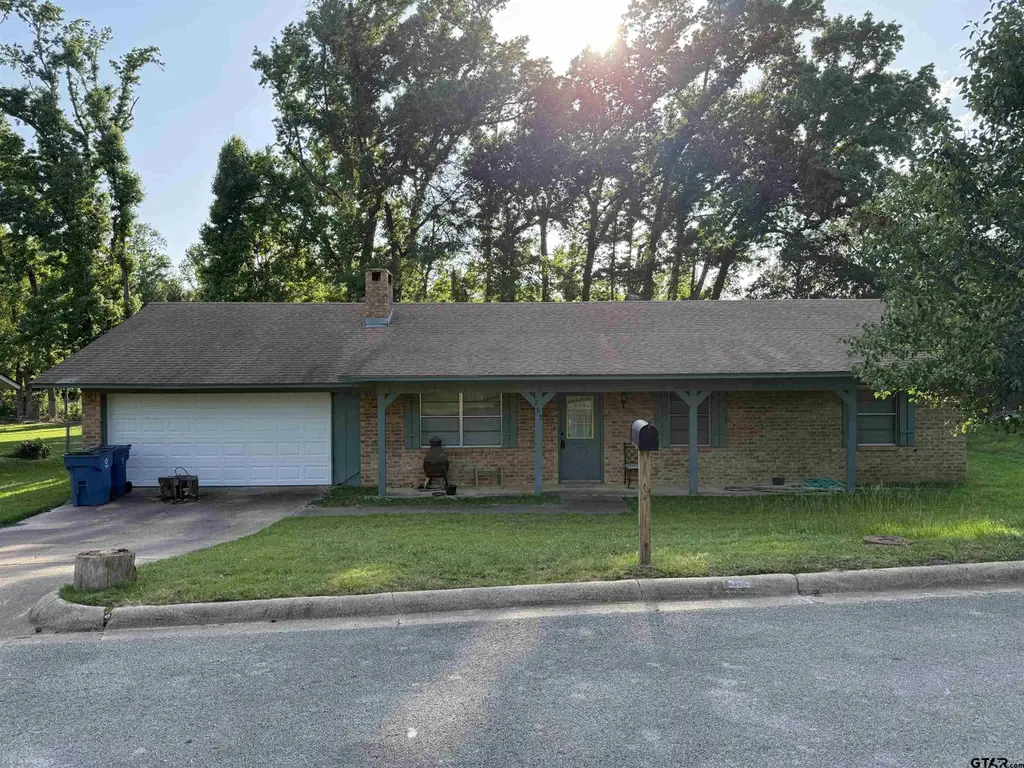
203 N Paradise Dr · Overton, TX
Flood risk 4/10 · Minor
- FEMA flood zone
- X (unshaded)
- Chance of flooding over 30 yrs
- 0.24%
- Est. flood insurance / yr
- $507 – $1,088
Fire risk 4/10 · Minor
- Est. fire insurance / yr
- $1,222 – $2,270
Heat risk 7/10 · Major
- Hot days now (above 109°F)
- 7 days/yr
- Hot days in 30 yrs
- 26 days/yr
Wind risk 6/10 · Moderate
- Chance of severe wind over 30 yrs
- 61.0%
Air-quality risk 2/10 · Minimal
- Unhealthy air days now
- 0 days/yr
- Unhealthy air days in 30 yrs
- 1 days/yr
Risk factors via First Street. Map © Google.
Why this score? — see what drove the C grade
The composite is a weighted blend of 9 inputs, each scored 0–100. Each bar is that input's sub-score; the figure is the points it added to the 100-point composite (weight × sub-score).
- Cash flow +17.2/30.0
- ARV discount +15.0/15.0
- 1% rule +5.4/10.0
- DSCR +5.4/10.0
- Appreciation +5.0/10.0
- Schools +3.5/10.0
- Livability +3.5/5.0
- Rent growth +2.5/5.0
- Condition / age +2.5/5.0
$132,500
🖨 Deal sheet 📄 Offer letter ✓ Due diligence
Listing remarks
Come check out this wonderful investment opportunity located in the heart of East Texas! This home features 3 bedrooms and 2 bathrooms with a large wood burning fireplace. There is a spacious garage for 2 cars, as well as additional storage space. The laundry room is equipped with floor-to-ceiling built-in storage compartments/cabinets. The home's backyard is large, fenced, contains a covered patio, and a small storage shed! This property is worth the look!
Key facts
- Covered patio
- Small storage shed
- 0.32 acre lot
Tags
Property features AI
Exterior
- Parking: 2-car garage with garage door opener
- Home design: Single-family detached home; Single-story
- Construction: Brick and wood siding exterior; Composition roof
- Exterior features: Covered porch; Chain link fencing; Above-ground pool; Outbuilding
Interior
- Kitchen: Electric oven; Electric range; Refrigerator; Microwave
- Bathrooms: 2 full bathrooms
- Heating & cooling: Central heating (electric); Central air; Ceiling fans
- Interior features: Walk-in closets; Wood-burning fireplace
Neighborhood map
What this means for you Summary
Snapshot
- This is a 3-bed/2.0-bath single-family listed at $132k.
Deal economics
- At list price, monthly cash flow is $95 ($1k/yr) — positive.
- The deal already cash-flows at list — no discount required.
- Meets the 1% rule at list price ($1k rent vs $132k).
- Recommended offer: $131k (1.5% below list) — sets the bar for market timing.
Location & tenants
- Location reads 69/100 on livability (#432 in TX) — a middle-class / working-renter tenant base. Strengths: cost of living A+, health & safety A+, crime A; Watch: schools D+, amenities F, commute F.
- Arp ISD (rural): math 37% / reading 43% proficiency, ranked #400 of 826 in TX (top 48%) — families likely to look elsewhere, expect single-tenant / working-renter base with shorter leases.
- Market conditions: 70 active listings in the ZIP; 1 comparable units currently listed for rent nearby; 595 units permitted in Smith County in 2024 (45 in 5+ unit buildings).
Forward outlook
- In year one you build about $5k of equity ($916 loan paydown + $4k appreciation (3.0% local appreciation)).
- Smith County population projected at +24% by 2050 — long-run rental-demand tailwind backs the buy-and-hold thesis.
- At projected returns (3.0% appreciation + 3.0% rent growth), your $37k cash investment doubles in ~6 years — after that, you're playing with house money.
- By year 7, paydown + projected appreciation supports a ~$31k cash-out refi (75% LTV) — recoverable capital for the next deal without selling this one.
Negotiation context
- It's been on market 20 days — a 2% lower offer ($131k) is reasonable based on typical stale-listing flexibility.
Risks & watch-outs
- Climate carrying-cost: major wind risk, 61% chance of damaging wind over 30y; extreme-heat days projected 7→26/yr by 2055 (HVAC capex compounding) — expect insurance premiums to compound above CPI over the hold.
Questions for the listing agent
- Is there a deadline driving the sale (1031 exchange, divorce, estate, relocation)? That informs how much negotiation room exists.
- Schools are D-rated, which usually means shorter tenancies and higher turnover. Who's the typical renter profile here, and what's been the actual vacancy rate?
- What's the average days-on-market for RENTAL listings here right now (not sales)? A rising rental-DOM trend means longer vacancies and softer asking-rent achievability than the comps imply.
- What's the recent tenant-quality profile in this submarket — average credit score on applications, eviction rate, late-payment / NSF rate, and stable-employment percentage? A property-management company in the area should have these aggregated.
- How much new for-sale + rental construction is in the pipeline within 1–3 miles? Heavy new supply typically softens prices + rents 12–24 months out; constrained supply supports both.
Investment metrics
- 1% rule
- 1.04% ✓
- Cap rate
- 7.16%
- Cash-on-cash
- 3.08%
- DSCR
- 1.14
- GRM
- 8.0
CMA / ARV
- ARV (on-the-fly)
- $204,450
- Comps found
- 2
Show comp detail 2 sales within ~0.75 mi
| Address | Dist | Beds/Ba | Sqft | Sold | Price | $/sf | Match |
|---|---|---|---|---|---|---|---|
| 201 N Meadowbrook Dr | 0.21mi | 3/2.0 | 1,507 (+4%) | 4mo | $114,400 | $76 | 81 |
| 101 N Meadowbrook Dr | 0.22mi | 3/2.0 | 1,558 (+7%) | 1mo | $220,000 | $141 | 76 |
Match score weights: distance 35% · size 25% · config 20% · recency 20%. Top-matched comps best support the ARV.
Projected returns pro-forma
3.0% appreciation · 3.0% rent growth · sell at horizon
- IRR
- 10.4%
- Equity multiple
- 1.60×
- Total profit
- $22,097
- Equity at exit
- $59,578
- IRR
- 12.7%
- Equity multiple
- 2.89×
- Total profit
- $70,271
- Equity at exit
- $91,816
Cash invested: $37,100 (down + closing). Projections, not guarantees.
Landlord ↔ Tenant lean methodology
- Overall (STATE)
- 87 Strongly Landlord-Friendly
- State Texas
- 87 Strongly Landlord-Friendly · R+5
- County
- — inherits STATE
- City
- — inherits STATE
ZIP-level market 75684
- Active inventory
- 70
- Price-to-rent
- 8.0×
Monthly cashflow live
- Estimated rent
- $1,375 medium interval (Pro) →
- Mortgage (P&I)
- −$695
- Tax from tax record
- −$241 /mo · $2,891/yr
- Insurance
- −$55
- HOA
- −$0
- Vacancy / Maint / Mgmt
- −$289
- Net cashflow
- $95
Break-even live
UW: 25.0% down · 7.5% · 30yr · 1.5% tax · 5.0% vac · 8.0% maint · 8.0% mgmt
Financing live
Cash to close
- Down payment
- $33,125
- Closing costs
- $3,975
- Reserves months
- —
- Total cash needed
- —
Loan-product check · same deal, 3 products live
Conventional
25% down · 7.5% · 30yr
- Down + closing
- —
- Monthly P&I
- —
- Monthly cashflow
- —
- DSCR
- —
- Eligible?
- —
Personal DTI + credit; lowest rate.
DSCR
20% down · 8.5% · 30yr
- Down + closing
- —
- Monthly P&I
- —
- Monthly cashflow
- —
- DSCR
- —
- Eligible?
- —
No personal income docs; deal must DSCR.
Hard money
10% down · 12.0% · 12mo
- Down + closing
- —
- Monthly P&I
- —
- Monthly cashflow
- —
- DSCR
- —
- Eligible?
- —
Short-term bridge; refi at stabilization.
Rent comps 1 comps
| Address | Beds | Baths | Sqft | Rent | $/sqft | DOM | Units | Dist |
|---|---|---|---|---|---|---|---|---|
| 304 E Cottonwood St Overton, TX | 2.0 | 2.0 | 1210 | $1,375 | $1.14 | 21d | 1 | 0.82mi |
Listing history 16 events
-
2026-06-15status $132,500 Pending 20 DOM
-
2026-06-15days on market $132,500 Active 20 DOM
-
2026-06-14days on market $132,500 Active 18 DOM
-
2026-06-13days on market $132,500 Active 17 DOM
-
2026-06-10days on market $132,500 Active 15 DOM
-
2026-06-09days on market $132,500 Active 14 DOM
-
2026-06-08days on market $132,500 Active 13 DOM
-
2026-06-07days on market $132,500 Active 12 DOM
-
2026-06-05days on market $132,500 Active 9 DOM
-
2026-06-02days on market $132,500 Active 7 DOM
-
2026-06-01days on market $132,500 Active 6 DOM
-
2026-05-31days on market $132,500 Active 5 DOM
-
2026-05-30days on market $132,500 Active 4 DOM
-
2026-05-26$132,500 Active
-
2015-01-21soldstatus
-
1993-03-17soldstatus
ⓘ Source: listings_history table (triggers on properties + properties_extension) + one-shot
backfill from property_details.listing_events for pre-trigger history.
Tax reassessment forecast TX · Resets to sale price
- Current annual tax
- $2,891 · $241/mo
- Projected year-2 tax
- $2,891 · $241/mo
- Expected delta
- $0/yr ($0/mo · 0.0%)
ⓘ Screening estimate from a state-policy table — verify with the county assessor before closing.
Climate risk First Street
- Flood 4/10 Moderate FEMA zone X (unshaded) · 24% chance over 30 yrs
- Wildfire 4/10 Moderate
- Heat 7/10 Severe 7 d/yr ≥109°F today · 26 d/yr by 30 yrs out
- Wind 6/10 Major 61% chance of damaging wind over 30 yrs
- Air quality 2/10 Low 0 unhealthy d/yr today · 1 by 30 yrs out
Nearby sold comps map
Loading sold comps map…
Walkable amenities ~0.75 mi
Loading nearby amenities…
Taxation est. · year 1
- Rental income
- $16,500
- − Mortgage interest
- −$7,422
- − Property taxes
- −$2,891
- − Insurance
- −$662
- − Repairs & maintenance
- −$1,320
- − Management
- −$1,320
- − Depreciation
- −$3,855
- Taxable loss
- −$970
- Est. tax savings @ 24.0%
- +$233
- After-tax cash flow
- $1,376/yr
For passive investors: Depreciation is non-cash, so a rental often shows a tax loss while cash-flowing — sheltering income. Rental losses are passive: they offset passive income freely, and up to $25,000/yr can offset ordinary (W-2) income if you actively participate and your MAGI is under $100k (phasing out to $0 by $150k); unused losses carry forward. On sale, claimed depreciation is recaptured at up to 25%, and gains may owe capital-gains tax (a 1031 exchange can defer both). Figures are a year-1 estimate at your 24.0% rate — not tax advice; consult a CPA.
Schools (NCES district)
- District
- Arp ISD
- NCES district ID
- 4808730
- Math proficiency
- 37% ▼ -10.00%
- Reading proficiency
- 43% ▼ -3.00%
- Median HH income
- $51,075
- Composite
- 34.58/100
- National rank
- #5165
- State rank
- #400 of 826 in TX
Livability — Overton
- Score
- 69/100
- State rank
- #432
- US rank
- #8906
Category grades
Schools grade is shown separately in the Schools card above.
Census & demographics
- Census place
- Overton, TX
- Population (ZIP)
- 7,655
Population outlook (Smith County) Hauer SSP2
- Today (2025)
- 248,890 people
- By 2030
- 261,665 · +5.1%
- By 2040
- 286,114 · +15.0%
- By 2050
- 308,006 · +23.8%
- By 2075
- 354,171 · +42.3%
- By 2100
- 372,828 · +49.8%
Race, ethnicity, and origin ACS 2023
- Neighborhood character
- Majority White (63%)
- Race & ethnicity
- White 63% Hispanic / Latino 20% Two or more races 15% Black 11%
- Hispanic origin (detail)
- Mexican 15% Puerto Rican 2%
- Common ancestry
- Italian 2% Lithuanian 2% Slovak 1%
- Foreign-born
- 6% · Canada
- Languages at home
- 86% English-only · Spanish 13%
Political lean MEDSL · Smith
- 2024 margin
- Solid R (+45.1) · D 27.0% · R 72.1%
- 2008→2024 swing
- -5.6pp toward R · 2008: -39.5pp · 2024: -45.1pp
- All cycles
- 2024: R+45.1 2020: R+39.4 2016: R+43.9 2012: R+46.9 2008: R+39.5
Not yet ingested
- Civics
- —
Market trends
- HPI YoY
- —
- Current HPI
- —
- Rent YoY
- —
- Metro
- —
- State GDP YoY
- ▲ 3.95%
- F500 in state
- 110
Industry mix (Fortune 500 HQ in TX)
| Industry | F500 HQs | Revenue |
|---|---|---|
| Energy | 16 | $1,198B |
|
||
| Technology | 5 | $198B |
|
||
| Engineering / Construction | 4 | $72B |
|
||
| Energy Services | 3 | $60B |
|
||
| Utilities | 3 | $41B |
|
||
| Healthcare | 2 | $330B |
|
||
Price history
3 events — show timeline
- 2026-05-26 Listed $132,500 GTAR
- 2015-01-21 Sold (Public Records) — Public Records
- 1993-03-17 Sold (Public Records) — Public Records
Property tax history
+7.9%/yrLatest (2024): $2,891 · +8.2% YoY. Source: county tax records.
Cash-flow waterfall
monthlySold comps — $/sqft
last 12 mo · ≤1 miLoading sold comps…