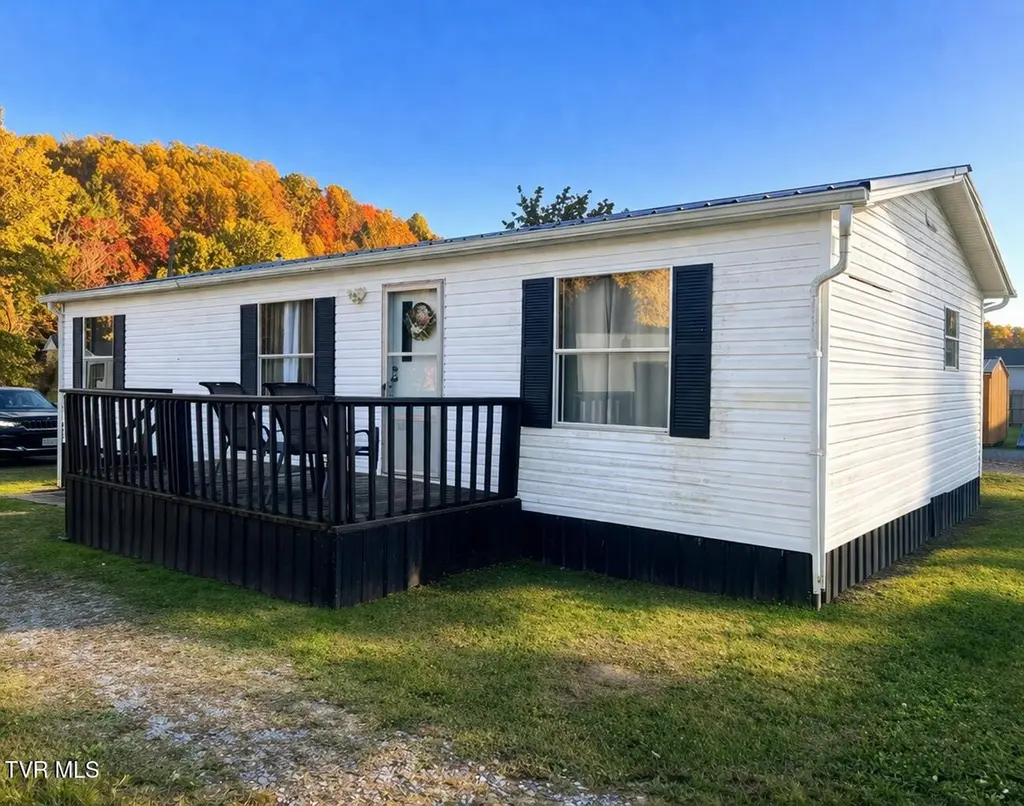
607 Spring Ave · Wise, VA
Flood risk 1/10 · Minimal
- FEMA flood zone
- X (unshaded)
- Chance of flooding over 30 yrs
- 0.0%
- Est. flood insurance / yr
- $507 – $1,088
Fire risk 3/10 · Minor
- Est. fire insurance / yr
- $666 – $1,236
Heat risk 2/10 · Minimal
- Hot days now (above 92°F)
- 7 days/yr
- Hot days in 30 yrs
- 22 days/yr
Wind risk 2/10 · Minimal
- Chance of severe wind over 30 yrs
- 1.0%
Air-quality risk 1/10 · Minimal
- Unhealthy air days now
- 0 days/yr
- Unhealthy air days in 30 yrs
- 0 days/yr
Risk factors via First Street. Map © Google.
Why this score? — see what drove the B+ grade
The composite is a weighted blend of 9 inputs, each scored 0–100. Each bar is that input's sub-score; the figure is the points it added to the 100-point composite (weight × sub-score).
- Cash flow +29.2/30.0
- ARV discount +13.3/15.0
- DSCR +10.0/10.0
- 1% rule +7.6/10.0
- Schools +6.3/10.0
- Livability +3.9/5.0
- Rent growth +2.5/5.0
- Condition / age +2.5/5.0
- Appreciation +0.3/10.0
$95,000
🖨 Deal sheet (PDF) 📄 Offer letter ✓ Due diligence
Listing remarks MLS
Charming and recently updated 3 bedroom, 2 bath situated on . 14 acres. Currently used as a rental property, this home offers a great opportunity for investors or anyone looking for an affordable, move in ready space.
Key facts
- 6,098 sq ft lot
- Built 1995
- Listed 52 days
Neighborhood map
What this means for you Summary
Snapshot
- This is a 3-bed/2.0-bath single-family listed at $95k.
Deal economics
- At list price, monthly cash flow is $332 ($4k/yr) — positive.
- The deal already cash-flows at list — no discount required.
- Meets the 1% rule at list price ($1k rent vs $95k).
- Recommended offer: $92k (3.0% below list) — sets the bar for market timing.
- Cap rate 10.5% vs local median 5.1% in Wise — top-decile yield for the area; either an underpriced asset or a hidden risk that comps aren't pricing in. Stress-test before assuming the spread holds.
Location & tenants
- Location reads 77/100 on livability (#99 in VA, #3,153 nationally) — a middle-class / working-renter tenant base. Strengths: cost of living A+, health & safety A, crime A-; Watch: employment D+, amenities F, commute F.
- Wise County Public School District (town): math 74% / reading 79% proficiency, ranked #11 of 131 in VA (top 8%) — strong family-tenant draw, lease renewals of 3-5y typical.
- Zoned schools: Union Primary (math 72% / reading 79%, grade A, #207 of 1,108 statewide, top 19%, 861 students, 84% FRL); Union Middle (math 58% / reading 70%, grade B+, #127 of 342 statewide, top 37%, 583 students, 89% FRL); Central High (math 87% / reading 87%, grade A, #16 of 319 statewide, top 5%, 674 students, 81% FRL) — zoned schools average 84% FRL vs 55% district-wide (30 pts higher); higher-poverty schools than district average — tighter screening recommended.
- Market conditions: 42 active listings in the ZIP; 17 units permitted in Wise County in 2024 (0 in 5+ unit buildings).
Forward outlook
- Local home prices are declining (-3.0%/yr); year-one equity from $657 of loan paydown is wiped out by about $3k of value loss. Plan a longer hold.
- Wise County population projected at -26% by 2050 — secular population decline; favor cash flow + early exit over multi-decade hold.
- At projected returns (-3.0% appreciation + 3.0% rent growth), your $27k cash investment doubles in ~8 years — after that, you're playing with house money.
Negotiation context
- It's been on market 52 days — a 3% lower offer ($92k) is reasonable based on typical stale-listing flexibility.
Questions for the listing agent
- It's been on market 52 days. Have you received any prior offers? Is the seller open to a 3% concession, seller financing, or rate buy-down credit?
- Is there a deadline driving the sale (1031 exchange, divorce, estate, relocation)? That informs how much negotiation room exists.
- Schools are A-rated — typically a magnet for longer-tenancy family renters. What's the average tenant stay here, and is there a school-zone premium baked into asking?
- What's the average days-on-market for RENTAL listings here right now (not sales)? A rising rental-DOM trend means longer vacancies and softer asking-rent achievability than the comps imply.
- What's the recent tenant-quality profile in this submarket — average credit score on applications, eviction rate, late-payment / NSF rate, and stable-employment percentage? A property-management company in the area should have these aggregated.
- How much new for-sale + rental construction is in the pipeline within 1–3 miles? Heavy new supply typically softens prices + rents 12–24 months out; constrained supply supports both.
Investment metrics
- 1% rule
- 1.26% ✓
- Cap rate
- 10.48%
- Cash-on-cash
- 14.97%
- DSCR
- 1.67
- GRM
- 6.6
CMA / ARV
- ARV (median comp)
- $109,016
- List price
- $95,000
- Delta
- -12.86%
- Verdict
- UNDERPRICED
- Comps
- 20 within 1.0 mi
Show comp detail 8 sales within ~0.75 mi
| Address | Dist | Beds/Ba | Sqft | Sold | Price | $/sf | Match |
|---|---|---|---|---|---|---|---|
| 111 Dale St | 0.10mi | 3/2.0 | 1,765 (+1%) | 2mo | $143,500 | $81 | 92 |
| 512 Wheatley Ave | 0.13mi | 3/2.0 | 1,970 (+13%) | 10mo | $265,000 | $135 | 64 |
| 614 Mars St | 0.71mi | 3/2.0 | 1,760 (+1%) | 13mo | $172,000 | $98 | 55 |
| 133 Roberts Ave Ave SW | 0.71mi | 3/3.0 | 1,655 (-5%) | 12mo | $180,000 | $109 | 44 |
| 406 Mason Ave | 0.46mi | 4/1.0 (+1) | 1,540 (-12%) | 8mo | $100,000 | $65 | 43 |
| 711 Main St | 0.55mi | 4/2.5 (+1) | 1,998 (+14%) | 7mo | $280,000 | $140 | 38 |
| 612 Orchard Ln | 0.68mi | 3/2.0 | 1,946 (+12%) | 18mo | $234,000 | $120 | 34 |
| 217 Vanover Ave | 0.55mi | 3/2.0 | 1,488 (-15%) | 21mo | $110,000 | $74 | 32 |
Match score weights: distance 35% · size 25% · config 20% · recency 20%. Top-matched comps best support the ARV.
Projected returns pro-forma
-3.0% appreciation · 3.0% rent growth · sell at horizon
- IRR
- 5.5%
- Equity multiple
- 1.22×
- Total profit
- $5,728
- Equity at exit
- $14,165
- IRR
- 15.0%
- Equity multiple
- 2.21×
- Total profit
- $32,163
- Equity at exit
- $8,214
Cash invested: $26,600 (down + closing). Projections, not guarantees.
Landlord ↔ Tenant lean methodology
- Overall (STATE)
- 55 Moderately Landlord-Leaning
- State Virginia
- 55 Moderately Landlord-Leaning · D+2
- County
- — inherits STATE
- City
- — inherits STATE
ZIP-level market 24293
- Home prices YoY
- -5.8%
- Active inventory
- 42
- Price-to-rent
- 6.6×
Monthly cashflow live
- Estimated rent
- $1,197 medium interval (Pro) →
- Mortgage (P&I)
- −$498
- Tax from tax record
- −$76 /mo · $914/yr
- Insurance
- −$40
- HOA
- −$0
- Vacancy / Maint / Mgmt
- −$251
- Net cashflow
- $332
Break-even live
Sensitivity live
| Price | -10% $386 | -5% $359 | +0% $332 | +5% $305 | +10% $278 |
|---|---|---|---|---|---|
| Rent | -10% $237 | -5% $284 | +0% $332 | +5% $379 | +10% $426 |
| Rate | -1.0pp $380 | -0.5pp $356 | base $332 | +0.5pp $307 | +1.0pp $282 |
UW: 25.0% down · 7.5% · 30yr · 1.5% tax · 5.0% vac · 8.0% maint · 8.0% mgmt
Financing live
Cash to close
- Down payment
- $23,750
- Closing costs
- $2,850
- Reserves months
- —
- Total cash needed
- —
Loan-product check · same deal, 3 products live
Conventional
25% down · 7.5% · 30yr
- Down + closing
- —
- Monthly P&I
- —
- Monthly cashflow
- —
- DSCR
- —
- Eligible?
- —
Personal DTI + credit; lowest rate.
DSCR
20% down · 8.5% · 30yr
- Down + closing
- —
- Monthly P&I
- —
- Monthly cashflow
- —
- DSCR
- —
- Eligible?
- —
No personal income docs; deal must DSCR.
Hard money
10% down · 12.0% · 12mo
- Down + closing
- —
- Monthly P&I
- —
- Monthly cashflow
- —
- DSCR
- —
- Eligible?
- —
Short-term bridge; refi at stabilization.
Listing history 5 events
-
2026-05-18status Pending 217-char remark
Show marketing remark (217 chars)
Charming and recently updated 3 bedroom, 2 bath situated on . 14 acres. Currently used as a rental property, this home offers a great opportunity for investors or anyone looking for an affordable, move in ready space.
-
2026-05-04price $95,000 217-char remark
Show marketing remark (217 chars)
Charming and recently updated 3 bedroom, 2 bath situated on . 14 acres. Currently used as a rental property, this home offers a great opportunity for investors or anyone looking for an affordable, move in ready space.
-
2026-04-29price $105,000 217-char remark
Show marketing remark (217 chars)
Charming and recently updated 3 bedroom, 2 bath situated on . 14 acres. Currently used as a rental property, this home offers a great opportunity for investors or anyone looking for an affordable, move in ready space.
-
2026-04-22price $110,000 217-char remark
Show marketing remark (217 chars)
Charming and recently updated 3 bedroom, 2 bath situated on . 14 acres. Currently used as a rental property, this home offers a great opportunity for investors or anyone looking for an affordable, move in ready space.
-
2026-03-26$115,000 Active 217-char remark
Show marketing remark (217 chars)
Charming and recently updated 3 bedroom, 2 bath situated on . 14 acres. Currently used as a rental property, this home offers a great opportunity for investors or anyone looking for an affordable, move in ready space.
ⓘ Source: listings_history table (triggers on properties + properties_extension) + one-shot
backfill from property_details.listing_events for pre-trigger history.
Tax reassessment forecast VA · Resets to sale price
- Current annual tax
- $914 · $76/mo
- Projected year-2 tax
- $914 · $76/mo
- Expected delta
- $0/yr ($0/mo · 0.0%)
ⓘ Screening estimate from a state-policy table — verify with the county assessor before closing.
Climate risk First Street
- Flood 1/10 Low FEMA zone X (unshaded) · 0% chance over 30 yrs
- Wildfire 3/10 Moderate
- Heat 2/10 Low 7 d/yr ≥92°F today · 22 d/yr by 30 yrs out
- Wind 2/10 Low 100% chance of damaging wind over 30 yrs
- Air quality 1/10 Low 0 unhealthy d/yr today · 0 by 30 yrs out
Nearby sold comps map
Loading sold comps map…
Walkable amenities ~0.75 mi
Loading nearby amenities…
Taxation est. · year 1
- Rental income
- $14,364
- − Mortgage interest
- −$5,321
- − Property taxes
- −$914
- − Insurance
- −$475
- − Repairs & maintenance
- −$1,149
- − Management
- −$1,149
- − Depreciation
- −$2,764
- Taxable income
- $2,592
- Est. tax owed @ 24.0%
- −$622
- After-tax cash flow
- $3,359/yr
For passive investors: Depreciation is non-cash, so a rental often shows a tax loss while cash-flowing — sheltering income. Rental losses are passive: they offset passive income freely, and up to $25,000/yr can offset ordinary (W-2) income if you actively participate and your MAGI is under $100k (phasing out to $0 by $150k); unused losses carry forward. On sale, claimed depreciation is recaptured at up to 25%, and gains may owe capital-gains tax (a 1031 exchange can defer both). Figures are a year-1 estimate at your 24.0% rate — not tax advice; consult a CPA.
Schools (NCES district)
- District
- Wise County Public School District
- NCES district ID
- 5104080
- Math proficiency
- 74% ▼ -20.00%
- Reading proficiency
- 79% ▼ -7.00%
- Median HH income
- $35,624
- Composite
- 63.37/100
- National rank
- #625
- State rank
- #11 of 131 in VA
Livability — Wise
- Score
- 77/100
- State rank
- #99
- US rank
- #3153
Category grades
Schools grade is shown separately in the Schools card above.
Census & demographics
- Census place
- Wise, VA
- Population (ZIP)
- 9,622
Population outlook (Wise County) Hauer SSP2
- Today (2025)
- 35,714 people
- By 2030
- 33,742 · -5.5%
- By 2040
- 29,870 · -16.4%
- By 2050
- 26,233 · -26.5%
- By 2075
- 18,296 · -48.8%
- By 2100
- 12,147 · -66.0%
Race, ethnicity, and origin ACS 2023
- Neighborhood character
- Predominantly White (96%)
- Race & ethnicity
- White 96% Two or more races 3% Hispanic / Latino 1%
- Common ancestry
- Serbian 4% Slovak 4% Lithuanian 2%
- Foreign-born
- 1% · Canada, South Korea
Political lean MEDSL · Wise
- 2024 margin
- Solid R (+63.3) · D 18.1% · R 81.4%
- 2008→2024 swing
- -35.6pp toward R · 2008: -27.7pp · 2024: -63.3pp
- All cycles
- 2024: R+63.3 2020: R+61.7 2016: R+62.0 2012: R+48.8 2008: R+27.7
Not yet ingested
- Civics
- —
Market trends
- HPI YoY
- ▼ -9.49%
- Current HPI
- 153.7377
- Rent YoY
- —
- Metro
- —
- State GDP YoY
- ▲ 2.40%
- F500 in state
- 50
Industry mix (Fortune 500 HQ in VA)
| Industry | F500 HQs | Revenue |
|---|---|---|
| Aerospace / Defense | 4 | $236B |
|
||
| Technology / Defense | 3 | $32B |
|
||
| Financial Services | 2 | $176B |
|
||
| Utilities | 2 | $27B |
|
||
| Insurance | 2 | $25B |
|
||
| Technology | 2 | $15B |
|
||
Price history
-17.4% since first listed5 events — show timeline
- 2026-05-18 Pending — TVRMLS
- 2026-05-04 Price Changed $95,000 TVRMLS
- 2026-04-29 Price Changed $105,000 TVRMLS
- 2026-04-22 Price Changed $110,000 TVRMLS
- 2026-03-26 Listed $115,000 TVRMLS
Property tax history
+2.0%/yrLatest (2025): $914 · +0.0% YoY. Source: county tax records.
Cash-flow waterfall
monthlySold comps — $/sqft
last 12 mo · ≤1 miLoading sold comps…