9447 Pagewood Ln · Houston, TX
Flood risk 8/10 · Major
- FEMA flood zone
- X (unshaded)
- Chance of flooding over 30 yrs
- 0.99%
- Est. flood insurance / yr
- $507 – $1,088
Fire risk 1/10 · Minimal
- Est. fire insurance / yr
- $1,222 – $2,270
Heat risk 9/10 · Severe
- Hot days now (above 110°F)
- 7 days/yr
- Hot days in 30 yrs
- 23 days/yr
Wind risk 9/10 · Severe
- Chance of severe wind over 30 yrs
- 99.0%
Air-quality risk 2/10 · Minimal
- Unhealthy air days now
- 2 days/yr
- Unhealthy air days in 30 yrs
- 2 days/yr
Risk factors via First Street. Map © Google.
Why this score? — see what drove the F grade
The composite is a weighted blend of 9 inputs, each scored 0–100. Each bar is that input's sub-score; the figure is the points it added to the 100-point composite (weight × sub-score).
- ARV discount +7.5/15.0
- 1% rule +4.6/10.0
- Livability +3.7/5.0
- Schools +2.7/10.0
- Condition / age +2.5/5.0
- Cash flow +2.1/30.0
- Rent growth +0.9/5.0
- DSCR +0.0/10.0
- Appreciation +0.0/10.0
$149,000
🖨 Deal sheet 📄 Offer letter ✓ Due diligence
Listing remarks
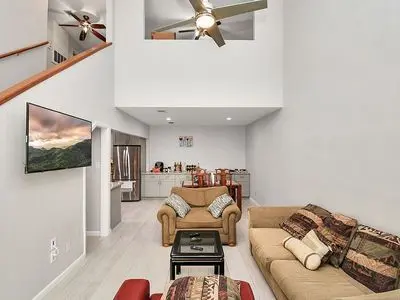
Step into the epitome of modern living with this beautifully remodeled townhome that effortlessly marries style and comfort. Every inch of this residence has been thoughtfully updated, ensuring it stands out in the market. The heart of this home is its state-of-the-art kitchen, boasting sleek upgrades and top-of-the-line appliances. From the countertops to the fixtures, every detail has been curated to inspire both budding and seasoned chefs alike. Coupled with the new floors that stretch throughout the entire condo, you& apos; ll quickly appreciate the seamless blend of elegance and functionality. Each of the bathrooms exudes a spa-like ambiance, having been remodeled to the highest st
Key facts
- New floors
- Charming fireplace
- Premium fittings
Tags
Property features AI
Exterior
- Home design: Built in 1978
- Construction: Single-family property with 1,358 square feet of living area; Year built 1978
- Exterior features: Located in the Mid West subdivision
Neighborhood map
What this means for you Summary
Snapshot
- This is a 3-bed/2.0-bath condo listed at $149k.
Deal economics
- At list price, monthly cash flow is $-613 ($-7k/yr) — negative.
- The deal already cash-flows at list — no discount required.
- To meet the 1% rule (rent ≥ 1% of price), the offer needs to be $143k (3.8% below list).
- Recommended offer: $143k (3.8% below list) — sets the bar for 1% rule.
- Cap rate 1.9% vs local median 3.2% in Houston — below-typical yield; the buyer is paying a premium for something (appreciation thesis, condition, location) that the cap rate doesn't capture.
Location & tenants
- Location reads 74/100 on livability (#184 in TX, #4,771 nationally) — a middle-class / working-renter tenant base. Strengths: amenities A+, cost of living A+, housing A+; Watch: schools D, crime F.
- Houston ISD (urban): math 27% / reading 35% proficiency, ranked #593 of 826 in TX (top 72%) — families likely to look elsewhere, expect single-tenant / working-renter base with shorter leases; 71% free/reduced lunch — lower-income household profile, screen leases tightly.
- Market conditions: Rents falling (-6.3%/yr); 288 active listings in the ZIP; 40 comparable units currently listed for rent nearby; rentals leasing fast (median 11d on market — plan ~1-2 weeks tenant-placement turnaround); 29,883 units permitted in Harris County in 2024 (8,621 in 5+ unit buildings).
Forward outlook
- Local home prices are declining (-3.0%/yr); year-one equity from $1k of loan paydown is wiped out by about $4k of value loss. Plan a longer hold.
- Harris County population projected at +47% by 2050 — long-run rental-demand tailwind backs the buy-and-hold thesis.
Negotiation context
- It's been on market 36 days — a 3% lower offer ($145k) is reasonable based on typical stale-listing flexibility.
- 3 sale attempts since 16y ago with the ask held roughly flat each time — persistent listings suggest the price (not the market) is what's stuck; bring a comps-based counter.
Risks & watch-outs
- Watch-outs: flood insurance adds $66/mo; HOA is 44% of rent.
- Climate carrying-cost: severe flood risk; severe wind risk, 99% chance of damaging wind over 30y; extreme-heat days projected 7→23/yr by 2055 (HVAC capex compounding) — expect insurance premiums to compound above CPI over the hold.
Questions for the listing agent
- What do current leases actually rent for vs. the listed asking? Can we see a recent rent roll and the last 12 months of T-12 income?
- It's been on market 36 days. Have you received any prior offers? Is the seller open to a 4% concession, seller financing, or rate buy-down credit?
- Built in 1978 — when were the roof, HVAC, electrical panel, plumbing, and water heater last replaced?
- What's the actual annual flood-insurance premium (NFIP or private), and is the property in a SFHA with mandatory coverage?
- What does the HOA fee cover, when was the last increase, and are there any pending special assessments or reserve-fund shortfalls?
- Any open or pending special assessments — roof, HVAC, plumbing, elevator, façade? What's the per-unit balance and payoff schedule, and is the seller paying it off at close or rolling it to the buyer?
- Is there a deadline driving the sale (1031 exchange, divorce, estate, relocation)? That informs how much negotiation room exists.
- Schools are D-rated, which usually means shorter tenancies and higher turnover. Who's the typical renter profile here, and what's been the actual vacancy rate?
- Crime grade is F in this area — have there been break-ins, vandalism, or insurance claims at this property in the last 3 years? What carrier currently insures it and at what premium?
- The area grade is low — what's the realistic commute time and amenity access for the typical tenant pool here? Any planned neighborhood developments (good or bad) we should know about?
- What's the average days-on-market for RENTAL listings here right now (not sales)? A rising rental-DOM trend means longer vacancies and softer asking-rent achievability than the comps imply.
- What's the recent tenant-quality profile in this submarket — average credit score on applications, eviction rate, late-payment / NSF rate, and stable-employment percentage? A property-management company in the area should have these aggregated.
- How much new apartment / multifamily construction is in the pipeline within 1–3 miles? Heavy new supply (>2% of stock underway) typically softens rents 12–24 months out; light construction supports rent growth.
Investment metrics
- 1% rule
- 0.96% ✗
- Cap rate
- 1.90%
- Cash-on-cash
- -15.71%
- DSCR
- 0.30
- GRM
- 8.7
CMA / ARV
No comps found within radius.
Projected returns pro-forma
-3.0% appreciation · 0.0% rent growth · sell at horizon
- IRR
- -58.8%
- Equity multiple
- -0.60×
- Total profit
- $-66,896
- Equity at exit
- $22,216
- IRR
- —
- Equity multiple
- -1.94×
- Total profit
- $-122,847
- Equity at exit
- $12,883
Cash invested: $41,720 (down + closing). Projections, not guarantees.
Landlord ↔ Tenant lean methodology
- Overall (STATE)
- 87 Strongly Landlord-Friendly
- State Texas
- 87 Strongly Landlord-Friendly · R+5
- County
- — inherits STATE
- City
- — inherits STATE
ZIP-level market 77063
- Rents YoY
- -6.3%
- Active inventory
- 288
- Price-to-rent
- 8.7×
Monthly cashflow live
- Estimated rent
- $1,433 high interval (Pro) →
- Mortgage (P&I)
- −$781
- Tax from tax record
- −$205 /mo · $2,460/yr
- Insurance
- −$62
- Flood insurance flood zone
- −$66 /mo · $798/yr
- HOA est. from 3 same-building comps
- −$630
- Vacancy / Maint / Mgmt
- −$301
- Net cashflow
- $-613
Break-even live
UW: 25.0% down · 7.5% · 30yr · 1.5% tax · 5.0% vac · 8.0% maint · 8.0% mgmt
Financing live
Cash to close
- Down payment
- $37,250
- Closing costs
- $4,470
- Reserves months
- —
- Total cash needed
- —
Loan-product check · same deal, 3 products live
Conventional
25% down · 7.5% · 30yr
- Down + closing
- —
- Monthly P&I
- —
- Monthly cashflow
- —
- DSCR
- —
- Eligible?
- —
Personal DTI + credit; lowest rate.
DSCR
20% down · 8.5% · 30yr
- Down + closing
- —
- Monthly P&I
- —
- Monthly cashflow
- —
- DSCR
- —
- Eligible?
- —
No personal income docs; deal must DSCR.
Hard money
10% down · 12.0% · 12mo
- Down + closing
- —
- Monthly P&I
- —
- Monthly cashflow
- —
- DSCR
- —
- Eligible?
- —
Short-term bridge; refi at stabilization.
Rent comps 40 comps
| Address | Beds | Baths | Sqft | Rent | $/sqft | DOM | Units | Dist |
|---|---|---|---|---|---|---|---|---|
| 3777 S Gessner Rd Unit 1801 WD Houston, TX | 2.0 | 1.0 | 876 | $1,140 | $1.30 | 43d | 1 | 0.48mi |
| 3777 S Gessner Rd Unit 1811 WD Houston, TX | 2.0 | 1.0 | 876 | $1,140 | $1.30 | 7d | 1 | 0.48mi |
| 3777 S Gessner Rd Unit 0315** WD Houston, TX | 2.0 | 1.0 | 876 | $1,240 | $1.42 | 43d | 1 | 0.48mi |
| 9515 Meadowglen Ln Unit 1019618P Houston, TX | 4.0 | 2.0 | 1603 | $14,846 | $9.26 | 21d | 1 | 0.54mi |
| 8100 Sands Point Dr Houston, TX | 1.0–3.0 | 1.0–2.0 | 953 | $1,684 | $1.77 | 1d | 29 | 0.70mi |
| 9707 Richmond Ave Houston, TX | 1.0–2.0 | 1.0–2.0 | 1000 | $2,250 | $2.25 | 43d | 4 | 0.75mi |
| 3230 S Gessner Rd Houston, TX | 1.0–2.0 | 1.0 | 710 | $1,099 | $1.55 | 24d | 9 | 0.75mi |
| 9850 Richmond Ave Houston, TX | 1.0–2.0 | 1.0–2.0 | 898 | $1,619 | $1.80 | 5d | 9 | 0.77mi |
| 5810 Fondren Rd Houston, TX | 1.0–3.0 | 1.0–2.0 | 1000 | $1,450 | $1.45 | 15d | 1 | 0.77mi |
| 2748 Jeanetta St Houston, TX | 2.0 | 2.0 | 1035 | $1,489 | $1.44 | 43d | 1 | 0.78mi |
| 9411 Westheimer Rd Unit 9468 Houston, TX | 2.0 | 2.0 | 1050 | $1,343 | $1.28 | 10d | 1 | 0.81mi |
| 9411 Westheimer Rd Unit 423 Houston, TX | 2.0 | 2.0 | 1050 | $1,014 | $0.97 | 13d | 1 | 0.81mi |
| 9411 Westheimer Rd Unit 2165 Houston, TX | 2.0 | 2.0 | 1050 | $1,311 | $1.25 | 2d | 1 | 0.81mi |
| 9233 Westheimer Rd Unit 9290 Houston, TX | 2.0 | 2.0 | 1099 | $1,614 | $1.47 | 43d | 1 | 0.82mi |
| 9233 Westheimer Rd Unit 2174 Houston, TX | 2.0 | 2.0 | 1099 | $1,589 | $1.45 | 15d | 1 | 0.82mi |
| 9233 Westheimer Rd Houston, TX | 2.0 | 1.0–2.0 | 964 | $1,754 | $1.82 | 2d | 10 | 0.82mi |
| 3098 Crossview Dr Houston, TX | 2.0 | 2.0 | 1255 | $1,510 | $1.20 | 24d | 1 | 0.83mi |
| 7637 Harwin Dr Houston, TX | 1.0–2.0 | 1.0 | 908 | $1,119 | $1.23 | 1d | 12 | 0.85mi |
| 2691 Westerland Dr Houston, TX | 2.0 | 2.0 | 1196 | $1,660 | $1.39 | 11d | 1 | 0.86mi |
| 2900 S Gessner Rd Unit 2047 Houston, TX | 2.0 | 2.0 | 1076 | $947 | $0.88 | 2d | 1 | 0.90mi |
| 9106 Westheimer Rd Houston, TX | 2.0 | 2.0 | 1129 | $1,584 | $1.40 | 43d | 1 | 0.91mi |
| 10070 Westpark Dr Houston, TX | 1.0–2.0 | 1.0–2.0 | 720 | $1,199 | $1.67 | 1d | 18 | 0.92mi |
| 2600 Westerland Dr Unit 2047 Houston, TX | 2.0 | 2.0 | 996 | $1,213 | $1.22 | 2d | 1 | 0.93mi |
| 2900 S Gessner Rd Unit 2162 Houston, TX | 2.0 | 2.0 | 1076 | $955 | $0.89 | 7d | 1 | 0.96mi |
| 2600 Westerland Dr Unit 2162 Houston, TX | 2.0 | 2.0 | 996 | $1,189 | $1.19 | 5d | 1 | 0.96mi |
| 2600 Westerland Dr Unit 2657 Houston, TX | 2.0 | 2.0 | 996 | $1,181 | $1.19 | 2d | 1 | 0.96mi |
| 2600 Westerland Dr Unit 422 Houston, TX | 2.0 | 2.0 | 996 | $1,189 | $1.19 | 7d | 1 | 0.96mi |
| 9100 Westheimer Rd Unit 2187 Houston, TX | 2.0 | 2.0 | 1129 | $1,387 | $1.23 | 2d | 1 | 0.96mi |
| 9100 Westheimer Rd Unit 424 Houston, TX | 2.0 | 2.0 | 1129 | $1,395 | $1.24 | 5d | 1 | 0.96mi |
| 9100 Westheimer Rd Unit 9157 Houston, TX | 2.0 | 2.0 | 1129 | $1,364 | $1.21 | 13d | 1 | 0.96mi |
| 9100 Westheimer Rd Ste 422 Houston, TX | 2.0 | 2.0 | 1129 | $1,395 | $1.24 | 7d | 1 | 0.96mi |
| 9100 Westheimer Rd Unit 9133 Houston, TX | 3.0 | 2.0 | 1424 | $1,744 | $1.22 | 10d | 1 | 0.96mi |
| 9100 Westheimer Rd Unit 3187 Houston, TX | 3.0 | 2.0 | 1424 | $1,712 | $1.20 | 2d | 1 | 0.96mi |
| 9100 Westheimer Rd Unit 9137 Houston, TX | 2.0 | 2.0 | 1129 | $1,430 | $1.27 | 4d | 1 | 0.96mi |
| 8707 Town Park Dr Unit 3282 Houston, TX | 2.0 | 2.0 | 975 | $1,070 | $1.10 | 43d | 1 | 0.96mi |
| 8707 Town Park Dr Unit 3282 Houston, TX | 2.0 | 2.0 | 975 | $1,070 | $1.10 | 16d | 1 | 0.96mi |
| 3400 Woodchase Dr Houston, TX | 1.0–2.0 | 1.0–2.0 | 797 | $1,134 | $1.42 | 1d | 28 | 1.00mi |
| 10100 Westpark Dr Houston, TX | 1.0–2.0 | 1.0–2.0 | 891 | $1,299 | $1.46 | 16d | 21 | 1.00mi |
| 3030 Elmside Dr Houston, TX | 1.0–3.0 | 1.0–2.0 | 985 | $1,549 | $1.57 | 1d | 23 | 1.00mi |
| 9940 Richmond Ave Houston, TX | 2.0 | 2.0 | 1262 | $1,710 | $1.35 | 12d | 1 | 1.00mi |
HOA detail condo
- Monthly dues
- $0 · $0/yr
- Assessments
- None detected in remarks — confirm with the listing agent.
Listing history 20 events
-
2026-06-18days on market $149,000 Active 36 DOM
-
2026-06-17days on market $149,000 Active 35 DOM
-
2026-06-16days on market $149,000 Active 34 DOM
-
2026-06-15days on market $149,000 Active 33 DOM
-
2026-06-13days on market $149,000 Active 31 DOM
-
2026-06-10days on market $149,000 Active 27 DOM
-
2026-06-08days on market $149,000 Active 26 DOM
-
2026-06-07days on market $149,000 Active 25 DOM
-
2026-06-04days on market $149,000 Active 22 DOM
-
2026-06-01days on market $149,000 Active 19 DOM
-
2026-05-31days on market $149,000 Active 18 DOM
-
2026-05-14$149,000 Active 2176-char remark
-
2017-07-12soldstatus
-
2015-04-25historical
-
2015-03-05$84,000 Active
-
2011-01-10historical
-
2010-10-20$65,000
-
2008-02-21soldstatus
-
2005-04-27soldstatus
-
2002-11-25soldstatus
ⓘ Source: listings_history table (triggers on properties + properties_extension) + one-shot
backfill from property_details.listing_events for pre-trigger history.
Tax reassessment forecast TX · Resets to sale price
- Current annual tax
- $2,460 · $205/mo
- Projected year-2 tax
- $2,727 · $227/mo
- Expected delta
- +$267/yr (+$22/mo · 10.9%)
ⓘ Screening estimate from a state-policy table — verify with the county assessor before closing.
Climate risk First Street
- Flood 8/10 Severe FEMA zone X (unshaded) · 99% chance over 30 yrs
- Wildfire 1/10 Low
- Heat 9/10 Extreme 7 d/yr ≥110°F today · 23 d/yr by 30 yrs out
- Wind 9/10 Extreme 99% chance of damaging wind over 30 yrs
- Air quality 2/10 Low 2 unhealthy d/yr today · 2 by 30 yrs out
Nearby sold comps map
Loading sold comps map…
Walkable amenities ~0.75 mi
Loading nearby amenities…
Taxation est. · year 1
- Rental income
- $17,201
- − Mortgage interest
- −$8,346
- − Property taxes
- −$2,460
- − Insurance
- −$1,542
- − Repairs & maintenance
- −$1,376
- − Management
- −$1,376
- − HOA
- −$7,560
- − Depreciation
- −$4,335
- Taxable loss
- −$9,795
- Est. tax savings @ 24.0%
- +$2,351
- After-tax cash flow
- $-5,000/yr
For passive investors: Depreciation is non-cash, so a rental often shows a tax loss while cash-flowing — sheltering income. Rental losses are passive: they offset passive income freely, and up to $25,000/yr can offset ordinary (W-2) income if you actively participate and your MAGI is under $100k (phasing out to $0 by $150k); unused losses carry forward. On sale, claimed depreciation is recaptured at up to 25%, and gains may owe capital-gains tax (a 1031 exchange can defer both). Figures are a year-1 estimate at your 24.0% rate — not tax advice; consult a CPA.
Schools (NCES district)
- District
- Houston ISD
- NCES district ID
- 4823640
- Math proficiency
- 27% ▼ -18.00%
- Reading proficiency
- 35% ▼ -6.00%
- Median HH income
- $46,054
- Composite
- 26.63/100
- National rank
- #7173
- State rank
- #593 of 826 in TX
Livability — Houston
- Score
- 74/100
- State rank
- #184
- US rank
- #4771
Category grades
Schools grade is shown separately in the Schools card above.
Census & demographics
- Census place
- Houston, TX
- County
- Harris County · 4,702,590 people
- City population
- 3,226,434
- Metro
- Houston-The Woodlands-Sugar Land, TX
- Population (ZIP)
- 42,690
- Household income
- $59,113
- Rent vs Own
- Severe rent burden
- 3541.0
Population outlook (Harris County) Hauer SSP2
- Today (2025)
- 5,571,493 people
- By 2030
- 6,089,821 · +9.3%
- By 2040
- 7,142,806 · +28.2%
- By 2050
- 8,185,864 · +46.9%
- By 2075
- 10,574,329 · +89.8%
- By 2100
- 12,109,958 · +117.4%
Race, ethnicity, and origin ACS 2023
- Neighborhood character
- Highly diverse neighborhood (Simpson 0.75)
- Race & ethnicity
- Hispanic / Latino 33% White 29% Black 21% Two or more races 17% Asian 13%
- Hispanic origin (detail)
- Mexican 13% Cuban 4%
- Common ancestry
- Lithuanian 1% Arab 1% Slovak 1%
- Foreign-born
- 43% · Canada, Jamaica, Vietnam
- Languages at home
- 48% English-only · Spanish 30% Other Indo-European 8% Other Asian/Pacific 3%
Political lean MEDSL · Harris
- 2024 margin
- Lean D (+5.5) · D 52.0% · R 46.4% · Other 1.6%
- 2008→2024 swing
- +3.9pp toward D · 2008: 1.6pp · 2024: 5.5pp
- All cycles
- 2024: D+5.5 2020: D+13.3 2016: D+12.4 2012: D+0.1 2008: D+1.6
Not yet ingested
- Civics
- —
Market trends
- HPI YoY
- ▼ -241.42%
- Current HPI
- 194.3803
- Rent YoY
- ▼ -6.28%
- Metro
- Houston-The Woodlands-Sugar Land, TX
- State GDP YoY
- ▲ 3.95%
- F500 in state
- 110
Industry mix (Fortune 500 HQ in TX)
| Industry | F500 HQs | Revenue |
|---|---|---|
| Energy | 16 | $1,198B |
|
||
| Technology | 5 | $198B |
|
||
| Engineering / Construction | 4 | $72B |
|
||
| Energy Services | 3 | $60B |
|
||
| Utilities | 3 | $41B |
|
||
| Healthcare | 2 | $330B |
|
||
Price history
+129.2% since first listed9 events — show timeline
- 2026-05-14 Listed $149,000 FSBO.com
- 2017-07-12 Sold (Public Records) — Public Records
- 2015-04-25 Listing Removed — HARMLS
- 2015-03-05 Listed $84,000 HARMLS
- 2011-01-10 Listing Removed — HARMLS
- 2010-10-20 Listed $65,000 HARMLS
- 2008-02-21 Sold (Public Records) — Public Records
- 2005-04-27 Sold (Public Records) — Public Records
- 2002-11-25 Sold (Public Records) — Public Records
Property tax history
+1.7%/yrLatest (2025): $2,460 · -7.7% YoY. Source: county tax records.
Cash-flow waterfall
monthlySold comps — $/sqft
last 12 mo · ≤1 miLoading sold comps…