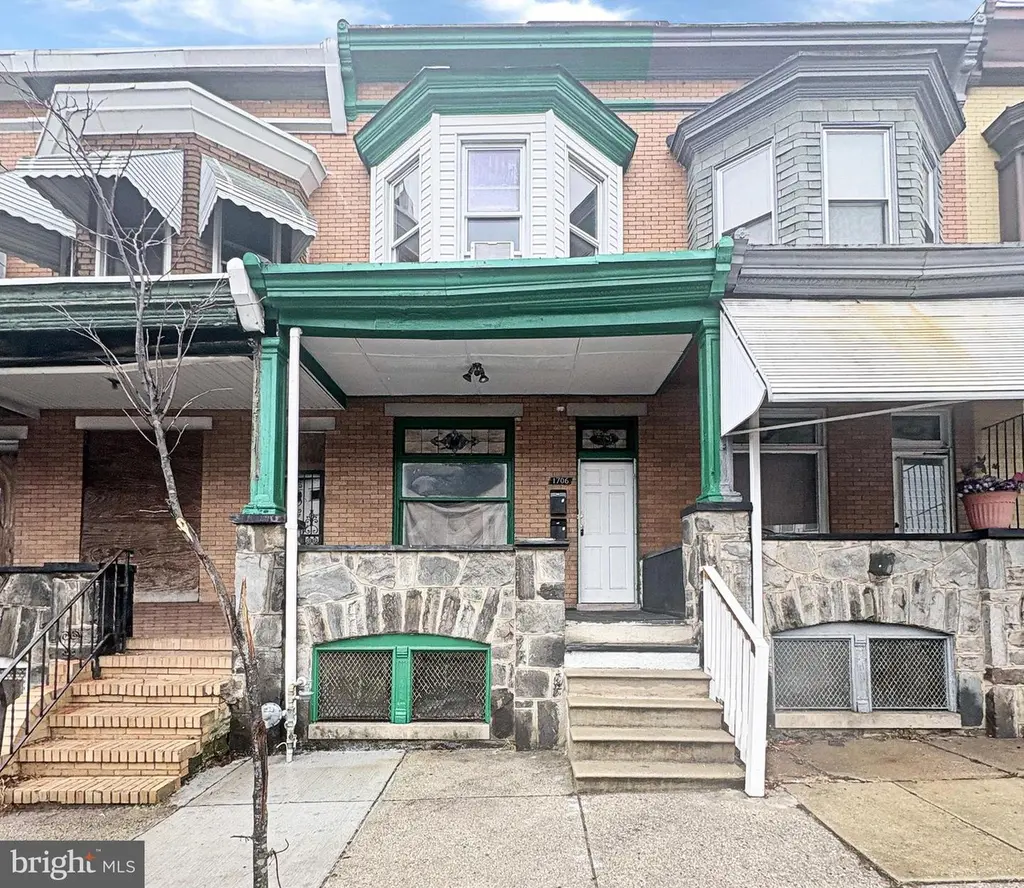
1706 N Bentalou St · Baltimore, MD
Flood risk 1/10 · Minimal
- FEMA flood zone
- X (unshaded)
- Chance of flooding over 30 yrs
- 0.0%
- Est. flood insurance / yr
- $473 – $860
Fire risk 1/10 · Minimal
- Est. fire insurance / yr
- $755 – $1,403
Heat risk 7/10 · Major
- Hot days now (above 103°F)
- 7 days/yr
- Hot days in 30 yrs
- 15 days/yr
Wind risk 6/10 · Moderate
- Chance of severe wind over 30 yrs
- 27.0%
Air-quality risk 3/10 · Minor
- Unhealthy air days now
- 3 days/yr
- Unhealthy air days in 30 yrs
- 4 days/yr
Risk factors via First Street. Map © Google.
Why this score? — see what drove the B- grade
The composite is a weighted blend of 9 inputs, each scored 0–100. Each bar is that input's sub-score; the figure is the points it added to the 100-point composite (weight × sub-score).
- Cash flow +30.0/30.0
- DSCR +10.0/10.0
- 1% rule +8.7/10.0
- ARV discount +7.3/15.0
- Rent growth +4.0/5.0
- Livability +3.8/5.0
- Condition / age +2.5/5.0
- Schools +1.0/10.0
- Appreciation +0.0/10.0
$119,900
🖨 Deal sheet 📄 Offer letter ✓ Due diligence
Listing remarks MLS
Welcome to this 3-bedroom, 2-bathroom townhouse in the desirable Coppins Heights neighborhood. Built in 1920, this home exudes character with its classic brick exterior and inviting interior spaces. Venture inside to find spacious living spaces with laminated plank flooring that flows throughout the main and upper levels. The eat-in kitchen provides a cozy spot for casual meals, while the well-appointed bathrooms feature a convenient tub shower combination, ensuring relaxation after a long day. With three generous bedrooms, there's ample space for rest and rejuvenation. The full, unfinished basement offers endless possibilities-transform it into a recreation room, home gym, or additional storage space. Enjoy the outdoors on your porch or patio, perfect for morning coffee or evening relaxation. The rear yard provides a private retreat for gardening or outdoor activities. Located on a quiet street with sidewalks and streetlights, this home is not only inviting but also conveniently situated for easy access to local amenities. Don't miss this wonderful opportunity! Schedule a showing today!
Key facts
- Eat-in kitchen
- Porch or patio
- Built 1920
Tags
Neighborhood map
What this means for you Summary
Snapshot
- This is a 3-bed/2.0-bath townhouse listed at $120k.
Deal economics
- At list price, monthly cash flow is $519 ($6k/yr) — positive.
- The deal already cash-flows at list — no discount required.
- Meets the 1% rule at list price ($2k rent vs $120k).
- Recommended offer: $113k (6.0% below list) — sets the bar for market timing.
- Cap rate 11.5% vs local median 6.0% in Baltimore — top-decile yield for the area; either an underpriced asset or a hidden risk that comps aren't pricing in. Stress-test before assuming the spread holds.
Location & tenants
- Location reads 76/100 on livability (#90 in MD, #3,396 nationally) — a middle-class / working-renter tenant base. Strengths: amenities A+, commute A+, housing A+; Watch: schools D, crime F.
- Baltimore City Public Schools (urban): math 7% / reading 16% proficiency, ranked #24 of 24 in MD (top 100%) — low school quality limits family demand, transient renter base, plan for 1-2y turnover; 79% free/reduced lunch — lower-income household profile, screen leases tightly.
- Market conditions: Rents rising fast (+6.1%/yr); 252 active listings in the ZIP; 40 comparable units currently listed for rent nearby; rentals at typical pace (median 24d on market — plan ~3-4 weeks tenant-placement turnaround); lower-income renter base — watch delinquency; 1,273 units permitted in Baltimore city in 2024 (1,104 in 5+ unit buildings).
- At $1,640/mo this rent would consume 47% of the median local household income ($42k/yr) (locally 2264% of renters already pay >50% of income on rent) — very limited rent-growth headroom before tenants either downsize or default.
Forward outlook
- Local home prices are declining (-3.0%/yr); year-one equity from $829 of loan paydown is wiped out by about $4k of value loss. Plan a longer hold.
- Baltimore County population projected to shrink 4% by 2050 — rents likely to lag national; underwrite the cash flow, not the appreciation.
- At projected returns (-3.0% appreciation + 6.1% rent growth), your $34k cash investment doubles in ~6 years — after that, you're playing with house money.
Negotiation context
- It's been on market 70 days — a 6% lower offer ($113k) is reasonable based on typical stale-listing flexibility.
- 6 sale attempts since 31y ago; this cycle's ask has dropped $10k (8%) from the opening price — seller is motivated, your offer sets the floor, not the list.
- Current owner paid $36k; list at $120k implies a 238% gain — meaningful room to come down on a strong offer.
Risks & watch-outs
- Watch-outs: built in 1920 — expect roof / HVAC / electrical / plumbing capex.
- Climate carrying-cost: major wind risk, 27% chance of damaging wind over 30y; extreme-heat days projected 7→15/yr by 2055 (HVAC capex compounding) — expect insurance premiums to compound above CPI over the hold.
Questions for the listing agent
- It's been on market 70 days. Have you received any prior offers? Is the seller open to a 6% concession, seller financing, or rate buy-down credit?
- Built in 1920 — when were the roof, HVAC, electrical panel, plumbing, and water heater last replaced?
- Why hasn't it sold? Are there any deal-killer items the seller is aware of (foundation, flood, title, zoning, code violations)?
- Is there a deadline driving the sale (1031 exchange, divorce, estate, relocation)? That informs how much negotiation room exists.
- Schools are D-rated, which usually means shorter tenancies and higher turnover. Who's the typical renter profile here, and what's been the actual vacancy rate?
- Crime grade is F in this area — have there been break-ins, vandalism, or insurance claims at this property in the last 3 years? What carrier currently insures it and at what premium?
- What's the average days-on-market for RENTAL listings here right now (not sales)? A rising rental-DOM trend means longer vacancies and softer asking-rent achievability than the comps imply.
- What's the recent tenant-quality profile in this submarket — average credit score on applications, eviction rate, late-payment / NSF rate, and stable-employment percentage? A property-management company in the area should have these aggregated.
- How much new for-sale + rental construction is in the pipeline within 1–3 miles? Heavy new supply typically softens prices + rents 12–24 months out; constrained supply supports both.
Investment metrics
- 1% rule
- 1.37% ✓
- Cap rate
- 11.49%
- Cash-on-cash
- 18.55%
- DSCR
- 1.83
- GRM
- 6.1
CMA / ARV
- ARV (median comp)
- $119,436
- List price
- $119,900
- Delta
- 0.39%
- Verdict
- FAIR
- Comps
- 20 within 1.0 mi
Show comp detail 12 sales within ~0.75 mi
| Address | Dist | Beds/Ba | Sqft | Sold | Price | $/sf | Match |
|---|---|---|---|---|---|---|---|
| 1537 N Smallwood St | 0.16mi | 3/1.5 | 1,200 (0%) | 3mo | $56,000 | $47 | 88 |
| 1541 N Pulaski St | 0.21mi | 3/1.0 | 1,100 (-8%) | 3mo | $115,000 | $105 | 70 |
| 2305 Poplar Grove St | 0.74mi | 3/2.0 | 1,200 (0%) | 1mo | $118,000 | $98 | 64 |
| 2820 Woodbrook Ave | 0.61mi | 3/1.5 | 1,232 (+3%) | 2mo | $85,000 | $69 | 63 |
| 2727 Baker St | 0.43mi | 3/1.0 | 1,116 (-7%) | 3mo | $125,000 | $112 | 62 |
| 2818 Woodbrook Ave | 0.61mi | 3/1.0 | 1,232 (+3%) | 3mo | $45,500 | $37 | 60 |
| 1603 Clifton Ave | 0.54mi | 3/1.0 | 1,100 (-8%) | 2mo | $130,000 | $118 | 55 |
| 700 Cumberland St | 0.61mi | 4/2.0 (+1) | 1,280 (+7%) | 3mo | $107,800 | $84 | 53 |
| 2711 Riggs Ave | 0.68mi | 3/1.0 | 1,288 (+7%) | 2mo | $134,000 | $104 | 51 |
| 3004 Brighton St | 0.74mi | 3/1.0 | 1,288 (+7%) | 1mo | $44,000 | $34 | 49 |
| 2210 Ashburton St | 0.57mi | 2/1.0 (-1) | 1,024 (-15%) | 2mo | $90,000 | $88 | 38 |
| 2544 Calverton Heights Ave | 0.72mi | 4/1.0 (+1) | 1,324 (+10%) | 3mo | $75,000 | $57 | 38 |
Match score weights: distance 35% · size 25% · config 20% · recency 20%. Top-matched comps best support the ARV.
Projected returns pro-forma
-3.0% appreciation · 6.1% rent growth · sell at horizon
- IRR
- 13.6%
- Equity multiple
- 1.56×
- Total profit
- $18,892
- Equity at exit
- $17,877
- IRR
- 24.6%
- Equity multiple
- 3.44×
- Total profit
- $82,051
- Equity at exit
- $10,367
Cash invested: $33,572 (down + closing). Projections, not guarantees.
Landlord ↔ Tenant lean methodology
- Overall (CITY)
- 12 Strongly Tenant-Friendly
- State Maryland
- 27 Tenant-Leaning · D+14
- County
- — inherits STATE
- City Baltimore
- 12 Strongly Tenant-Friendly · D+58
ZIP-level market 21216
- Rents YoY
- 6.1%
- Active inventory
- 252
- Price-to-rent
- 6.1×
Monthly cashflow live
- Estimated rent
- $1,640 high interval (Pro) →
- Mortgage (P&I)
- −$629
- Tax from tax record
- −$98 /mo · $1,177/yr
- Insurance
- −$50
- HOA
- −$0
- Vacancy / Maint / Mgmt
- −$344
- Net cashflow
- $519
Break-even live
UW: 25.0% down · 7.5% · 30yr · 1.5% tax · 5.0% vac · 8.0% maint · 8.0% mgmt
Financing live
Cash to close
- Down payment
- $29,975
- Closing costs
- $3,597
- Reserves months
- —
- Total cash needed
- —
Loan-product check · same deal, 3 products live
Conventional
25% down · 7.5% · 30yr
- Down + closing
- —
- Monthly P&I
- —
- Monthly cashflow
- —
- DSCR
- —
- Eligible?
- —
Personal DTI + credit; lowest rate.
DSCR
20% down · 8.5% · 30yr
- Down + closing
- —
- Monthly P&I
- —
- Monthly cashflow
- —
- DSCR
- —
- Eligible?
- —
No personal income docs; deal must DSCR.
Hard money
10% down · 12.0% · 12mo
- Down + closing
- —
- Monthly P&I
- —
- Monthly cashflow
- —
- DSCR
- —
- Eligible?
- —
Short-term bridge; refi at stabilization.
Rent comps 40 comps
| Address | Beds | Baths | Sqft | Rent | $/sqft | DOM | Units | Dist |
|---|---|---|---|---|---|---|---|---|
| 1816 N Bentalou St Baltimore, MD | 3.0 | 2.0 | 1350 | $1,700 | $1.26 | 23d | 1 | 0.07mi |
| 1816 N Bentalou St Baltimore, MD | 3.0 | 2.0 | 1350 | $1,700 | $1.26 | 10d | 1 | 0.07mi |
| 1617-A Moreland Ave Unit 2nd Flr Baltimore, MD | 2.0 | 1.0 | 1500 | $1,400 | $0.93 | 43d | 1 | 0.10mi |
| 1617 Moreland Ave Baltimore, MD | 2.0 | 1.0 | 900 | $1,450 | $1.61 | 23d | 1 | 0.11mi |
| 2204 Clifton Ave Baltimore, MD | 3.0 | 1.0 | 1400 | $1,450 | $1.04 | 4d | 1 | 0.27mi |
| 1930 N Payson St Baltimore, MD | 2.0 | 2.0 | 980 | $1,500 | $1.53 | 23d | 1 | 0.28mi |
| 1722 N Monroe St Baltimore, MD | 3.0 | 1.5 | 1000 | $1,350 | $1.35 | 23d | 1 | 0.31mi |
| 1501 N Payson St Baltimore, MD | 3.0 | 1.0 | 1400 | $1,550 | $1.11 | 43d | 1 | 0.31mi |
| 2636 W North Ave Baltimore, MD | 2.0–3.0 | 1.0–2.0 | 975 | $1,475 | $1.51 | 4d | 1 | 0.38mi |
| 1729 N Fulton Ave Baltimore, MD | 3.0 | 2.0 | 1081 | $1,795 | $1.66 | 43d | 1 | 0.43mi |
| 1806 N Mount St Baltimore, MD | 3.0 | 3.0 | 1200 | $1,700 | $1.42 | 20d | 1 | 0.48mi |
| 1433 N Fulton Ave Baltimore, MD | 2.0 | 1.0 | 1200 | $1,500 | $1.25 | 43d | 1 | 0.48mi |
| 2301 Riggs Ave Baltimore, MD | 3.0 | 2.0 | 1072 | $1,600 | $1.49 | 23d | 1 | 0.52mi |
| 1624 Westwood Ave Baltimore, MD | 3.0 | 2.0 | 1000 | $1,900 | $1.90 | 43d | 1 | 0.52mi |
| 2636 Pennsylvania Ave Baltimore, MD | 1.0–2.0 | 1.0 | 846 | $956 | $1.13 | 23d | 4 | 0.56mi |
| 2614 Pennsylvania Ave Baltimore, MD | 1.0–3.0 | 1.0–2.0 | 982 | $1,141 | $1.16 | 4d | 4 | 0.56mi |
| 2800 Presstman St Baltimore, MD | 3.0 | 2.5 | 1460 | $1,799 | $1.23 | 23d | 1 | 0.57mi |
| 1614 N Calhoun St Baltimore, MD | 2.0 | 1.0 | 950 | $1,300 | $1.37 | 43d | 1 | 0.60mi |
| 918 N Bentalou St Baltimore, MD | 3.0 | 1.5 | 1485 | $1,750 | $1.18 | 43d | 1 | 0.62mi |
| 2231 Orem Ave Baltimore, MD | 3.0 | 1.5 | 1140 | $1,750 | $1.54 | 17d | 1 | 0.63mi |
| 1914 Mosher St Unit 1914 Baltimore, MD | 4.0 | 2.5 | 1200 | $1,700 | $1.42 | 43d | 1 | 0.64mi |
| 2728 Winchester St Baltimore, MD | 3.0 | 1.5 | 1260 | $1,800 | $1.43 | 3d | 1 | 0.64mi |
| 1534 N Stricker St Baltimore, MD | 2.0 | 1.5 | 900 | $1,475 | $1.64 | 14d | 1 | 0.64mi |
| 2505 Woodbrook Ave Baltimore, MD | 4.0 | 2.0 | 1256 | $1,745 | $1.39 | 2d | 1 | 0.65mi |
| 2301 Whittier Ave Unit 3 Baltimore, MD | 2.0 | 2.0 | 1104 | $1,650 | $1.49 | 43d | 1 | 0.66mi |
| 2301 Whittier Ave Unit 2 Baltimore, MD | 2.0 | 2.0 | 1104 | $1,400 | $1.27 | 43d | 1 | 0.66mi |
| 2301 Whittier Ave Unit 1 Baltimore, MD | 2.0 | 1.0 | 1104 | $1,400 | $1.27 | 43d | 1 | 0.66mi |
| 1562 N Woodyear St Baltimore, MD | 2.0 | 1.5 | 788 | $1,325 | $1.68 | 23d | 1 | 0.67mi |
| 1515 Retreat St Baltimore, MD | 3.0 | 2.0 | 1098 | $1,800 | $1.64 | 23d | 1 | 0.68mi |
| 1507 Retreat St Unit 1 Baltimore, MD | 3.0 | 3.0 | 1098 | $2,500 | $2.28 | 43d | 1 | 0.71mi |
| 3401 Woodbrook Ave Unit 1 Baltimore, MD | 3.0 | 1.0 | 900 | $1,199 | $1.33 | 23d | 1 | 0.71mi |
| 2303 Calverton Heights Ave Baltimore, MD | 4.0 | 2.0 | 1314 | $2,250 | $1.71 | 23d | 1 | 0.72mi |
| 2601 Fairview Ave Baltimore, MD | 2.0 | 1.0 | 700 | $1,099 | $1.57 | 43d | 1 | 0.73mi |
| 2806 Riggs Ave Baltimore, MD | 3.0 | 2.5 | 1412 | $1,900 | $1.35 | 3d | 1 | 0.74mi |
| 519 Sanford Pl Baltimore, MD | 3.0 | 1.0 | 1300 | $1,650 | $1.27 | 16d | 1 | 0.74mi |
| 3003 W North Ave Baltimore, MD | 1.0–2.0 | 1.0 | 841 | $935 | $1.11 | 2d | 3 | 0.74mi |
| 2330 Bryant Ave Unit 4 Baltimore, MD | 2.0 | 1.0 | 950 | $1,500 | $1.58 | 20d | 1 | 0.74mi |
| 2744 W Mosher St Baltimore, MD | 4.0 | 2.0 | 1412 | $2,100 | $1.49 | 23d | 1 | 0.76mi |
| 1606 Gwynns Falls Pkwy Baltimore, MD | 2.0 | 1.0 | 748 | $1,200 | $1.60 | 23d | 1 | 0.76mi |
| 2409 Francis St Baltimore, MD | 3.0 | 1.0 | 1298 | $1,500 | $1.16 | 43d | 1 | 0.77mi |
Listing history 32 events
-
2026-06-18days on market $119,900 Active 70 DOM
-
2026-06-17days on market $119,900 Active 69 DOM
-
2026-06-16days on market $119,900 Active 68 DOM
-
2026-06-15days on market $119,900 Active 67 DOM
-
2026-06-13days on market $119,900 Active 65 DOM
-
2026-06-09days on market $119,900 Active 61 DOM
-
2026-06-08days on market $119,900 Active 60 DOM
-
2026-06-07days on market $119,900 Active 59 DOM
-
2026-06-04days on market $119,900 Active 56 DOM
-
2026-06-03days on market $119,900 Active 55 DOM
-
2026-06-02days on market $119,900 Active 54 DOM
-
2026-06-01days on market $119,900 Active 53 DOM
-
2026-05-31days on market $119,900 Active 52 DOM
-
2026-05-12price $119,900 1104-char remark
Show marketing remark (1104 chars)
Welcome to this 3-bedroom, 2-bathroom townhouse in the desirable Coppins Heights neighborhood. Built in 1920, this home exudes character with its classic brick exterior and inviting interior spaces. Venture inside to find spacious living spaces with laminated plank flooring that flows throughout the main and upper levels. The eat-in kitchen provides a cozy spot for casual meals, while the well-appointed bathrooms feature a convenient tub shower combination, ensuring relaxation after a long day. With three generous bedrooms, there's ample space for rest and rejuvenation. The full, unfinished basement offers endless possibilities-transform it into a recreation room, home gym, or additional storage space. Enjoy the outdoors on your porch or patio, perfect for morning coffee or evening relaxation. The rear yard provides a private retreat for gardening or outdoor activities. Located on a quiet street with sidewalks and streetlights, this home is not only inviting but also conveniently situated for easy access to local amenities. Don't miss this wonderful opportunity! Schedule a showing today!
-
2026-04-09$129,900 Active 1104-char remark
Show marketing remark (1104 chars)
Welcome to this 3-bedroom, 2-bathroom townhouse in the desirable Coppins Heights neighborhood. Built in 1920, this home exudes character with its classic brick exterior and inviting interior spaces. Venture inside to find spacious living spaces with laminated plank flooring that flows throughout the main and upper levels. The eat-in kitchen provides a cozy spot for casual meals, while the well-appointed bathrooms feature a convenient tub shower combination, ensuring relaxation after a long day. With three generous bedrooms, there's ample space for rest and rejuvenation. The full, unfinished basement offers endless possibilities-transform it into a recreation room, home gym, or additional storage space. Enjoy the outdoors on your porch or patio, perfect for morning coffee or evening relaxation. The rear yard provides a private retreat for gardening or outdoor activities. Located on a quiet street with sidewalks and streetlights, this home is not only inviting but also conveniently situated for easy access to local amenities. Don't miss this wonderful opportunity! Schedule a showing today!
-
2026-01-26historical
-
2025-12-09price $125,000
-
2025-11-13$160,000 Active
-
2025-11-11historical
-
2009-06-13historical
-
2009-06-12historical
-
2008-11-16
-
2008-11-16$80,000
-
2004-02-23soldstatus $35,500
-
2004-02-17soldstatus $35,500
-
2003-12-16$35,500
-
2003-12-16historical
-
1996-09-11soldstatus $19,000
-
1995-12-26soldstatus $14,000
-
1995-12-06soldstatus $14,000
-
1995-10-26historical
-
1995-10-25$49,900
ⓘ Source: listings_history table (triggers on properties + properties_extension) + one-shot
backfill from property_details.listing_events for pre-trigger history.
Tax reassessment forecast MD · Partial reset (capped growth)
- Current annual tax
- $1,177 · $98/mo
- Projected year-2 tax
- $1,242 · $103/mo
- Expected delta
- +$65/yr (+$5/mo · 5.5%)
ⓘ Screening estimate from a state-policy table — verify with the county assessor before closing.
Climate risk First Street
- Flood 1/10 Low FEMA zone X (unshaded) · 0% chance over 30 yrs
- Wildfire 1/10 Low
- Heat 7/10 Severe 7 d/yr ≥103°F today · 15 d/yr by 30 yrs out
- Wind 6/10 Major 27% chance of damaging wind over 30 yrs
- Air quality 3/10 Moderate 3 unhealthy d/yr today · 4 by 30 yrs out
Nearby sold comps map
Loading sold comps map…
Walkable amenities ~0.75 mi
Loading nearby amenities…
Taxation est. · year 1
- Rental income
- $19,682
- − Mortgage interest
- −$6,716
- − Property taxes
- −$1,177
- − Insurance
- −$600
- − Repairs & maintenance
- −$1,575
- − Management
- −$1,575
- − Depreciation
- −$3,488
- Taxable income
- $4,553
- Est. tax owed @ 24.0%
- −$1,093
- After-tax cash flow
- $5,135/yr
For passive investors: Depreciation is non-cash, so a rental often shows a tax loss while cash-flowing — sheltering income. Rental losses are passive: they offset passive income freely, and up to $25,000/yr can offset ordinary (W-2) income if you actively participate and your MAGI is under $100k (phasing out to $0 by $150k); unused losses carry forward. On sale, claimed depreciation is recaptured at up to 25%, and gains may owe capital-gains tax (a 1031 exchange can defer both). Figures are a year-1 estimate at your 24.0% rate — not tax advice; consult a CPA.
Schools (NCES district)
- District
- Baltimore City Public Schools
- NCES district ID
- 2400090
- Math proficiency
- 7% ▼ -9.00%
- Reading proficiency
- 16% ▼ -5.00%
- Median HH income
- $42,108
- Composite
- 10.08/100
- National rank
- #9805
- State rank
- #24 of 24 in MD
Livability — Baltimore
- Score
- 76/100
- State rank
- #90
- US rank
- #3396
Category grades
Schools grade is shown separately in the Schools card above.
Census & demographics
- Census place
- Baltimore, MD
- County
- Baltimore City · 558,601 people
- City population
- 588,727
- Metro
- Baltimore-Columbia-Towson, MD
- Population (ZIP)
- 29,426
- Household income
- $42,031
- Rent vs Own
- Severe rent burden
- 2264.0
Population outlook (Baltimore County) Hauer SSP2
- Today (2025)
- 624,249 people
- By 2030
- 621,541 · -0.4%
- By 2040
- 609,756 · -2.3%
- By 2050
- 597,249 · -4.3%
- By 2075
- 552,236 · -11.5%
- By 2100
- 513,934 · -17.7%
Race, ethnicity, and origin ACS 2023
- Neighborhood character
- Predominantly Black (91%)
- Race & ethnicity
- Black 91% Hispanic / Latino 4% Two or more races 3% White 2%
- Foreign-born
- 3% · Canada
- Languages at home
- 96% English-only · Spanish 3% French/Haitian/Cajun 1%
Political lean MEDSL · Baltimore
- 2024 margin
- Solid D (+73.0) · D 85.2% · R 12.2% · Other 2.6%
- 2008→2024 swing
- -2.5pp toward R · 2008: 75.5pp · 2024: 73.0pp
- All cycles
- 2024: D+73.0 2020: D+76.6 2016: D+74.6 2012: D+76.4 2008: D+75.5
Not yet ingested
- Civics
- —
Market trends
- HPI YoY
- ▼ -107.42%
- Current HPI
- 164.3933
- Rent YoY
- ▲ 6.10%
- Metro
- Baltimore-Columbia-Towson, MD
- State GDP YoY
- ▲ 2.97%
- F500 in state
- 12
Industry mix (Fortune 500 HQ in MD)
| Industry | F500 HQs | Revenue |
|---|---|---|
| Aerospace / Defense | 1 | $71B |
|
||
| Utilities | 1 | $25B |
|
||
| Hotels | 1 | $24B |
|
||
| Consumer Goods | 1 | $7B |
|
||
| Real Estate | 1 | $6B |
|
||
| Chemicals | 1 | $2B |
|
||
Price history
+140.3% since first listed19 events — show timeline
- 2026-05-12 Price Changed $119,900 BRIGHT MLS
- 2026-04-09 Listed $129,900 BRIGHT MLS
- 2026-01-26 Listing Removed — BRIGHT MLS
- 2025-12-09 Price Changed $125,000 BRIGHT MLS
- 2025-11-13 Listed $160,000 BRIGHT MLS
- 2025-11-11 Coming Soon — BRIGHT MLS
- 2009-06-13 Delisted — MRIS
- 2009-06-12 Listing Removed — BRIGHT MLS
- 2008-11-16 Listed — MRIS
- 2008-11-16 Listed $80,000 BRIGHT MLS
- 2004-02-23 Sold (Public Records) $35,500 Public Records
- 2004-02-17 Sold (MLS) $35,500 MRIS
- 2003-12-16 Delisted — MRIS
- 2003-12-16 Listed $35,500 MRIS
- 1996-09-11 Sold (Public Records) $19,000 Public Records
- 1995-12-26 Sold (Public Records) $14,000 Public Records
- 1995-12-06 Sold (MLS) $14,000 MRIS
- 1995-10-26 Delisted — MRIS
- 1995-10-25 Listed $49,900 MRIS
Property tax history
+1.1%/yrLatest (2025): $1,177 · +5.7% YoY. Source: county tax records.
Cash-flow waterfall
monthlySold comps — $/sqft
last 12 mo · ≤1 miLoading sold comps…