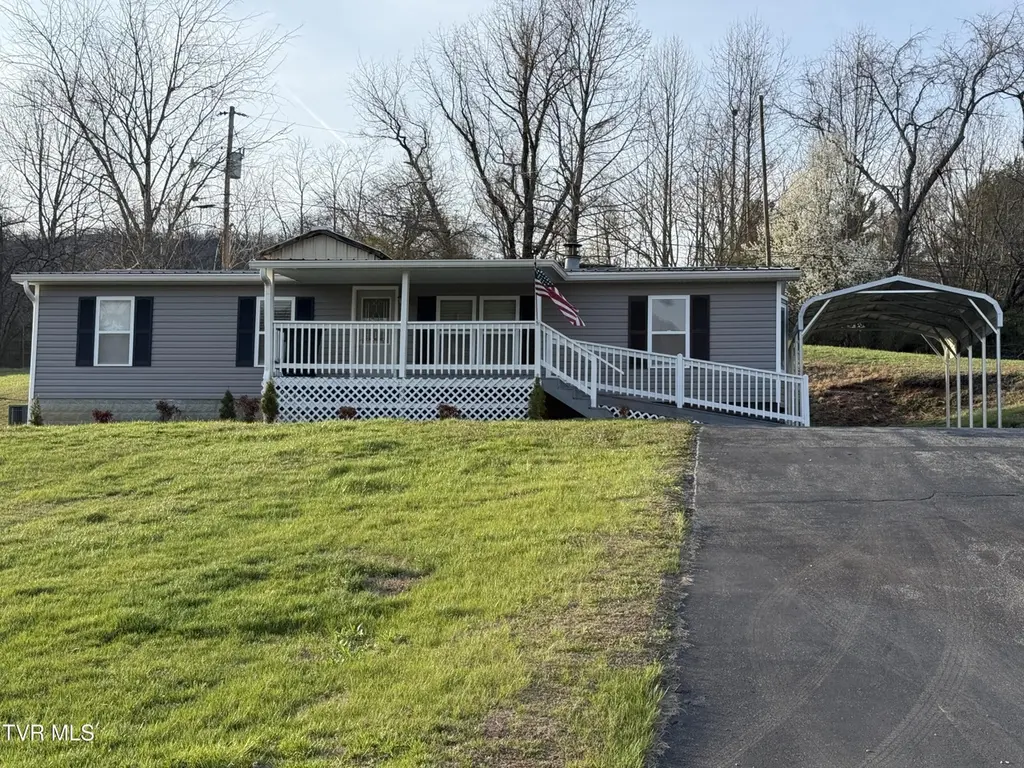
408 Pine St · Butler, TN
Flood risk 1/10 · Minimal
- FEMA flood zone
- X (unshaded)
- Chance of flooding over 30 yrs
- 0.0%
- Est. flood insurance / yr
- $473 – $860
Fire risk 5/10 · Moderate
- Est. fire insurance / yr
- $949 – $1,763
Heat risk 3/10 · Minor
- Hot days now (above 95°F)
- 8 days/yr
- Hot days in 30 yrs
- 22 days/yr
Wind risk 2/10 · Minimal
- Chance of severe wind over 30 yrs
- —
Air-quality risk 2/10 · Minimal
- Unhealthy air days now
- 0 days/yr
- Unhealthy air days in 30 yrs
- 1 days/yr
Risk factors via First Street. Map © Google.
Why this score? — see what drove the C+ grade
The composite is a weighted blend of 9 inputs, each scored 0–100. Each bar is that input's sub-score; the figure is the points it added to the 100-point composite (weight × sub-score).
- Cash flow +25.0/30.0
- DSCR +8.2/10.0
- ARV discount +7.5/15.0
- 1% rule +6.5/10.0
- Condition / age +3.8/5.0
- Appreciation +3.1/10.0
- Rent growth +2.5/5.0
- Livability +2.5/5.0
- Schools +2.4/10.0
$197,500
🖨 Deal sheet 📄 Offer letter ✓ Due diligence
Listing remarks
Located near beautiful Watauga Lake, this well-maintained property offers scenic mountain views in a desirable neighborhood. Featuring 3 bedrooms and 2 baths, the home includes a spacious kitchen, dining room, and an open living area highlighted by a stunning stone fireplace. Recent upgrades include new flooring and fresh paint throughout, as well as updated kitchen appliances, adding modern comfort and style. A utility room with a separate outside entrance adds convenience, while the front and back decks provide the perfect spaces to relax and enjoy the peaceful surroundings. The property also includes a two-story outbuilding and a detached carport, offering plenty of additional storage or
Key facts
- Fresh paint
- Spacious kitchen
- New flooring
Tags
Property features AI
Finance
- Other: Lot dimensions approximately 85 x 201 (irregular); Zoning: None; Subdivision: Carterview Sub
- HOA & community: Association provides landscaping
Exterior
- Parking: Carport with 2 spaces; Asphalt parking
- Utilities: Public water; Septic tank sewer
- Home design: Manufactured house (double wide); One level; Residential single family
- Construction: Vinyl siding; Metal roof
- Exterior features: Covered patio/porch; Deck; Front porch; Storm doors; Metal roof; Outbuilding, shed(s) and storage; Sloped topography; Property has a view
Interior
- Kitchen: Range; Microwave; Refrigerator
- Flooring: Hardwood flooring; Vinyl flooring
- Bathrooms: 2 full bathrooms
- Heating & cooling: Heat pump heating; Heat pump cooling
- Interior features: Laminate counters; Fireplace in the living room; Total of 8 rooms
- Laundry & utility: Washer hookup; Electric dryer hookup; Washer; Dryer
Neighborhood map
What this means for you Summary
Snapshot
- This is a 3-bed/2.0-bath single-family listed at $198k. Condition is rated good.
Deal economics
- At list price, monthly cash flow is $432 ($5k/yr) — positive.
- The deal already cash-flows at list — no discount required.
- Meets the 1% rule at list price ($2k rent vs $198k).
- Recommended offer: $186k (6.0% below list) — sets the bar for market timing.
- Cap rate 8.9% vs local median 1.7% in Butler — top-decile yield for the area; either an underpriced asset or a hidden risk that comps aren't pricing in. Stress-test before assuming the spread holds.
Location & tenants
- Location reads: area grade C — affects rentability + tenant quality, not the cash-flow math above.
- Johnson County (rural): math 27% / reading 31% proficiency, ranked #69 of 139 in TN (top 50%) — low school quality limits family demand, transient renter base, plan for 1-2y turnover.
- Zoned schools: Doe Elementary (math 37% / reading 32%, grade F, #319 of 952 statewide, top 37%, 217 students, 0% FRL); Johnson Co Middle School (math 28% / reading 31%, grade F, #107 of 333 statewide, top 33%, 284 students, 0% FRL); Johnson Co High School (math 17% / reading 32%, grade F, #129 of 332 statewide, top 43%, 643 students, 0% FRL) — zoned schools average 0% FRL vs 59% district-wide (59 pts lower); this property's tenant base skews higher-income than the district average.
- Market conditions: 207 active listings in the ZIP; 6 units permitted in Johnson County in 2024 (0 in 5+ unit buildings).
Forward outlook
- Local home prices are declining (-3.0%/yr); year-one equity from $1k of loan paydown is wiped out by about $6k of value loss. Plan a longer hold.
- Johnson County population projected at -21% by 2050 — secular population decline; favor cash flow + early exit over multi-decade hold.
Negotiation context
- It's been on market 88 days — a 6% lower offer ($186k) is reasonable based on typical stale-listing flexibility.
- 2 sale attempts with the ask held roughly flat each time — persistent listings suggest the price (not the market) is what's stuck; bring a comps-based counter.
Risks & watch-outs
- Climate carrying-cost: moderate wildfire risk — expect insurance premiums to compound above CPI over the hold.
Questions for the listing agent
- It's been on market 88 days. Have you received any prior offers? Is the seller open to a 6% concession, seller financing, or rate buy-down credit?
- Why hasn't it sold? Are there any deal-killer items the seller is aware of (foundation, flood, title, zoning, code violations)?
- Is there a deadline driving the sale (1031 exchange, divorce, estate, relocation)? That informs how much negotiation room exists.
- What's the average days-on-market for RENTAL listings here right now (not sales)? A rising rental-DOM trend means longer vacancies and softer asking-rent achievability than the comps imply.
- What's the recent tenant-quality profile in this submarket — average credit score on applications, eviction rate, late-payment / NSF rate, and stable-employment percentage? A property-management company in the area should have these aggregated.
- How much new for-sale + rental construction is in the pipeline within 1–3 miles? Heavy new supply typically softens prices + rents 12–24 months out; constrained supply supports both.
Investment metrics
- 1% rule
- 1.15% ✓
- Cap rate
- 8.91%
- Cash-on-cash
- 9.36%
- DSCR
- 1.42
- GRM
- 7.2
CMA / ARV
- ARV (on-the-fly)
- $627,840
- Comps found
- 2
Show comp detail 2 sales within ~0.75 mi
| Address | Dist | Beds/Ba | Sqft | Sold | Price | $/sf | Match |
|---|---|---|---|---|---|---|---|
| 460 Piercetown Rd | 0.11mi | 3/1.0 | 1,136 (-1%) | 12mo | $332,500 | $293 | 78 |
| 889 Piercetown Rd | 0.57mi | 3/2.0 | 1,100 (-4%) | 2mo | $600,000 | $545 | 64 |
Match score weights: distance 35% · size 25% · config 20% · recency 20%. Top-matched comps best support the ARV.
Projected returns pro-forma
-3.0% appreciation · 3.0% rent growth · sell at horizon
- IRR
- -2.1%
- Equity multiple
- 0.92×
- Total profit
- $-4,485
- Equity at exit
- $29,448
- IRR
- 7.6%
- Equity multiple
- 1.57×
- Total profit
- $31,625
- Equity at exit
- $17,076
Cash invested: $55,300 (down + closing). Projections, not guarantees.
Landlord ↔ Tenant lean methodology
- Overall (STATE)
- 87 Strongly Landlord-Friendly
- State Tennessee
- 87 Strongly Landlord-Friendly · R+13
- County
- — inherits STATE
- City
- — inherits STATE
ZIP-level market 37640
- Home prices YoY
- -1.0%
- Active inventory
- 207
- Price-to-rent
- 7.2×
Monthly cashflow live
- Estimated rent
- $2,274 medium interval (Pro) →
- Mortgage (P&I)
- −$1,036
- Tax est. 1.5%
- −$247 /mo · $2,962/yr
- Insurance
- −$82
- HOA
- −$0
- Vacancy / Maint / Mgmt
- −$478
- Net cashflow
- $432
Break-even live
UW: 25.0% down · 7.5% · 30yr · 1.5% tax · 5.0% vac · 8.0% maint · 8.0% mgmt
Financing live
Cash to close
- Down payment
- $49,375
- Closing costs
- $5,925
- Reserves months
- —
- Total cash needed
- —
Loan-product check · same deal, 3 products live
Conventional
25% down · 7.5% · 30yr
- Down + closing
- —
- Monthly P&I
- —
- Monthly cashflow
- —
- DSCR
- —
- Eligible?
- —
Personal DTI + credit; lowest rate.
DSCR
20% down · 8.5% · 30yr
- Down + closing
- —
- Monthly P&I
- —
- Monthly cashflow
- —
- DSCR
- —
- Eligible?
- —
No personal income docs; deal must DSCR.
Hard money
10% down · 12.0% · 12mo
- Down + closing
- —
- Monthly P&I
- —
- Monthly cashflow
- —
- DSCR
- —
- Eligible?
- —
Short-term bridge; refi at stabilization.
Listing history 18 events
-
2026-06-19days on market $197,500 Active 88 DOM
-
2026-06-18days on market $197,500 Active 87 DOM
-
2026-06-17days on market $197,500 Active 86 DOM
-
2026-06-16days on market $197,500 Active 85 DOM
-
2026-06-15days on market $197,500 Active 84 DOM
-
2026-06-14statusdays on market $197,500 Active 82 DOM
-
2026-06-13days on market $197,500 Active Under Contract 81 DOM
-
2026-06-10days on market $197,500 Active Under Contract 79 DOM
-
2026-06-09days on market $197,500 Active Under Contract 78 DOM
-
2026-06-08statusdays on market $197,500 Active Under Contract 77 DOM
-
2026-06-07days on market $197,500 Active 76 DOM
-
2026-06-02days on market $197,500 Active 71 DOM
-
2026-06-01days on market $197,500 Active 70 DOM
-
2026-05-31days on market $197,500 Active 69 DOM
-
2026-05-30days on market $197,500 Active 68 DOM
-
2026-05-12status Active
-
2026-05-05historical Active Under Contract
-
2026-03-23$197,500 Active
ⓘ Source: listings_history table (triggers on properties + properties_extension) + one-shot
backfill from property_details.listing_events for pre-trigger history.
Climate risk First Street
- Flood 1/10 Low FEMA zone X (unshaded) · 0% chance over 30 yrs
- Wildfire 5/10 Major
- Heat 3/10 Moderate 8 d/yr ≥95°F today · 22 d/yr by 30 yrs out
- Wind 2/10 Low
- Air quality 2/10 Low 0 unhealthy d/yr today · 1 by 30 yrs out
Nearby sold comps map
Loading sold comps map…
Walkable amenities ~0.75 mi
Loading nearby amenities…
Taxation est. · year 1
- Rental income
- $27,287
- − Mortgage interest
- −$11,063
- − Property taxes
- −$2,962
- − Insurance
- −$988
- − Repairs & maintenance
- −$2,183
- − Management
- −$2,183
- − Depreciation
- −$5,745
- Taxable income
- $2,163
- Est. tax owed @ 24.0%
- −$519
- After-tax cash flow
- $4,659/yr
For passive investors: Depreciation is non-cash, so a rental often shows a tax loss while cash-flowing — sheltering income. Rental losses are passive: they offset passive income freely, and up to $25,000/yr can offset ordinary (W-2) income if you actively participate and your MAGI is under $100k (phasing out to $0 by $150k); unused losses carry forward. On sale, claimed depreciation is recaptured at up to 25%, and gains may owe capital-gains tax (a 1031 exchange can defer both). Figures are a year-1 estimate at your 24.0% rate — not tax advice; consult a CPA.
Condition & rehab AI · 13 photos
This well-maintained home offers a good condition with recent updates, making it a solid investment opportunity.
Value-add opportunities
- Resale update kitchen appliances — modern appliances enhance appeal
- Resale update bathroom fixtures — updated fixtures improve functionality
- Both landscape front yard — enhances curb appeal and adds value
- Both paint exterior — fresh paint improves curb appeal and enhances value
Renovation cost estimate screening
Value-add ROI direction
- Resale update kitchen appliances — modern appliances enhance appeal ↑
- Resale update bathroom fixtures — updated fixtures improve functionality ↑
- Both landscape front yard — enhances curb appeal and adds value ↑
- Both paint exterior — fresh paint improves curb appeal and enhances value ↑
ⓘ Cost ranges are severity-bucket heuristics (US national rule-of-thumb). Get contractor quotes + a written scope before underwriting a rehab budget.
Schools (NCES district)
- District
- Johnson County
- NCES district ID
- 4702160
- Math proficiency
- 27% ▼ -11.00%
- Reading proficiency
- 31% ▬ 0.00%
- Median HH income
- $31,298
- Composite
- 23.58/100
- National rank
- #7852
- State rank
- #69 of 139 in TN
Livability — Butler
No livability data for this city. (Only ~50 U.S. cities are tracked.)
Census & demographics
- Census place
- Butler, TN
- Population (ZIP)
- 3,343
Population outlook (Johnson County) Hauer SSP2
- Today (2025)
- 16,842 people
- By 2030
- 16,158 · -4.1%
- By 2040
- 14,682 · -12.8%
- By 2050
- 13,306 · -21.0%
- By 2075
- 11,087 · -34.2%
- By 2100
- 9,360 · -44.4%
Race, ethnicity, and origin ACS 2023
- Neighborhood character
- Predominantly White (97%)
- Race & ethnicity
- White 97% Two or more races 3%
- Common ancestry
- Serbian 5% Lithuanian 2% Italian 2%
- Foreign-born
- 1%
Political lean MEDSL · Johnson
- 2024 margin
- Solid R (+69.3) · D 15.0% · R 84.3%
- 2008→2024 swing
- -27.1pp toward R · 2008: -42.2pp · 2024: -69.3pp
- All cycles
- 2024: R+69.3 2020: R+66.9 2016: R+67.3 2012: R+50.5 2008: R+42.2
Not yet ingested
- Civics
- —
Market trends
- HPI YoY
- ▼ -3.70%
- Current HPI
- 376.3439
- Rent YoY
- —
- Metro
- —
- State GDP YoY
- ▲ 2.78%
- F500 in state
- 22
Industry mix (Fortune 500 HQ in TN)
| Industry | F500 HQs | Revenue |
|---|---|---|
| Healthcare | 3 | $91B |
|
||
| Retail | 3 | $72B |
|
||
| Transportation / Logistics | 1 | $88B |
|
||
| Paper / Packaging | 1 | $19B |
|
||
| Insurance | 1 | $13B |
|
||
| Energy | 1 | $12B |
|
||
Price history
3 events — show timeline
- 2026-05-12 Relisted — TVRMLS
- 2026-05-05 Contingent — TVRMLS
- 2026-03-23 Listed $197,500 TVRMLS
Cash-flow waterfall
monthlySold comps — $/sqft
last 12 mo · ≤1 miLoading sold comps…