 Fourplex
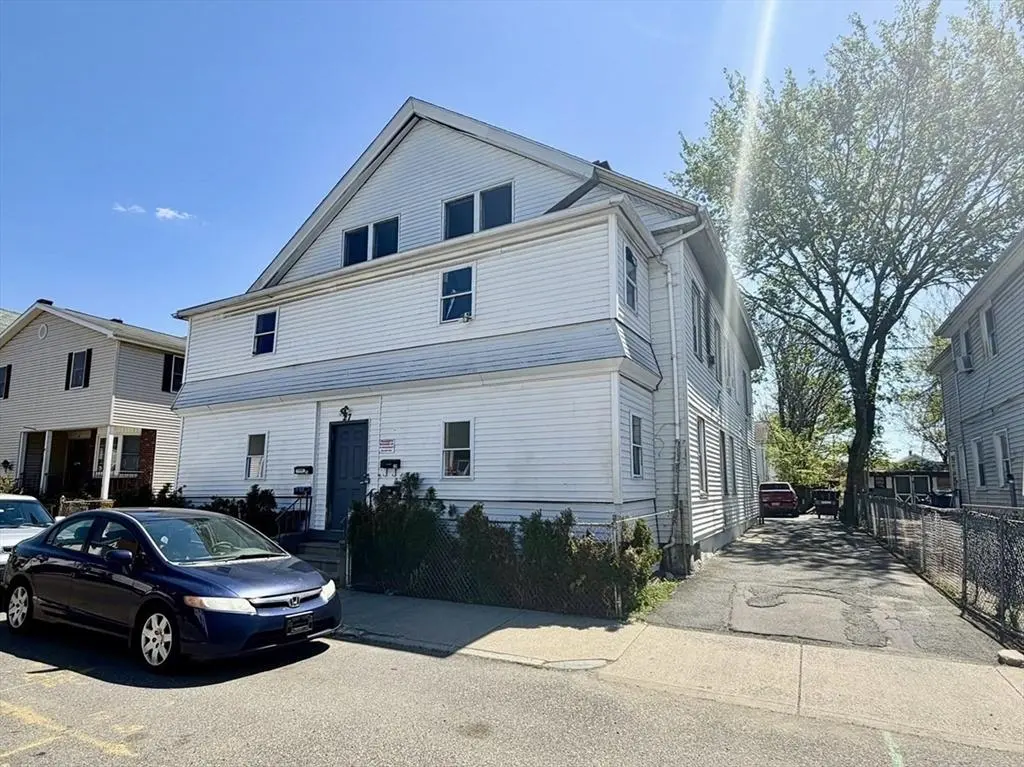
27 Loring St · Springfield, MA
Flood risk No data
- FEMA flood zone
- —
- Chance of flooding over 30 yrs
- —
- Est. flood insurance / yr
- —
Fire risk No data
- Est. fire insurance / yr
- —
Heat risk No data
- Hot days now (above threshold)
- —
- Hot days in 30 yrs
- —
Wind risk No data
- Chance of severe wind over 30 yrs
- —
Air-quality risk No data
- Unhealthy air days now
- —
- Unhealthy air days in 30 yrs
- —
Risk factors via First Street. Map © Google.
Why this score? — see what drove the C+ grade
The composite is a weighted blend of 9 inputs, each scored 0–100. Each bar is that input's sub-score; the figure is the points it added to the 100-point composite (weight × sub-score).
- Cash flow +29.4/30.0
- DSCR +10.0/10.0
- 1% rule +7.5/10.0
- Appreciation +5.5/10.0
- Livability +3.7/5.0
- Rent growth +2.5/5.0
- Condition / age +2.5/5.0
- Schools +1.6/10.0
- ARV discount +0.0/15.0
$569,900
🖨 Deal sheet 📄 Offer letter ✓ Due diligence
Multi-family units
County records classify this as Multi-Family (5+ Unit). Listing-text estimate: 4 units. estimate disagrees with records
5+ unit building — per-unit beds/baths from public records are typically unavailable; the breakdown below (if shown) is an estimate from the listing text.
Listing remarks MLS
FORECLOSED 4 FAMILY. ADDITIONAL ROOMS ON 3RD FLOOR. 3 SEPARATE HEATING SYSTEMS. FANNIE MAE FINANCING AVAILABLE FOR INVESTOR-ONLY 10% DOWN.
Key facts
- Plenty of parking
- Gas heating
- 5,763 sq ft lot
Tags
Property features AI
Finance
- Other: Property is tenant-occupied (leases in place for multiple units); Exclusions: tenants' personal belongings
- Financial info: Tax information available separately
- HOA & community: Not a senior community
Exterior
- Parking: Attached/has garage with 3 garage spaces; 3 covered parking spaces; 9 open parking spaces; Total parking for 12 vehicles; Off-street parking
- Security: Security details not provided
- Utilities: Public water; Public sewer; Electric with circuit breakers
- Home design: 4-family property; 4 stories total; White exterior; Approximately built (year per public records)
- Construction: Stone foundation; Shingle roof; Building area approximately 5,880 total square feet
- Exterior features: Level lot; Lot approximately 0.13 acres
Interior
- Kitchen: Kitchens in each unit (standard apartment kitchens)
- Bedrooms: Multiple units with tenant-occupied bedrooms (unit-level details available)
- Flooring: Flooring details not provided
- Bathrooms: 4 full bathrooms
- Heating & cooling: 4 separate heating units; 4 heat zones
- Interior features: 16 total rooms; Full basement
- Laundry & utility: Laundry/utility details not provided
Neighborhood map
What this means for you Summary
Snapshot
- This is a 4 × 2-bed/1.0-bath units multifamily listed at $570k.
Deal economics
- At list price, monthly cash flow is $2k ($24k/yr) — positive. Per door: $504/mo.
- The deal already cash-flows at list — no discount required.
- Meets the 1% rule at list price ($7k rent vs $570k).
- Recommended offer: $553k (3.0% below list) — sets the bar for market timing.
- Cap rate 10.5% vs local median 5.1% in Springfield — top-decile yield for the area; either an underpriced asset or a hidden risk that comps aren't pricing in. Stress-test before assuming the spread holds.
Location & tenants
- Location reads 73/100 on livability (#97 in MA) — a middle-class / working-renter tenant base. Strengths: commute A+, health & safety A+, amenities A; Watch: schools D, crime F, employment D-.
- Springfield (urban): math 13% / reading 25% proficiency, ranked #296 of 302 in MA (top 98%) — low school quality limits family demand, transient renter base, plan for 1-2y turnover; 81% free/reduced lunch — lower-income household profile, screen leases tightly.
- Market conditions: 18 active listings in the ZIP; 453 units permitted in Hampden County in 2024 (116 in 5+ unit buildings).
Forward outlook
- In year one you build about $10k of equity ($4k loan paydown + $6k appreciation (1.1% local appreciation)).
- Hampden County population projected at +5% by 2050 — modest demand growth; plan on rents tracking national, not racing it.
- At projected returns (1.1% appreciation + 3.0% rent growth), your $160k cash investment doubles in ~5 years — after that, you're playing with house money.
- By year 4, paydown + projected appreciation supports a ~$36k cash-out refi (75% LTV) — recoverable capital for the next deal without selling this one.
Negotiation context
- It's been on market 37 days — a 3% lower offer ($553k) is reasonable based on typical stale-listing flexibility.
- 3 sale attempts since 31y ago with the ask held roughly flat each time — persistent listings suggest the price (not the market) is what's stuck; bring a comps-based counter.
- Current owner paid $153k; list at $570k implies a 272% gain — meaningful room to come down on a strong offer.
Risks & watch-outs
- Watch-outs: built in 1880 — expect roof / HVAC / electrical / plumbing capex.
Questions for the listing agent
- It's been on market 37 days. Have you received any prior offers? Is the seller open to a 3% concession, seller financing, or rate buy-down credit?
- Can we see the unit-by-unit rent roll, current vacancy, and any below-market leases? What's the average tenancy length?
- What capital expenditures (roof, boiler, parking lot, exteriors) have been made in the last 5 years, and what's planned in the next 2?
- Built in 1880 — when were the roof, HVAC, electrical panel, plumbing, and water heater last replaced?
- Is there a deadline driving the sale (1031 exchange, divorce, estate, relocation)? That informs how much negotiation room exists.
- Schools are D-rated, which usually means shorter tenancies and higher turnover. Who's the typical renter profile here, and what's been the actual vacancy rate?
- Crime grade is F in this area — have there been break-ins, vandalism, or insurance claims at this property in the last 3 years? What carrier currently insures it and at what premium?
- What's the average days-on-market for RENTAL listings here right now (not sales)? A rising rental-DOM trend means longer vacancies and softer asking-rent achievability than the comps imply.
- What's the recent tenant-quality profile in this submarket — average credit score on applications, eviction rate, late-payment / NSF rate, and stable-employment percentage? A property-management company in the area should have these aggregated.
- How much new apartment / multifamily construction is in the pipeline within 1–3 miles? Heavy new supply (>2% of stock underway) typically softens rents 12–24 months out; light construction supports rent growth.
Investment metrics
- 1% rule
- 1.25% ✓
- Cap rate
- 10.54%
- Cash-on-cash
- 15.16%
- DSCR
- 1.67
- GRM
- 6.6
CMA / ARV
- ARV (median comp)
- $420,108
- List price
- $569,900
- Delta
- 35.66%
- Verdict
- OVERPRICED
- Comps
- 20 within 1.0 mi
Show comp detail 2 sales within ~0.75 mi
| Address | Dist | Beds/Ba | Sqft | Sold | Price | $/sf | Match |
|---|---|---|---|---|---|---|---|
| 78 Maple St | 0.43mi | 8/4.5 | 5,408 (-8%) | 12mo | $441,000 | $82 | 55 |
| 40 Byers St | 0.73mi | 8/4.0 | 5,000 (-15%) | 3mo | $350,000 | $70 | 39 |
Match score weights: distance 35% · size 25% · config 20% · recency 20%. Top-matched comps best support the ARV.
Projected returns pro-forma
1.08% appreciation · 3.0% rent growth · sell at horizon
- IRR
- 17.3%
- Equity multiple
- 1.88×
- Total profit
- $141,220
- Equity at exit
- $196,922
- IRR
- 20.5%
- Equity multiple
- 3.49×
- Total profit
- $397,775
- Equity at exit
- $263,532
Cash invested: $159,572 (down + closing). Projections, not guarantees.
Landlord ↔ Tenant lean methodology
- Overall (STATE)
- 20 Strongly Tenant-Friendly
- State Massachusetts
- 20 Strongly Tenant-Friendly · D+15
- County
- — inherits STATE
- City
- — inherits STATE
ZIP-level market 01105
- Home prices YoY
- 0.3%
- Active inventory
- 18
- Price-to-rent
- 26.6×
Monthly cashflow live
- Estimated rent
- $7,152 high interval (Pro) →
- Mortgage (P&I)
- −$2,989
- Tax from tax record
- −$408 /mo · $4,893/yr
- Insurance
- −$237
- HOA
- −$0
- Vacancy / Maint / Mgmt
- −$1,502
- Net cashflow
- $2,016
Break-even live
4-unit breakdown (identical units grouped — click to expand)
| Units | Beds | Baths | Est. rent |
|---|---|---|---|
| 4× units | 2 | 1 | $7,152 |
| #1 | 2 | 1 | $1,788 |
| #2 | 2 | 1 | $1,788 |
| #3 | 2 | 1 | $1,788 |
| #4 | 2 | 1 | $1,788 |
| Total (4 units) | $7,152 | ||
UW: 25.0% down · 7.5% · 30yr · 1.5% tax · 5.0% vac · 8.0% maint · 8.0% mgmt
Financing live
Cash to close
- Down payment
- $142,475
- Closing costs
- $17,097
- Reserves months
- —
- Total cash needed
- —
Loan-product check · same deal, 3 products live
Conventional
25% down · 7.5% · 30yr
- Down + closing
- —
- Monthly P&I
- —
- Monthly cashflow
- —
- DSCR
- —
- Eligible?
- —
Personal DTI + credit; lowest rate.
DSCR
20% down · 8.5% · 30yr
- Down + closing
- —
- Monthly P&I
- —
- Monthly cashflow
- —
- DSCR
- —
- Eligible?
- —
No personal income docs; deal must DSCR.
Hard money
10% down · 12.0% · 12mo
- Down + closing
- —
- Monthly P&I
- —
- Monthly cashflow
- —
- DSCR
- —
- Eligible?
- —
Short-term bridge; refi at stabilization.
Listing history 24 events
-
2026-06-18days on market $569,900 Active 37 DOM
-
2026-06-17days on market $569,900 Active 36 DOM
-
2026-06-16days on market $569,900 Active 35 DOM
-
2026-06-15days on market $569,900 Active 34 DOM
-
2026-06-14days on market $569,900 Active 32 DOM
-
2026-06-13days on market $569,900 Active 31 DOM
-
2026-06-10days on market $569,900 Active 29 DOM
-
2026-06-09days on market $569,900 Active 28 DOM
-
2026-06-08days on market $569,900 Active 27 DOM
-
2026-06-07days on market $569,900 Active 26 DOM
-
2026-06-05days on market $569,900 Active 23 DOM
-
2026-06-03days on market $569,900 Active 22 DOM
-
2026-06-02days on market $569,900 Active 21 DOM
-
2026-06-01days on market $569,900 Active 20 DOM
-
2026-05-31days on market $569,900 Active 19 DOM
-
2026-05-30days on market $569,900 Active 18 DOM
-
2026-05-12$569,900 New 527-char remark
-
2022-07-01price $1,300
-
2018-11-27soldstatus $153,000
-
2018-05-15$178,900
-
1997-01-24soldstatus $90,000
-
1995-07-20soldstatus $30,760
Show marketing remark (138 chars)
FORECLOSED 4 FAMILY. ADDITIONAL ROOMS ON 3RD FLOOR. 3 SEPARATE HEATING SYSTEMS. FANNIE MAE FINANCING AVAILABLE FOR INVESTOR-ONLY 10% DOWN.
-
1995-03-20$34,890
Show marketing remark (138 chars)
FORECLOSED 4 FAMILY. ADDITIONAL ROOMS ON 3RD FLOOR. 3 SEPARATE HEATING SYSTEMS. FANNIE MAE FINANCING AVAILABLE FOR INVESTOR-ONLY 10% DOWN.
-
1989-11-14soldstatus $150,000
ⓘ Source: listings_history table (triggers on properties + properties_extension) + one-shot
backfill from property_details.listing_events for pre-trigger history.
Tax reassessment forecast MA · Partial reset (capped growth)
- Current annual tax
- $4,893 · $408/mo
- Projected year-2 tax
- $5,951 · $496/mo
- Expected delta
- +$1,058/yr (+$88/mo · 21.6%)
ⓘ Screening estimate from a state-policy table — verify with the county assessor before closing.
Nearby sold comps map
Loading sold comps map…
Walkable amenities ~0.75 mi
Loading nearby amenities…
Taxation est. · year 1
- Rental income
- $85,824
- − Mortgage interest
- −$31,923
- − Property taxes
- −$4,893
- − Insurance
- −$2,850
- − Repairs & maintenance
- −$6,866
- − Management
- −$6,866
- − Depreciation
- −$16,579
- Taxable income
- $15,847
- Est. tax owed @ 24.0%
- −$3,803
- After-tax cash flow
- $20,392/yr
For passive investors: Depreciation is non-cash, so a rental often shows a tax loss while cash-flowing — sheltering income. Rental losses are passive: they offset passive income freely, and up to $25,000/yr can offset ordinary (W-2) income if you actively participate and your MAGI is under $100k (phasing out to $0 by $150k); unused losses carry forward. On sale, claimed depreciation is recaptured at up to 25%, and gains may owe capital-gains tax (a 1031 exchange can defer both). Figures are a year-1 estimate at your 24.0% rate — not tax advice; consult a CPA.
Schools (NCES district)
- District
- Springfield
- NCES district ID
- 2511130
- Math proficiency
- 13% ▼ -12.00%
- Reading proficiency
- 25% ▼ -5.00%
- Median HH income
- $34,938
- Composite
- 15.6/100
- National rank
- #9293
- State rank
- #296 of 302 in MA
Livability — Springfield
- Score
- 73/100
- State rank
- #97
- US rank
- #5195
Category grades
Schools grade is shown separately in the Schools card above.
Census & demographics
- Census place
- Springfield, MA
- City population
- 61,006
- Population (ZIP)
- 11,469
Population outlook (Hampden County) Hauer SSP2
- Today (2025)
- 485,646 people
- By 2030
- 491,517 · +1.2%
- By 2040
- 500,539 · +3.1%
- By 2050
- 508,827 · +4.8%
- By 2075
- 539,167 · +11.0%
- By 2100
- 545,698 · +12.4%
Race, ethnicity, and origin ACS 2023
- Neighborhood character
- Predominantly Hispanic (74%)
- Race & ethnicity
- Hispanic / Latino 74% Two or more races 37% Black 14% White 10%
- Hispanic origin (detail)
- Puerto Rican 63% Dominican 5%
- Common ancestry
- Lithuanian 1% Romanian 1%
- Foreign-born
- 8% · Canada
- Languages at home
- 44% English-only · Spanish 53% Other Indo-European 2% French/Haitian/Cajun 1%
Political lean MEDSL · Hampden
- 2024 margin
- Lean D (+8.9) · D 53.4% · R 44.5% · Other 2.1%
- 2008→2024 swing
- -16.4pp toward R · 2008: 25.3pp · 2024: 8.9pp
- All cycles
- 2024: D+8.9 2020: D+17.7 2016: D+16.0 2012: D+25.4 2008: D+25.3
Not yet ingested
- Civics
- —
Market trends
- HPI YoY
- ▲ 1.08%
- Current HPI
- 322.6127
- Rent YoY
- —
- Metro
- —
- State GDP YoY
- ▲ 2.28%
- F500 in state
- 38
Industry mix (Fortune 500 HQ in MA)
| Industry | F500 HQs | Revenue |
|---|---|---|
| Technology | 3 | $17B |
|
||
| Insurance | 2 | $84B |
|
||
| Retail | 2 | $76B |
|
||
| Life Sciences | 1 | $43B |
|
||
| Energy Technology | 1 | $31B |
|
||
| Aerospace / Defense | 1 | $18B |
|
||
Price history
+279.9% since first listed8 events — show timeline
- 2026-05-12 Listed $569,900 MLS PIN
- 2022-07-01 Price Changed $1,300 RENT.
- 2018-11-27 Sold (MLS) $153,000 MLS PIN
- 2018-05-15 Listed $178,900 MLS PIN
- 1997-01-24 Sold (Public Records) $90,000 Public Records
- 1995-07-20 Sold (MLS) $30,760 MLS PIN
- 1995-03-20 Listed $34,890 MLS PIN
- 1989-11-14 Sold (Public Records) $150,000 Public Records
Property tax history
+6.1%/yrLatest (2023): $4,893 · -3.2% YoY. Source: county tax records.
Cash-flow waterfall
monthlySold comps — $/sqft
last 12 mo · ≤1 miLoading sold comps…