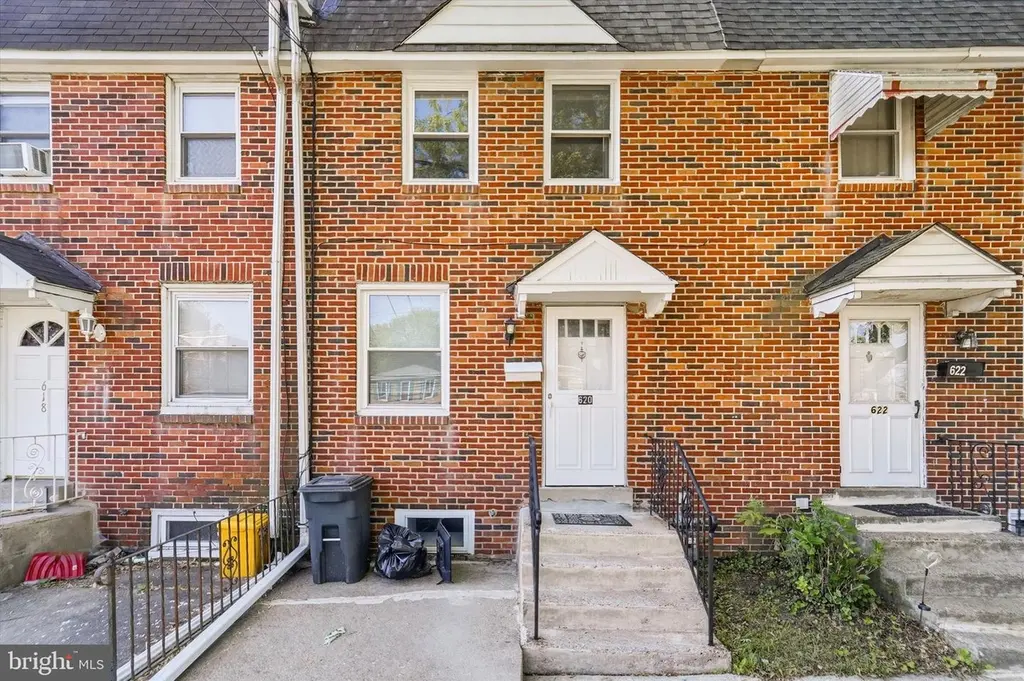
620 Macdade Blvd · Collingdale, PA
Flood risk 1/10 · Minimal
- FEMA flood zone
- X (unshaded)
- Chance of flooding over 30 yrs
- 0.0%
- Est. flood insurance / yr
- $473 – $860
Fire risk 1/10 · Minimal
- Est. fire insurance / yr
- $511 – $949
Heat risk 6/10 · Moderate
- Hot days now (above 103°F)
- 7 days/yr
- Hot days in 30 yrs
- 15 days/yr
Wind risk 6/10 · Moderate
- Chance of severe wind over 30 yrs
- 27.0%
Air-quality risk 4/10 · Minor
- Unhealthy air days now
- 3 days/yr
- Unhealthy air days in 30 yrs
- 6 days/yr
Risk factors via First Street. Map © Google.
Why this score? — see what drove the C- grade
The composite is a weighted blend of 9 inputs, each scored 0–100. Each bar is that input's sub-score; the figure is the points it added to the 100-point composite (weight × sub-score).
- Cash flow +19.2/30.0
- ARV discount +9.3/15.0
- DSCR +6.1/10.0
- 1% rule +5.5/10.0
- Rent growth +5.0/5.0
- Livability +4.2/5.0
- Condition / age +2.5/5.0
- Schools +2.0/10.0
- Appreciation +0.0/10.0
$185,000
🖨 Deal sheet 📄 Offer letter ✓ Due diligence
Listing remarks
Welcome to 620 MacDade Blvd in Darby — a newly updated, move-in ready row home offering fresh finishes, practical living space, and important recent improvements already completed. Step inside to find a bright and comfortable main level with fresh paint and new flooring, creating a clean, welcoming feel from the moment you enter. The home features an updated kitchen completed in 2026, offering a modernized space for everyday cooking, dining, and entertaining. Upstairs, you’ll find three bedrooms and one full bathroom, making this a great option for a first-time buyer, investor, or anyone looking for a low-maintenance home that is ready to enjoy right away. The partially finished
Key facts
- Newer roof
- Updated kitchen
- Central a c
Tags
Property features AI
Finance
- Other: Pets allowed on a case-by-case basis
Exterior
- Parking: On-street parking
- Utilities: Public water; Public sewer; Electric cooling
- Home design: Interior townhouse/rowhouse; Fee simple ownership; Property condition described as Excellent to Average
- Construction: Brick construction; Concrete perimeter foundation; Double-pane windows
- Exterior features: Rear fencing; Porch(es)
Interior
- Kitchen: Built-in range; Stove; Refrigerator
- Bedrooms: Three bedrooms on the upper level
- Flooring: Luxury vinyl plank
- Bathrooms: One full bathroom (all upper levels)
- Heating & cooling: Hot water heating; Natural gas heating and hot water; Central air conditioning (electric)
- Interior features: Drywall walls and ceilings; Partially finished basement; Basement laundry
- Laundry & utility: Laundry in the basement
Neighborhood map
What this means for you Summary
Snapshot
- This is a 3-bed/1.0-bath townhouse listed at $185k.
Deal economics
- At list price, monthly cash flow is $201 ($2k/yr) — positive.
- The deal already cash-flows at list — no discount required.
- Meets the 1% rule at list price ($2k rent vs $185k).
- Cap rate 7.6% vs local median 6.0% in Collingdale — meaningfully above typical; check what's discounted (condition, days-on-market, listing class) to confirm the premium yield is real.
Location & tenants
- Location reads 84/100 on livability (#105 in PA, #781 nationally) — a professional / high-income tenant draw. Strengths: commute A+, cost of living A+, housing A+; Watch: employment C-, amenities D.
- Southeast Delco SD (suburban): math 13% / reading 33% proficiency, ranked #478 of 539 in PA (top 89%) — low school quality limits family demand, transient renter base, plan for 1-2y turnover; 63% free/reduced lunch — lower-income household profile, screen leases tightly.
- Market conditions: Rents rising fast (+13.1%/yr); 99 active listings in the ZIP; 40 comparable units currently listed for rent nearby; rentals at typical pace (median 24d on market — plan ~3-4 weeks tenant-placement turnaround); 299 units permitted in Delaware County in 2024 (5 in 5+ unit buildings).
- At $1,944/mo this rent would consume 50% of the median local household income ($46k/yr) (locally 1468% of renters already pay >50% of income on rent) — very limited rent-growth headroom before tenants either downsize or default.
Forward outlook
- Local home prices are declining (-3.0%/yr); year-one equity from $1k of loan paydown is wiped out by about $6k of value loss. Plan a longer hold.
- At projected returns (-3.0% appreciation + 8.0% rent growth), your $52k cash investment doubles in ~9 years — after that, you're playing with house money.
Negotiation context
- Only 8 days on market — expect competitive offers; lowballing is unlikely to land.
- 4 sale attempts since 3y ago with the ask held roughly flat each time — persistent listings suggest the price (not the market) is what's stuck; bring a comps-based counter.
- Current owner paid $104k; list at $185k implies a 78% gain — meaningful room to come down on a strong offer.
Risks & watch-outs
- Watch-outs: built in 1940 — expect roof / HVAC / electrical / plumbing capex.
- Climate carrying-cost: major wind risk, 27% chance of damaging wind over 30y; extreme-heat days projected 7→15/yr by 2055 (HVAC capex compounding) — expect insurance premiums to compound above CPI over the hold.
Questions for the listing agent
- Built in 1940 — when were the roof, HVAC, electrical panel, plumbing, and water heater last replaced?
- Is there a deadline driving the sale (1031 exchange, divorce, estate, relocation)? That informs how much negotiation room exists.
- What's the average days-on-market for RENTAL listings here right now (not sales)? A rising rental-DOM trend means longer vacancies and softer asking-rent achievability than the comps imply.
- What's the recent tenant-quality profile in this submarket — average credit score on applications, eviction rate, late-payment / NSF rate, and stable-employment percentage? A property-management company in the area should have these aggregated.
- How much new for-sale + rental construction is in the pipeline within 1–3 miles? Heavy new supply typically softens prices + rents 12–24 months out; constrained supply supports both.
Investment metrics
- 1% rule
- 1.05% ✓
- Cap rate
- 7.60%
- Cash-on-cash
- 4.65%
- DSCR
- 1.21
- GRM
- 7.9
CMA / ARV
- ARV (on-the-fly)
- $192,512
- Comps found
- 12
Show comp detail 12 sales within ~0.75 mi
| Address | Dist | Beds/Ba | Sqft | Sold | Price | $/sf | Match |
|---|---|---|---|---|---|---|---|
| 118 Juliana Ter | 0.02mi | 3/1.0 | 1,020 (-0%) | 2mo | $145,000 | $142 | 97 |
| 205 Brainerd Blvd | 0.51mi | 3/1.0 | 914 (-11%) | 1mo | $212,000 | $232 | 58 |
| 219 Laurel Rd | 0.66mi | 2/1.0 (-1) | 1,068 (+4%) | 2mo | $160,000 | $150 | 56 |
| 17 Folcroft Ave | 0.48mi | 3/1.0 | 1,152 (+12%) | 4mo | $230,000 | $200 | 53 |
| 420 Rively Ave | 0.68mi | 3/1.5 | 1,120 (+9%) | 1mo | $240,000 | $214 | 50 |
| 414 Rively Ave | 0.67mi | 3/1.5 | 1,120 (+9%) | 1mo | $230,000 | $205 | 50 |
| 220 Brainerd Blvd | 0.56mi | 3/1.5 | 914 (-11%) | 5mo | $217,000 | $237 | 50 |
| 422 Rively Ave | 0.68mi | 3/1.5 | 1,120 (+9%) | 2mo | $210,000 | $188 | 49 |
| 8 Clarendon Dr | 0.61mi | 3/1.0 | 1,152 (+12%) | 2mo | $115,000 | $100 | 49 |
| 145 Greenwood Rd | 0.64mi | 3/1.0 | 1,138 (+11%) | 4mo | $100,000 | $88 | 48 |
| 457 Westmont Dr | 0.68mi | 3/2.0 | 1,120 (+9%) | 3mo | $190,000 | $170 | 46 |
| 1213 Crestview Rd | 0.67mi | 3/1.0 | 1,152 (+12%) | 4mo | $120,000 | $104 | 45 |
Match score weights: distance 35% · size 25% · config 20% · recency 20%. Top-matched comps best support the ARV.
Projected returns pro-forma
-3.0% appreciation · 8.0% rent growth · sell at horizon
- IRR
- -3.3%
- Equity multiple
- 0.87×
- Total profit
- $-6,849
- Equity at exit
- $27,584
- IRR
- 11.4%
- Equity multiple
- 2.11×
- Total profit
- $57,518
- Equity at exit
- $15,995
Cash invested: $51,800 (down + closing). Projections, not guarantees.
Landlord ↔ Tenant lean methodology
- Overall (STATE)
- 62 Landlord-Friendly
- State Pennsylvania
- 62 Landlord-Friendly · EVEN
- County
- — inherits STATE
- City
- — inherits STATE
ZIP-level market 19023
- Rents YoY
- 13.1%
- Active inventory
- 99
- Price-to-rent
- 7.9×
Monthly cashflow live
- Estimated rent
- $1,944 high interval (Pro) →
- Mortgage (P&I)
- −$970
- Tax from tax record
- −$287 /mo · $3,448/yr
- Insurance
- −$77
- HOA
- −$0
- Vacancy / Maint / Mgmt
- −$408
- Net cashflow
- $201
Break-even live
UW: 25.0% down · 7.5% · 30yr · 1.5% tax · 5.0% vac · 8.0% maint · 8.0% mgmt
Financing live
Cash to close
- Down payment
- $46,250
- Closing costs
- $5,550
- Reserves months
- —
- Total cash needed
- —
Loan-product check · same deal, 3 products live
Conventional
25% down · 7.5% · 30yr
- Down + closing
- —
- Monthly P&I
- —
- Monthly cashflow
- —
- DSCR
- —
- Eligible?
- —
Personal DTI + credit; lowest rate.
DSCR
20% down · 8.5% · 30yr
- Down + closing
- —
- Monthly P&I
- —
- Monthly cashflow
- —
- DSCR
- —
- Eligible?
- —
No personal income docs; deal must DSCR.
Hard money
10% down · 12.0% · 12mo
- Down + closing
- —
- Monthly P&I
- —
- Monthly cashflow
- —
- DSCR
- —
- Eligible?
- —
Short-term bridge; refi at stabilization.
Rent comps 40 comps
| Address | Beds | Baths | Sqft | Rent | $/sqft | DOM | Units | Dist |
|---|---|---|---|---|---|---|---|---|
| 112 Juliana Ter Darby, PA | 3.0 | 1.0 | 1020 | $2,450 | $2.40 | 24d | 1 | 0.05mi |
| 112 Juliana Ter Darby, PA | 3.0 | 1.0 | 1020 | $2,350 | $2.30 | 44d | 1 | 0.05mi |
| 118 Felton Ave Darby, PA | 3.0 | 1.0 | 1152 | $1,750 | $1.52 | 21d | 1 | 0.08mi |
| 66 Folcroft Ave Folcroft, PA | 3.0 | 1.0 | 1224 | $1,895 | $1.55 | 3d | 1 | 0.51mi |
| 2 Winthrop Rd Darby, PA | 3.0 | 1.5 | 1224 | $1,900 | $1.55 | 21d | 1 | 0.64mi |
| 132 Folcroft Ave Folcroft, PA | 2.0 | 1.0 | 725 | $1,679 | $2.32 | 2d | 3 | 0.66mi |
| 601 Poplar St Sharon Hill, PA | 1.0–2.0 | 1.0 | 787 | $1,599 | $2.03 | 14d | 5 | 0.70mi |
| 304 Pine St Glenolden, PA | 3.0 | 2.0 | 1120 | $2,400 | $2.14 | 43d | 1 | 0.77mi |
| 1201 Bartram Ave Darby, PA | 2.0 | 1.0 | 700 | $1,350 | $1.93 | 10d | 1 | 0.78mi |
| 306 Pine St Glenolden, PA | 3.0 | 2.0 | 1120 | $2,400 | $2.14 | 4d | 1 | 0.78mi |
| 1512 Elmwood Ave Folcroft, PA | 2.0 | 1.0 | 850 | $1,499 | $1.76 | 24d | 1 | 0.79mi |
| 909 Springfield Rd Unit D Darby, PA | 4.0 | 1.0 | 900 | $1,600 | $1.78 | 43d | 1 | 0.79mi |
| 1503 Elmwood Ave Folcroft, PA | 3.0 | 1.0 | 850 | $1,799 | $2.12 | 43d | 1 | 0.80mi |
| 1503 Elmwood Ave Folcroft, PA | 3.0 | 1.0 | 1025 | $1,699 | $1.66 | 24d | 1 | 0.80mi |
| 1505 Elmwood Ave Unit 5 Folcroft, PA | 2.0 | 1.0 | 850 | $1,499 | $1.76 | 24d | 1 | 0.80mi |
| 1513 Elmwood Ave Unit 4 Folcroft, PA | 3.0 | 1.0 | 1025 | $1,699 | $1.66 | 24d | 1 | 0.81mi |
| 1513 Elmwood Ave Unit 5 Folcroft, PA | 3.0 | 1.0 | 850 | $1,799 | $2.12 | 43d | 1 | 0.81mi |
| 1511 Elmwood Ave Folcroft, PA | 1.0–3.0 | 1.0 | 725 | $1,649 | $2.27 | 23d | 3 | 0.81mi |
| 209 Hamilton Ave Darby, PA | 4.0 | 1.0 | 1400 | $1,595 | $1.14 | 14d | 1 | 0.81mi |
| 145 Isabel Ave Unit 145B Glenolden, PA | 2.0 | 1.0 | 890 | $1,525 | $1.71 | 43d | 1 | 0.91mi |
| 700 Pine St Unit 2F Darby, PA | 2.0 | 1.0 | 1100 | $1,250 | $1.14 | 18d | 1 | 0.93mi |
| 1300 Main St Unit Basement Darby, PA | 2.0 | 1.0 | 1000 | $1,450 | $1.45 | 24d | 1 | 0.93mi |
| 1300 Main St Unit Basement Darby, PA | 2.0 | 1.0 | 800 | $1,450 | $1.81 | 10d | 1 | 0.93mi |
| 1074 N Academy Ave Glenolden, PA | 3.0 | 1.0 | 1152 | $1,850 | $1.61 | 5d | 1 | 0.97mi |
| 820 Greenhill Rd Sharon Hill, PA | 4.0 | 2.0 | 1184 | $2,600 | $2.20 | 5d | 1 | 0.97mi |
| 69 S 7th St Darby, PA | 3.0 | 2.0 | 1446 | $1,700 | $1.18 | 43d | 1 | 0.99mi |
| 100 S Oak Ave Glenolden, PA | 1.0–2.0 | 1.0–2.0 | 830 | $1,500 | $1.81 | 23d | 3 | 1.01mi |
| 924 Maple Ter Darby, PA | 3.0 | 1.5 | 1190 | $2,000 | $1.68 | 5d | 1 | 1.07mi |
| 935 Maple Ter Darby, PA | 3.0 | 1.0 | 1266 | $1,585 | $1.25 | 10d | 1 | 1.09mi |
| 935 Maple Ter Darby, PA | 3.0 | 1.0 | 1266 | $1,585 | $1.25 | 5d | 1 | 1.09mi |
| 37 Concord Rd Darby, PA | 3.0 | 1.0 | 1120 | $1,795 | $1.60 | 43d | 1 | 1.11mi |
| 29 Logan Ave Unit 11 Glenolden, PA | 2.0 | 1.0 | 850 | $1,350 | $1.59 | 24d | 1 | 1.12mi |
| 902 Maple Ave Glenolden, PA | 3.0 | 1.0 | 1152 | $1,745 | $1.51 | 43d | 1 | 1.15mi |
| 925 Maple Ave Glenolden, PA | 3.0 | 2.0 | 1152 | $2,800 | $2.43 | 21d | 1 | 1.17mi |
| 106 N 6th St Darby, PA | 2.0 | 1.0 | 1200 | $1,550 | $1.29 | 43d | 1 | 1.21mi |
| 412 S 2nd St Darby, PA | 3.0 | 1.0 | 1190 | $1,100 | $0.92 | 5d | 1 | 1.25mi |
| 417 S 2nd St Darby, PA | 3.0 | 1.0 | 1190 | $1,020 | $0.86 | 5d | 1 | 1.26mi |
| 926 Green Ln Secane, PA | 2.0 | 1.0 | 862 | $2,185 | $2.53 | 43d | 1 | 1.30mi |
| 201 Westbridge Rd Glenolden, PA | 3.0 | 1.5 | 1224 | $2,350 | $1.92 | 24d | 1 | 1.30mi |
| 137 W Maryland Ave Unit 2nd Flr Aldan, PA | 2.0 | 1.0 | 800 | $1,400 | $1.75 | 5d | 1 | 1.30mi |
Listing history 13 events
-
2026-05-19$185,000 Active
-
2025-10-08historical $1,900
-
2025-08-02price $1,900
-
2025-07-02$2,000
-
2025-01-27historical
-
2024-10-22price $169,999
-
2024-09-27price $175,000
-
2024-07-15$180,000 Active
-
2023-11-20historical $1,700
-
2023-11-10$1,700
-
2023-10-04soldstatus $104,000
-
1987-05-29soldstatus $47,900
-
1981-04-01soldstatus $18,000
ⓘ Source: listings_history table (triggers on properties + properties_extension) + one-shot
backfill from property_details.listing_events for pre-trigger history.
Tax reassessment forecast PA · Partial reset (capped growth)
- Current annual tax
- $3,448 · $287/mo
- Projected year-2 tax
- $3,448 · $287/mo
- Expected delta
- $0/yr ($0/mo · 0.0%)
ⓘ Screening estimate from a state-policy table — verify with the county assessor before closing.
Climate risk First Street
- Flood 1/10 Low FEMA zone X (unshaded) · 0% chance over 30 yrs
- Wildfire 1/10 Low
- Heat 6/10 Major 7 d/yr ≥103°F today · 15 d/yr by 30 yrs out
- Wind 6/10 Major 27% chance of damaging wind over 30 yrs
- Air quality 4/10 Moderate 3 unhealthy d/yr today · 6 by 30 yrs out
Nearby sold comps map
Loading sold comps map…
Walkable amenities ~0.75 mi
Loading nearby amenities…
Taxation est. · year 1
- Rental income
- $23,323
- − Mortgage interest
- −$10,363
- − Property taxes
- −$3,448
- − Insurance
- −$925
- − Repairs & maintenance
- −$1,866
- − Management
- −$1,866
- − Depreciation
- −$5,382
- Taxable loss
- −$526
- Est. tax savings @ 24.0%
- +$126
- After-tax cash flow
- $2,537/yr
For passive investors: Depreciation is non-cash, so a rental often shows a tax loss while cash-flowing — sheltering income. Rental losses are passive: they offset passive income freely, and up to $25,000/yr can offset ordinary (W-2) income if you actively participate and your MAGI is under $100k (phasing out to $0 by $150k); unused losses carry forward. On sale, claimed depreciation is recaptured at up to 25%, and gains may owe capital-gains tax (a 1031 exchange can defer both). Figures are a year-1 estimate at your 24.0% rate — not tax advice; consult a CPA.
Schools (NCES district)
- District
- Southeast Delco SD
- NCES district ID
- 4222400
- Math proficiency
- 13% ▼ -8.00%
- Reading proficiency
- 33% ▼ -9.00%
- Median HH income
- $49,309
- Composite
- 20.25/100
- National rank
- #8623
- State rank
- #478 of 539 in PA
Livability — Collingdale
- Score
- 84/100
- State rank
- #105
- US rank
- #781
Category grades
Schools grade is shown separately in the Schools card above.
Census & demographics
- Census place
- Collingdale, PA
- County
- Delaware County · 399,863 people
- City population
- 22,247
- Metro
- Philadelphia-Camden-Wilmington, PA-NJ-DE-MD
- Population (ZIP)
- 22,247
- Household income
- $46,463
- Rent vs Own
- Severe rent burden
- 1468.0
Population outlook (Delaware County) Hauer SSP2
- Today (2025)
- 577,490 people
- By 2030
- 581,243 · +0.6%
- By 2040
- 584,700 · +1.2%
- By 2050
- 586,581 · +1.6%
- By 2075
- 598,706 · +3.7%
- By 2100
- 590,823 · +2.3%
Race, ethnicity, and origin ACS 2023
- Neighborhood character
- Predominantly Black (76%)
- Race & ethnicity
- Black 76% White 15% Two or more races 5% Hispanic / Latino 3% Asian 2%
- Common ancestry
- Swiss 5% Hispanic 1% Romanian 1%
- Foreign-born
- 18% · Canada
- Languages at home
- 84% English-only · French/Haitian/Cajun 4% Spanish 3% Other Asian/Pacific 1%
Political lean MEDSL · Delaware
- 2024 margin
- Strong D (+23.7) · D 61.4% · R 37.6% · Other 1.0%
- 2008→2024 swing
- +2.3pp toward D · 2008: 21.4pp · 2024: 23.7pp
- All cycles
- 2024: D+23.7 2020: D+26.7 2016: D+22.0 2012: D+21.8 2008: D+21.4
Not yet ingested
- Civics
- —
Market trends
- HPI YoY
- ▼ -190.50%
- Current HPI
- 277.7034
- Rent YoY
- ▲ 13.10%
- Metro
- Philadelphia-Camden-Wilmington, PA-NJ-DE-MD
- State GDP YoY
- ▲ 1.68%
- F500 in state
- 34
Industry mix (Fortune 500 HQ in PA)
| Industry | F500 HQs | Revenue |
|---|---|---|
| Healthcare | 2 | $309B |
|
||
| Insurance | 2 | $27B |
|
||
| Telecommunications / Media | 1 | $124B |
|
||
| Industrial Distribution | 1 | $22B |
|
||
| Financial Services | 1 | $20B |
|
||
| Chemicals / Materials | 1 | $18B |
|
||
Price history
+927.8% since first listed13 events — show timeline
- 2026-05-19 Listed $185,000 BRIGHT MLS
- 2025-10-08 Rental Removed $1,900 BRIGHTMLS
- 2025-08-02 Price Changed $1,900 BRIGHTMLS
- 2025-07-02 Listed for Rent $2,000 BRIGHTMLS
- 2025-01-27 Listing Removed — BRIGHT MLS
- 2024-10-22 Price Changed $169,999 BRIGHT MLS
- 2024-09-27 Price Changed $175,000 BRIGHT MLS
- 2024-07-15 Listed $180,000 BRIGHT MLS
- 2023-11-20 Rental Removed $1,700 BRIGHTMLS
- 2023-11-10 Listed for Rent $1,700 BRIGHTMLS
- 2023-10-04 Sold (Public Records) $104,000 Public Records
- 1987-05-29 Sold (Public Records) $47,900 Public Records
- 1981-04-01 Sold (Public Records) $18,000 Public Records
Property tax history
+2.7%/yrLatest (2026): $3,448 · -5.9% YoY. Source: county tax records.
Cash-flow waterfall
monthlySold comps — $/sqft
last 12 mo · ≤1 miLoading sold comps…