 🏗️ New Construction
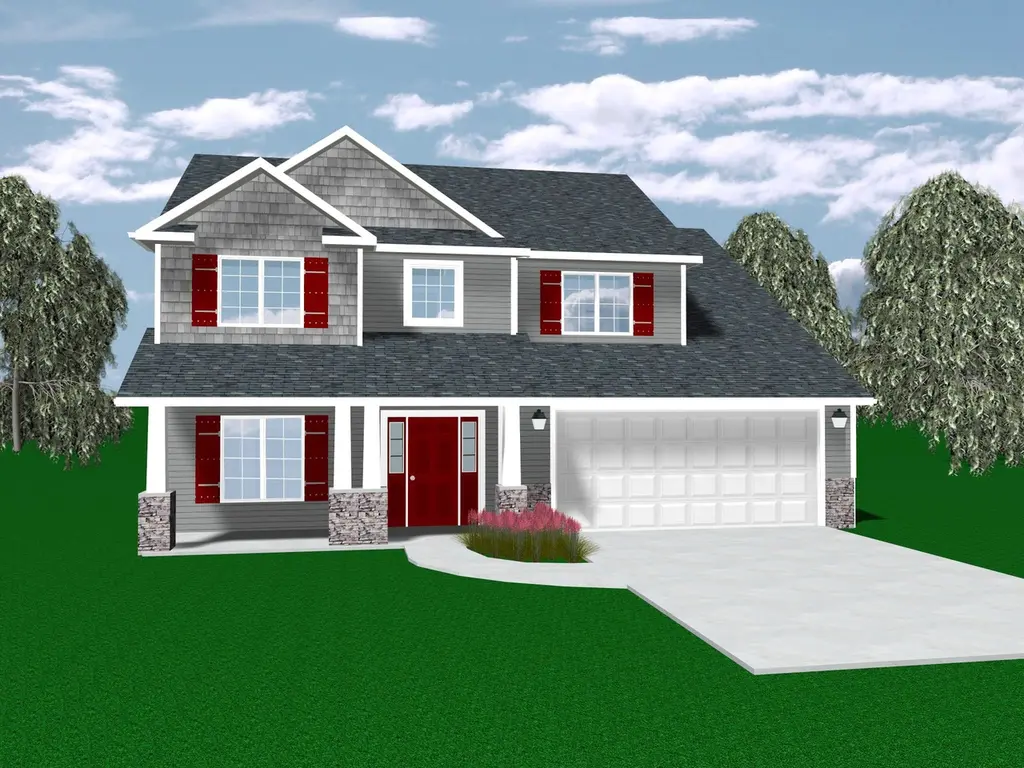
Lancia's Trenton I Plan · Fort Wayne, IN
Flood risk No data
- FEMA flood zone
- —
- Chance of flooding over 30 yrs
- —
- Est. flood insurance / yr
- —
Fire risk No data
- Est. fire insurance / yr
- —
Heat risk No data
- Hot days now (above threshold)
- —
- Hot days in 30 yrs
- —
Wind risk No data
- Chance of severe wind over 30 yrs
- —
Air-quality risk No data
- Unhealthy air days now
- —
- Unhealthy air days in 30 yrs
- —
Risk factors via First Street. Map © Google.
Why this score? — see what drove the F grade
The composite is a weighted blend of 9 inputs, each scored 0–100. Each bar is that input's sub-score; the figure is the points it added to the 100-point composite (weight × sub-score).
- ARV discount +7.5/15.0
- Cash flow +5.3/30.0
- Condition / age +4.8/5.0
- Rent growth +4.4/5.0
- Livability +4.2/5.0
- Schools +2.2/10.0
- 1% rule +1.1/10.0
- DSCR +0.0/10.0
- Appreciation +0.0/10.0
$262,400
🖨 Deal sheet (PDF) 📄 Offer letter ✓ Due diligence
Listing remarks MLS
THIS IS A SAMPLE PLAN - THIS IS NOT A HOME FOR SALE. Lancia's Trenton I has choice of Elevation A or B (B at an additional cost) with coordinating upstairs. 3 Bedrooms plus Loft! Switchback staircase. Office or Bonus Room off Foyer with french doors. Craftsman columns, shakes, and stone on elevation. Kitchen has a corner pantry and straight island with breakfast bar facing the Great Room. This home can be upgraded with a large walk-in attic with a steel door, entrance next to Main Bath! A full basement is available. * Base price does not include land
Key facts
- Corner pantry
- Full basement
- Walk-in attic
Tags
Neighborhood map
What this means for you Summary
Snapshot
- This is a 3-bed/2.5-bath single-family listed at $262k. Condition is rated excellent.
Deal economics
- At list price, monthly cash flow is $-737 ($-9k/yr) — negative.
- To cash-flow at today's rent, offer at most $223k (15.1% below list).
- To meet the 1% rule (rent ≥ 1% of price), the offer needs to be $200k (23.8% below list).
- Recommended offer: $200k (23.8% below list) — sets the bar for 1% rule.
- Cap rate 3.6% vs local median 4.8% in Fort Wayne — below-typical yield; the buyer is paying a premium for something (appreciation thesis, condition, location) that the cap rate doesn't capture.
Location & tenants
- Location reads 84/100 on livability (#6 in IN, #676 nationally) — a professional / high-income tenant draw. Strengths: amenities A+, commute A+, cost of living A+; Watch: crime C-, employment D+.
- Fort Wayne Community Schools (urban): math 22% / reading 29% proficiency, ranked #263 of 301 in IN (top 87%) — low school quality limits family demand, transient renter base, plan for 1-2y turnover; 60% free/reduced lunch — lower-income household profile, screen leases tightly.
- Zoned schools: Washington Center Elementary Sch (math 33% / reading 21%, grade F, #737 of 994 statewide, top 76%, 517 students, 62% FRL); Shawnee Middle School (math 11% / reading 22%, grade F, #287 of 330 statewide, top 88%, 675 students, 65% FRL); Northrop High School (math 25% / reading 62%, grade F, #191 of 369 statewide, top 52%, 2,136 students, 54% FRL) — zoned schools at 60% FRL track the district average.
- Market conditions: Rents rising fast (+7.6%/yr); 329 active listings in the ZIP; 3 comparable units currently listed for rent nearby; rentals at typical pace (median 16d on market — plan ~3-4 weeks tenant-placement turnaround); solid renter incomes; 1,861 units permitted in Allen County in 2024 (576 in 5+ unit buildings).
Forward outlook
- Local home prices are declining (-3.0%/yr); year-one equity from $2k of loan paydown is wiped out by about $10k of value loss. Plan a longer hold.
- Allen County population projected at +10% by 2050 — modest demand growth; plan on rents tracking national, not racing it.
Negotiation context
- It's been on market 303 days — a 12% lower offer ($231k) is reasonable based on typical stale-listing flexibility.
Questions for the listing agent
- What do current leases actually rent for vs. the listed asking? Can we see a recent rent roll and the last 12 months of T-12 income?
- It's been on market 303 days. Have you received any prior offers? Is the seller open to a 24% concession, seller financing, or rate buy-down credit?
- What does the HOA fee cover, when was the last increase, and are there any pending special assessments or reserve-fund shortfalls?
- Why hasn't it sold? Are there any deal-killer items the seller is aware of (foundation, flood, title, zoning, code violations)?
- Is there a deadline driving the sale (1031 exchange, divorce, estate, relocation)? That informs how much negotiation room exists.
- Schools are D-rated, which usually means shorter tenancies and higher turnover. Who's the typical renter profile here, and what's been the actual vacancy rate?
- The area grade is low — what's the realistic commute time and amenity access for the typical tenant pool here? Any planned neighborhood developments (good or bad) we should know about?
- What's the average days-on-market for RENTAL listings here right now (not sales)? A rising rental-DOM trend means longer vacancies and softer asking-rent achievability than the comps imply.
- What's the recent tenant-quality profile in this submarket — average credit score on applications, eviction rate, late-payment / NSF rate, and stable-employment percentage? A property-management company in the area should have these aggregated.
- How much new for-sale + rental construction is in the pipeline within 1–3 miles? Heavy new supply typically softens prices + rents 12–24 months out; constrained supply supports both.
Investment metrics
- 1% rule
- 0.61% ✗
- Cap rate
- 3.61%
- Cash-on-cash
- -9.59%
- DSCR
- 0.57
- GRM
- 13.7
CMA / ARV
- ARV (median comp)
- $329,321
- List price
- $262,400
- Delta
- -20.32%
- Verdict
- UNDERPRICED
- Comps
- 20 within 1.0 mi
Show comp detail 12 sales within ~0.75 mi
| Address | Dist | Beds/Ba | Sqft | Sold | Price | $/sf | Match |
|---|---|---|---|---|---|---|---|
| 8424 Kenny Ct | 0.05mi | 4/2.5 (+1) | 1,972 (+3%) | 12mo | $339,360 | $172 | 78 |
| 3832 Bradley Dr | 0.18mi | 4/2.5 (+1) | 2,053 (+7%) | 3mo | $330,000 | $161 | 72 |
| 3978 Shadowood Lakes Trl | 0.08mi | 4/2.5 (+1) | 1,767 (-8%) | 12mo | $309,900 | $175 | 68 |
| 4161 Bradley Dr | 0.23mi | 4/2.5 (+1) | 2,051 (+7%) | 6mo | $294,500 | $144 | 68 |
| 4106 Shadowood Lakes Trl | 0.18mi | 3/2.0 | 1,710 (-11%) | 5mo | $347,807 | $203 | 67 |
| 3605 Beck Ct | 0.37mi | 4/2.5 (+1) | 2,053 (+7%) | 2mo | $319,450 | $156 | 64 |
| 3856 Bradley Dr | 0.18mi | 4/2.0 (+1) | 1,771 (-8%) | 9mo | $299,900 | $169 | 64 |
| 3802 Bradley Dr | 0.18mi | 4/2.0 (+1) | 1,771 (-8%) | 10mo | $334,900 | $189 | 64 |
| 3705 Beck Ct | 0.34mi | 4/2.0 (+1) | 1,771 (-8%) | 3mo | $319,900 | $181 | 62 |
| 8168 Carlie Ct | 0.22mi | 4/2.0 (+1) | 1,771 (-8%) | 10mo | $304,115 | $172 | 62 |
| 3557 Beck Ct | 0.39mi | 4/2.0 (+1) | 1,771 (-8%) | 1mo | $312,430 | $176 | 61 |
| 4525 Laghi Pass | 0.39mi | 4/2.5 (+1) | 2,142 (+12%) | 2mo | $350,000 | $163 | 56 |
Match score weights: distance 35% · size 25% · config 20% · recency 20%. Top-matched comps best support the ARV.
Projected returns pro-forma
-3.0% appreciation · 7.64% rent growth · sell at horizon
- IRR
- -28.4%
- Equity multiple
- 0.02×
- Total profit
- $-90,483
- Equity at exit
- $49,103
- IRR
- -15.2%
- Equity multiple
- -0.03×
- Total profit
- $-94,875
- Equity at exit
- $28,474
Cash invested: $92,210 (down + closing). Projections, not guarantees.
Landlord ↔ Tenant lean methodology
- Overall (STATE)
- 90 Strongly Landlord-Friendly
- State Indiana
- 90 Strongly Landlord-Friendly · R+11
- County
- — inherits STATE
- City
- — inherits STATE
ZIP-level market 46818
- Rents YoY
- 7.6%
- Active inventory
- 329
- Price-to-rent
- 10.9×
Monthly cashflow live
- Estimated rent
- $2,000 medium interval (Pro) →
- Mortgage (P&I)
- −$1,727
- Tax est. 1.5%
- −$412 /mo · $4,940/yr
- Insurance
- −$137
- HOA
- −$41
- Vacancy / Maint / Mgmt
- −$420
- Net cashflow
- $-737
Break-even live
Sensitivity live
| Price | -10% $-510 | -5% $-623 | +0% $-737 | +5% $-851 | +10% $-965 |
|---|---|---|---|---|---|
| Rent | -10% $-895 | -5% $-816 | +0% $-737 | +5% $-658 | +10% $-579 |
| Rate | -1.0pp $-571 | -0.5pp $-653 | base $-737 | +0.5pp $-822 | +1.0pp $-909 |
UW: 25.0% down · 7.5% · 30yr · 1.5% tax · 5.0% vac · 8.0% maint · 8.0% mgmt
Financing live
Cash to close
- Down payment
- $82,330
- Closing costs
- $9,880
- Reserves months
- —
- Total cash needed
- —
Loan-product check · same deal, 3 products live
Conventional
25% down · 7.5% · 30yr
- Down + closing
- —
- Monthly P&I
- —
- Monthly cashflow
- —
- DSCR
- —
- Eligible?
- —
Personal DTI + credit; lowest rate.
DSCR
20% down · 8.5% · 30yr
- Down + closing
- —
- Monthly P&I
- —
- Monthly cashflow
- —
- DSCR
- —
- Eligible?
- —
No personal income docs; deal must DSCR.
Hard money
10% down · 12.0% · 12mo
- Down + closing
- —
- Monthly P&I
- —
- Monthly cashflow
- —
- DSCR
- —
- Eligible?
- —
Short-term bridge; refi at stabilization.
Rent comps 3 comps
| Address | Beds | Baths | Sqft | Rent | $/sqft | DOM | Units | Dist |
|---|---|---|---|---|---|---|---|---|
| 3782 Thunderhawk Pass Fort Wayne, IN | 3.0 | 2.0 | 1464 | $2,095 | $1.43 | 15d | 5 | 0.49mi |
| 13244 Etta DR Fort Wayne, IN | 3.0 | 2.5 | 1330 | $1,700 | $1.28 | 45d | 1 | 0.89mi |
| 7211 Carrington Blvd Fort Wayne, IN | 3.0 | 2.0 | 1568 | $1,399 | $0.89 | 15d | 1 | 0.99mi |
HOA detail
- Monthly dues
- $41 · $492/yr
Listing history 17 events
-
2026-06-22days on market $262,400 Active 303 DOM
-
2026-06-18days on market $262,400 Active 300 DOM
-
2026-06-17days on market $262,400 Active 299 DOM
-
2026-06-16days on market $262,400 Active 298 DOM
-
2026-06-15days on market $262,400 Active 297 DOM
-
2026-06-14days on market $262,400 Active 295 DOM
-
2026-06-10days on market $262,400 Active 292 DOM
-
2026-06-09days on market $262,400 Active 291 DOM
-
2026-06-08days on market $262,400 Active 290 DOM
-
2026-06-07days on market $262,400 Active 289 DOM
-
2026-06-03days on market $262,400 Active 285 DOM
-
2026-06-02pricedays on market $262,400 Active 284 DOM
-
2026-06-01days on market $257,200 Active 283 DOM
-
2026-05-31days on market $257,200 Active 282 DOM
-
2026-05-30days on market $257,200 Active 281 DOM
-
2026-02-09price $257,200 556-char remark
Show marketing remark (556 chars)
THIS IS A SAMPLE PLAN - THIS IS NOT A HOME FOR SALE. Lancia's Trenton I has choice of Elevation A or B (B at an additional cost) with coordinating upstairs. 3 Bedrooms plus Loft! Switchback staircase. Office or Bonus Room off Foyer with french doors. Craftsman columns, shakes, and stone on elevation. Kitchen has a corner pantry and straight island with breakfast bar facing the Great Room. This home can be upgraded with a large walk-in attic with a steel door, entrance next to Main Bath! A full basement is available. * Base price does not include land
-
2025-08-22$255,100 Active 556-char remark
Show marketing remark (556 chars)
THIS IS A SAMPLE PLAN - THIS IS NOT A HOME FOR SALE. Lancia's Trenton I has choice of Elevation A or B (B at an additional cost) with coordinating upstairs. 3 Bedrooms plus Loft! Switchback staircase. Office or Bonus Room off Foyer with french doors. Craftsman columns, shakes, and stone on elevation. Kitchen has a corner pantry and straight island with breakfast bar facing the Great Room. This home can be upgraded with a large walk-in attic with a steel door, entrance next to Main Bath! A full basement is available. * Base price does not include land
ⓘ Source: listings_history table (triggers on properties + properties_extension) + one-shot
backfill from property_details.listing_events for pre-trigger history.
Nearby sold comps map
Loading sold comps map…
Walkable amenities ~0.75 mi
Loading nearby amenities…
Taxation est. · year 1
- Rental income
- $23,996
- − Mortgage interest
- −$18,447
- − Property taxes
- −$4,940
- − Insurance
- −$1,647
- − Repairs & maintenance
- −$1,920
- − Management
- −$1,920
- − HOA
- −$492
- − Depreciation
- −$9,580
- Taxable loss
- −$14,949
- Est. tax savings @ 24.0%
- +$3,588
- After-tax cash flow
- $-5,257/yr
For passive investors: Depreciation is non-cash, so a rental often shows a tax loss while cash-flowing — sheltering income. Rental losses are passive: they offset passive income freely, and up to $25,000/yr can offset ordinary (W-2) income if you actively participate and your MAGI is under $100k (phasing out to $0 by $150k); unused losses carry forward. On sale, claimed depreciation is recaptured at up to 25%, and gains may owe capital-gains tax (a 1031 exchange can defer both). Figures are a year-1 estimate at your 24.0% rate — not tax advice; consult a CPA.
Condition & rehab AI · 13 photos
This home is in excellent condition with a craftsman-style exterior and modern interiors. It is move-in ready and would benefit from minor updates to enhance its curb appeal and resale value.
Value-add opportunities
- Resale Painting exterior shutters — Enhances curb appeal
- Resale Re-carpeting living room — Freshens up the space
- Resale Upgrading kitchen appliances — Modernizes the kitchen
Renovation cost estimate screening
Value-add ROI direction
- Resale Painting exterior shutters — Enhances curb appeal ↑
- Resale Re-carpeting living room — Freshens up the space ↑
- Resale Upgrading kitchen appliances — Modernizes the kitchen ↑
ⓘ Cost ranges are severity-bucket heuristics (US national rule-of-thumb). Get contractor quotes + a written scope before underwriting a rehab budget.
Schools (NCES district)
- District
- Fort Wayne Community Schools
- NCES district ID
- 1803630
- Math proficiency
- 22% ▼ -11.00%
- Reading proficiency
- 29% ▼ -7.00%
- Median HH income
- $41,951
- Composite
- 21.68/100
- National rank
- #8275
- State rank
- #263 of 301 in IN
Livability — Fort Wayne
- Score
- 84/100
- State rank
- #6
- US rank
- #676
Category grades
Schools grade is shown separately in the Schools card above.
Census & demographics
- County
- Allen County · 326,813 people
- City population
- 326,813
- Metro
- Fort Wayne, IN
- Population (ZIP)
- 21,954
- Household income
- $81,066
- Rent vs Own
- Severe rent burden
- 101.0
Population outlook (Allen County) Hauer SSP2
- Today (2025)
- 394,020 people
- By 2030
- 405,128 · +2.8%
- By 2040
- 423,476 · +7.5%
- By 2050
- 435,137 · +10.4%
- By 2075
- 450,293 · +14.3%
- By 2100
- 424,101 · +7.6%
Race, ethnicity, and origin ACS 2023
- Neighborhood character
- Predominantly White (79%)
- Race & ethnicity
- White 79% Two or more races 8% Hispanic / Latino 7% Black 4% Asian 3%
- Hispanic origin (detail)
- Mexican 6%
- Common ancestry
- Italian 4% Slovak 3% Romanian 2%
- Foreign-born
- 8% · Canada, Vietnam, Philippines
- Languages at home
- 90% English-only · Spanish 4% Other Asian/Pacific 1% Vietnamese 1%
Political lean MEDSL · Allen
- 2024 margin
- R (+12.5) · D 42.9% · R 55.4% · Other 1.7%
- 2008→2024 swing
- -8.1pp toward R · 2008: -4.3pp · 2024: -12.5pp
- All cycles
- 2024: R+12.5 2020: R+11.2 2016: R+19.6 2012: R+16.8 2008: R+4.3
Not yet ingested
- Civics
- —
Market trends
- HPI YoY
- ▼ -217.71%
- Current HPI
- 228.1539
- Rent YoY
- ▲ 7.64%
- Metro
- Fort Wayne, IN
- State GDP YoY
- ▲ 2.90%
- F500 in state
- 18
Industry mix (Fortune 500 HQ in IN)
| Industry | F500 HQs | Revenue |
|---|---|---|
| Industrial Machinery | 2 | $37B |
|
||
| Healthcare | 1 | $177B |
|
||
| Pharmaceuticals | 1 | $45B |
|
||
| Metals / Steel | 1 | $18B |
|
||
| Agriculture | 1 | $17B |
|
||
| Packaging | 1 | $12B |
|
||
Price history
+0.8% since first listed2 events — show timeline
- 2026-02-09 Price Changed $257,200 Zillow
- 2025-08-22 Listed $255,100 Zillow
Cash-flow waterfall
monthlySold comps — $/sqft
last 12 mo · ≤1 miLoading sold comps…