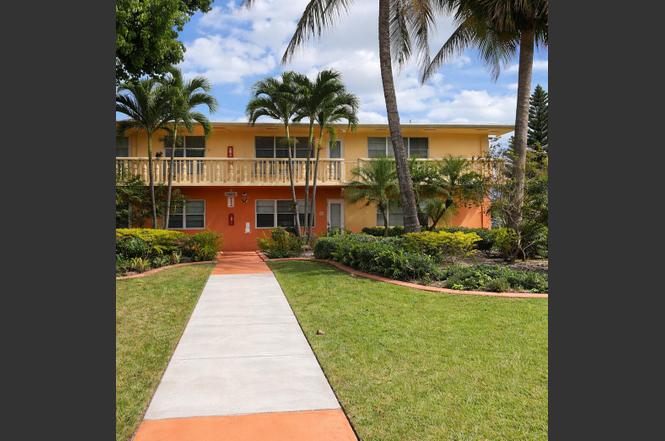
210 Salisbury I · Schall Circle, FL
Flood risk 1/10 · Minimal
- FEMA flood zone
- X (unshaded)
- Chance of flooding over 30 yrs
- 0.0%
- Est. flood insurance / yr
- $507 – $1,088
Fire risk 2/10 · Minimal
- Est. fire insurance / yr
- $947 – $1,759
Heat risk 10/10 · Severe
- Hot days now (above 105°F)
- 7 days/yr
- Hot days in 30 yrs
- 25 days/yr
Wind risk 10/10 · Severe
- Chance of severe wind over 30 yrs
- 99.0%
Air-quality risk 2/10 · Minimal
- Unhealthy air days now
- 1 days/yr
- Unhealthy air days in 30 yrs
- 1 days/yr
Risk factors via First Street. Map © Google.
Why this score? — see what drove the C grade
The composite is a weighted blend of 9 inputs, each scored 0–100. Each bar is that input's sub-score; the figure is the points it added to the 100-point composite (weight × sub-score).
- Cash flow +19.5/30.0
- 1% rule +10.0/10.0
- ARV discount +7.5/15.0
- DSCR +6.2/10.0
- Schools +4.3/10.0
- Livability +3.1/5.0
- Rent growth +2.5/5.0
- Condition / age +2.5/5.0
- Appreciation +0.0/10.0
$79,500
🖨 Deal sheet 📄 Offer letter ✓ Due diligence
Listing remarks
Welcome to 210 Salisbury I in West Palm Beach, a well-maintained 2-bedroom, 1-bath condo located in a peaceful 55+ senior living community. This bright and comfortable unit offers a functional layout with plenty of natural light and a relaxing atmosphere perfect for easy living. Enjoy access to community amenities, social activities, and an environment designed for comfort and convenience. Ideally located near shopping, dining, and just a short drive to the beach. A great opportunity to enjoy the Florida lifestyle in a welcoming senior community.
Key facts
- Great natural light
- New flooring
- Ample closet space
Tags
Property features AI
Finance
- HOA & community: Monthly HOA fee ($648) covering grounds maintenance; Has an association; Senior community; Pets not allowed
Exterior
- Parking: 1 parking space; No carport
- Utilities: Public water; Public sewer; Electricity available; Sewer available
- Home design: Condominium; One level (unit); Faces north; 2 total stories in building
- Construction: Composition roof; Other construction materials; Resale condition; Built prior to public-record living area of 816
- Exterior features: Not waterfront; Association-maintained grounds
Interior
- Bedrooms: 1 bedroom on the main level
- Flooring: Vinyl
- Bathrooms: 2 total bathrooms (1 full)
- Heating & cooling: Central heating; Wall/window air conditioning units
- Interior features: Refrigerator included; Vinyl flooring
Neighborhood map
What this means for you Summary
Snapshot
- This is a 2-bed/1.0-bath condo listed at $80k.
Deal economics
- At list price, monthly cash flow is $90 ($1k/yr) — positive.
- The deal already cash-flows at list — no discount required.
- Meets the 1% rule at list price ($2k rent vs $80k).
- Recommended offer: $75k (6.0% below list) — sets the bar for market timing.
Location & tenants
- Location reads 62/100 on livability (#762 in FL) — a middle-class / working-renter tenant base. Strengths: housing A, cost of living A-; Watch: schools D+, amenities F, commute F.
- Palm Beach (suburban): math 46% / reading 53% proficiency, ranked #34 of 73 in FL (top 47%) — families likely to look elsewhere, expect single-tenant / working-renter base with shorter leases.
- Market conditions: Rents flat; 473 active listings in the ZIP; 40 comparable units currently listed for rent nearby; rentals at typical pace (median 25d on market — plan ~3-4 weeks tenant-placement turnaround); 3,974 units permitted in Palm Beach County in 2024 (1,012 in 5+ unit buildings).
- This rent runs 37% of the median local income ($52k/yr) — at the standard rent-burdened threshold; future hikes will face affordability resistance.
Forward outlook
- Local home prices are declining (-3.0%/yr); year-one equity from $550 of loan paydown is wiped out by about $2k of value loss. Plan a longer hold.
- Palm Beach County population projected at +30% by 2050 — long-run rental-demand tailwind backs the buy-and-hold thesis.
Negotiation context
- It's been on market 86 days — a 6% lower offer ($75k) is reasonable based on typical stale-listing flexibility.
- 7 sale attempts since 26y ago; this cycle's ask has dropped $5k (6%) from the opening price — seller is motivated, your offer sets the floor, not the list.
- Current owner paid $26k; list at $80k implies a 208% gain — meaningful room to come down on a strong offer.
Risks & watch-outs
- Watch-outs: HOA is 41% of rent.
- Climate carrying-cost: severe wind risk, 99% chance of damaging wind over 30y; extreme-heat days projected 7→25/yr by 2055 (HVAC capex compounding) — expect insurance premiums to compound above CPI over the hold.
Questions for the listing agent
- It's been on market 86 days. Have you received any prior offers? Is the seller open to a 6% concession, seller financing, or rate buy-down credit?
- Built in 1969 — when were the roof, HVAC, electrical panel, plumbing, and water heater last replaced?
- What does the HOA fee cover, when was the last increase, and are there any pending special assessments or reserve-fund shortfalls?
- Any open or pending special assessments — roof, HVAC, plumbing, elevator, façade? What's the per-unit balance and payoff schedule, and is the seller paying it off at close or rolling it to the buyer?
- Why hasn't it sold? Are there any deal-killer items the seller is aware of (foundation, flood, title, zoning, code violations)?
- Is there a deadline driving the sale (1031 exchange, divorce, estate, relocation)? That informs how much negotiation room exists.
- Schools are D-rated, which usually means shorter tenancies and higher turnover. Who's the typical renter profile here, and what's been the actual vacancy rate?
- What's the average days-on-market for RENTAL listings here right now (not sales)? A rising rental-DOM trend means longer vacancies and softer asking-rent achievability than the comps imply.
- What's the recent tenant-quality profile in this submarket — average credit score on applications, eviction rate, late-payment / NSF rate, and stable-employment percentage? A property-management company in the area should have these aggregated.
- How much new apartment / multifamily construction is in the pipeline within 1–3 miles? Heavy new supply (>2% of stock underway) typically softens rents 12–24 months out; light construction supports rent growth.
Investment metrics
- 1% rule
- 1.98% ✓
- Cap rate
- 7.65%
- Cash-on-cash
- 4.85%
- DSCR
- 1.22
- GRM
- 4.2
CMA / ARV
No comps found within radius.
Projected returns pro-forma
-3.0% appreciation · 0.02% rent growth · sell at horizon
- IRR
- -15.1%
- Equity multiple
- 0.49×
- Total profit
- $-11,334
- Equity at exit
- $11,854
- IRR
- -23.3%
- Equity multiple
- 0.16×
- Total profit
- $-18,589
- Equity at exit
- $6,874
Cash invested: $22,260 (down + closing). Projections, not guarantees.
Landlord ↔ Tenant lean methodology
- Overall (STATE)
- 87 Strongly Landlord-Friendly
- State Florida
- 87 Strongly Landlord-Friendly · R+3
- County
- — inherits STATE
- City
- — inherits STATE
ZIP-level market 33417
- Home prices YoY
- -29.2%
- Rents YoY
- 0.0%
- Active inventory
- 473
- Price-to-rent
- 4.2×
Monthly cashflow live
- Estimated rent
- $1,573 high interval (Pro) →
- Mortgage (P&I)
- −$417
- Tax from tax record
- −$54 /mo · $653/yr
- Insurance
- −$33
- HOA
- −$648
- Vacancy / Maint / Mgmt
- −$330
- Net cashflow
- $90
Break-even live
UW: 25.0% down · 7.5% · 30yr · 1.5% tax · 5.0% vac · 8.0% maint · 8.0% mgmt
Financing live
Cash to close
- Down payment
- $19,875
- Closing costs
- $2,385
- Reserves months
- —
- Total cash needed
- —
Loan-product check · same deal, 3 products live
Conventional
25% down · 7.5% · 30yr
- Down + closing
- —
- Monthly P&I
- —
- Monthly cashflow
- —
- DSCR
- —
- Eligible?
- —
Personal DTI + credit; lowest rate.
DSCR
20% down · 8.5% · 30yr
- Down + closing
- —
- Monthly P&I
- —
- Monthly cashflow
- —
- DSCR
- —
- Eligible?
- —
No personal income docs; deal must DSCR.
Hard money
10% down · 12.0% · 12mo
- Down + closing
- —
- Monthly P&I
- —
- Monthly cashflow
- —
- DSCR
- —
- Eligible?
- —
Short-term bridge; refi at stabilization.
Rent comps 40 comps
| Address | Beds | Baths | Sqft | Rent | $/sqft | DOM | Units | Dist |
|---|---|---|---|---|---|---|---|---|
| 110 Stratford N West Palm Beach, FL | 1.0 | 1.5 | 740 | $1,600 | $2.16 | 19d | 1 | 0.35mi |
| 149 Stratford N West Palm Beach, FL | 2.0 | 2.0 | 978 | $1,650 | $1.69 | 24d | 1 | 0.36mi |
| 75 Sheffield D Unit D West Palm Beach, FL | 2.0 | 1.5 | 798 | $1,600 | $2.01 | 2d | 1 | 0.39mi |
| 74 Sheffield D Unit D West Palm Beach, FL | 2.0 | 1.5 | 798 | $1,400 | $1.75 | 24d | 1 | 0.39mi |
| 294 Chatham S Unit O West Palm Beach, FL | 1.0 | 1.0 | 645 | $1,300 | $2.02 | 24d | 1 | 0.44mi |
| 358 Chatham R Unit R West Palm Beach, FL | 1.0 | 1.5 | 684 | $1,295 | $1.89 | 24d | 1 | 0.45mi |
| 358 Chatham R Unit R West Palm Beach, FL | 1.0 | 1.5 | 684 | $1,200 | $1.75 | 19d | 1 | 0.45mi |
| 144 Dorchester G West Palm Beach, FL | 2.0 | 1.5 | 798 | $1,700 | $2.13 | 12d | 1 | 0.51mi |
| 144 Dorchester G West Palm Beach, FL | 2.0 | 1.5 | 798 | $1,700 | $2.13 | 11d | 1 | 0.51mi |
| 150 Bedford E West Palm Beach, FL | 1.0 | 1.0 | 570 | $1,375 | $2.41 | 7d | 1 | 0.56mi |
| 163 Somerset H West Palm Beach, FL | 2.0 | 2.0 | 874 | $1,500 | $1.72 | 24d | 1 | 0.56mi |
| 51 Dorchester E Unit 51 West Palm Beach, FL | 1.0 | 1.0 | 570 | $1,400 | $2.46 | 24d | 1 | 0.57mi |
| 146 Somerset Cres Unit 146 West Palm Beach, FL | 2.0 | 2.0 | 874 | $2,000 | $2.29 | 21d | 1 | 0.57mi |
| 145 Dorchester E Unit 145 West Palm Beach, FL | 1.0 | 1.5 | 646 | $1,300 | $2.01 | 7d | 1 | 0.57mi |
| 79 Dorchester E Unit 79 West Palm Beach, FL | 2.0 | 1.5 | 798 | $1,500 | $1.88 | 24d | 1 | 0.59mi |
| 22 Andover a West Palm Beach, FL | 1.0 | 1.5 | 684 | $1,375 | $2.01 | 24d | 1 | 0.60mi |
| 34 Andover B West Palm Beach, FL | 1.0 | 1.0 | 532 | $1,250 | $2.35 | 7d | 1 | 0.62mi |
| 142 Kent I West Palm Beach, FL | 1.0 | 1.5 | 684 | $1,475 | $2.16 | 24d | 1 | 0.63mi |
| 100 Andover D West Palm Beach, FL | 1.0 | 1.5 | 684 | $1,400 | $2.05 | 24d | 1 | 0.64mi |
| 49 Cambridge B Unit B West Palm Beach, FL | 1.0 | 1.5 | 684 | $1,450 | $2.12 | 24d | 1 | 0.65mi |
| 49 Cambridge B Unit B West Palm Beach, FL | 1.0 | 1.5 | 684 | $1,350 | $1.97 | 3d | 1 | 0.65mi |
| 17 Cambridge a West Palm Beach, FL | 1.0 | 1.5 | 684 | $1,200 | $1.75 | 24d | 1 | 0.65mi |
| 132 Andover F Unit 132 West Palm Beach, FL | 1.0 | 1.5 | 684 | $1,400 | $2.05 | 24d | 1 | 0.65mi |
| 118 Kent H West Palm Beach, FL | 1.0 | 1.0 | 570 | $1,325 | $2.32 | 24d | 1 | 0.66mi |
| 222 Somerset L West Palm Beach, FL | 2.0 | 2.0 | 874 | $1,850 | $2.12 | 2d | 1 | 0.66mi |
| 311 Andover M Unit M West Palm Beach, FL | 1.0 | 1.5 | 684 | $1,400 | $2.05 | 24d | 1 | 0.67mi |
| 311 Andover M West Palm Beach, FL | 1.0 | 1.5 | 684 | $1,400 | $2.05 | 24d | 1 | 0.67mi |
| 107 Kent St Unit 107* West Palm Beach, FL | 1.0 | 1.0 | 570 | $1,500 | $2.63 | 24d | 1 | 0.68mi |
| 11 Cambridge E Unit 11 West Palm Beach, FL | 1.0 | 1.5 | 684 | $1,500 | $2.19 | 24d | 1 | 0.68mi |
| 330 Andover M Unit M West Palm Beach, FL | 2.0 | 1.5 | 798 | $1,600 | $2.01 | 17d | 1 | 0.68mi |
| 188 Cambridge H Unit H West Palm Beach, FL | 1.0 | 1.5 | 684 | $1,345 | $1.97 | 5d | 1 | 0.69mi |
| 325 Andover E West Palm Beach, FL | 1.0 | 1.0 | 532 | $1,450 | $2.73 | 24d | 1 | 0.70mi |
| 326 Andover E West Palm Beach, FL | 1.0 | 1.5 | 684 | $1,490 | $2.18 | 24d | 1 | 0.71mi |
| 105 E Wellington Dr #105 West Palm Beach, FL | 2.0 | 2.0 | 1062 | $1,850 | $1.74 | 24d | 1 | 0.71mi |
| 210 Canterbury E Unit 1 West Palm Beach, FL | 1.0 | 1.0 | 570 | $1,375 | $2.41 | 13d | 1 | 0.73mi |
| 1 Canterbury A Unit A West Palm Beach, FL | 2.0 | 1.5 | 798 | $1,595 | $2.00 | 24d | 1 | 0.73mi |
| 204 Canterbury I Unit I West Palm Beach, FL | 1.0 | 1.0 | 570 | $1,350 | $2.37 | 24d | 1 | 0.73mi |
| 50 Canterbury B West Palm Beach, FL | 1.0 | 1.5 | 774 | $1,250 | $1.61 | 14d | 1 | 0.73mi |
| 201 Canterbury I Unit I West Palm Beach, FL | 1.0 | 1.0 | 570 | $1,250 | $2.19 | 24d | 1 | 0.73mi |
| 175 Canterbury H #175 West Palm Beach, FL | 1.0 | 1.0 | 570 | $1,250 | $2.19 | 15d | 1 | 0.73mi |
HOA detail condo
- Monthly dues
- $648 · $7,776/yr
- Assessments
- None detected in remarks — confirm with the listing agent.
Listing history 36 events
-
2026-06-18days on market $79,500 Active 86 DOM
-
2026-06-17days on market $79,500 Active 85 DOM
-
2026-06-16days on market $79,500 Active 84 DOM
-
2026-06-15days on market $79,500 Active 83 DOM
-
2026-06-13days on market $79,500 Active 81 DOM
-
2026-06-09days on market $79,500 Active 77 DOM
-
2026-06-08days on market $79,500 Active 76 DOM
-
2026-06-07days on market $79,500 Active 75 DOM
-
2026-06-04days on market $79,500 Active 72 DOM
-
2026-06-03days on market $79,500 Active 71 DOM
-
2026-06-02days on market $79,500 Active 70 DOM
-
2026-06-01days on market $79,500 Active 69 DOM
-
2026-05-31days on market $79,500 Active 68 DOM
-
2026-05-11status Active
-
2026-05-01status Pending
-
2026-04-07price $79,500
-
2026-03-13$84,999 Active
-
2025-10-17historical
-
2025-10-13price $84,000
-
2025-10-07price $89,000
-
2025-09-23$99,000 Active
-
2021-04-23historical
-
2021-03-07$85,000 Active
-
2021-01-07historical
-
2020-11-19$85,000 Active
-
2017-02-08soldstatus $25,800 Closed
-
2017-02-07soldstatus $25,000
-
2017-01-04historical Contingent
-
2016-11-07price $34,000
-
2016-10-22price $49,000
-
2016-10-19$55,000 Active
-
2001-06-27soldstatus $14,900
-
2001-05-03historical
-
2000-04-25$14,900
-
1992-04-08soldstatus $23,000
-
1991-04-02soldstatus $25,000
ⓘ Source: listings_history table (triggers on properties + properties_extension) + one-shot
backfill from property_details.listing_events for pre-trigger history.
Tax reassessment forecast FL · Resets to sale price
- Current annual tax
- $653 · $54/mo
- Projected year-2 tax
- $660 · $55/mo
- Expected delta
- +$7/yr (+$1/mo · 1.0%)
ⓘ Screening estimate from a state-policy table — verify with the county assessor before closing.
Climate risk First Street
- Flood 1/10 Low FEMA zone X (unshaded) · 0% chance over 30 yrs
- Wildfire 2/10 Low
- Heat 10/10 Extreme 7 d/yr ≥105°F today · 25 d/yr by 30 yrs out
- Wind 10/10 Extreme 99% chance of damaging wind over 30 yrs
- Air quality 2/10 Low 1 unhealthy d/yr today · 1 by 30 yrs out
Nearby sold comps map
Loading sold comps map…
Walkable amenities ~0.75 mi
Loading nearby amenities…
Taxation est. · year 1
- Rental income
- $18,873
- − Mortgage interest
- −$4,453
- − Property taxes
- −$653
- − Insurance
- −$398
- − Repairs & maintenance
- −$1,510
- − Management
- −$1,510
- − HOA
- −$7,776
- − Depreciation
- −$2,313
- Taxable income
- $261
- Est. tax owed @ 24.0%
- −$63
- After-tax cash flow
- $1,018/yr
For passive investors: Depreciation is non-cash, so a rental often shows a tax loss while cash-flowing — sheltering income. Rental losses are passive: they offset passive income freely, and up to $25,000/yr can offset ordinary (W-2) income if you actively participate and your MAGI is under $100k (phasing out to $0 by $150k); unused losses carry forward. On sale, claimed depreciation is recaptured at up to 25%, and gains may owe capital-gains tax (a 1031 exchange can defer both). Figures are a year-1 estimate at your 24.0% rate — not tax advice; consult a CPA.
Schools (NCES district)
- District
- Palm Beach
- NCES district ID
- 1201500
- Math proficiency
- 46% ▼ -16.00%
- Reading proficiency
- 53% ▼ -4.00%
- Median HH income
- $53,943
- Composite
- 42.72/100
- National rank
- #3160
- State rank
- #34 of 73 in FL
Livability — Schall Circle
- Score
- 62/100
- State rank
- #762
- US rank
- #16849
Category grades
Schools grade is shown separately in the Schools card above.
Census & demographics
- County
- Palm Beach County · 1,438,312 people
- Metro
- Miami-Fort Lauderdale-Pompano Beach, FL
- Population (ZIP)
- 38,079
- Household income
- $51,605
- Rent vs Own
- Severe rent burden
- 2548.0
Population outlook (Palm Beach County) Hauer SSP2
- Today (2025)
- 1,637,487 people
- By 2030
- 1,743,255 · +6.5%
- By 2040
- 1,948,712 · +19.0%
- By 2050
- 2,132,979 · +30.3%
- By 2075
- 2,530,027 · +54.5%
- By 2100
- 2,706,979 · +65.3%
Race, ethnicity, and origin ACS 2023
- Neighborhood character
- Highly diverse neighborhood (Simpson 0.72)
- Race & ethnicity
- White 34% Black 30% Hispanic / Latino 27% Two or more races 16% Asian 3%
- Hispanic origin (detail)
- Mexican 3% Puerto Rican 6% Cuban 5% Dominican 2%
- Common ancestry
- Hispanic 10% Romanian 3% Scotch-Irish 1%
- Foreign-born
- 34% · Canada, Jamaica
- Languages at home
- 58% English-only · Spanish 24% French/Haitian/Cajun 11% Other Indo-European 3%
Political lean MEDSL · Palm Beach
- 2024 margin
- Toss-up / Even · D 50.0% · R 49.2%
- 2008→2024 swing
- -22.1pp toward R · 2008: 22.9pp · 2024: 0.8pp
- All cycles
- 2024: D+0.8 2020: D+12.8 2016: D+15.3 2012: D+17.0 2008: D+22.9
Not yet ingested
- Civics
- —
Market trends
- HPI YoY
- ▼ -138.62%
- Current HPI
- 335.8396
- Rent YoY
- ▬ 0.02%
- Metro
- Miami-Fort Lauderdale-Pompano Beach, FL
- State GDP YoY
- ▲ 3.28%
- F500 in state
- 36
Industry mix (Fortune 500 HQ in FL)
| Industry | F500 HQs | Revenue |
|---|---|---|
| Industrial Technology | 2 | $29B |
|
||
| Insurance | 2 | $17B |
|
||
| Retail | 1 | $60B |
|
||
| Technology Distribution | 1 | $58B |
|
||
| Homebuilding | 1 | $35B |
|
||
| Technology Manufacturing | 1 | $35B |
|
||
Price history
+218.0% since first listed23 events — show timeline
- 2026-05-11 Relisted — Beaches MLS
- 2026-05-01 Pending — Beaches MLS
- 2026-04-07 Price Changed $79,500 Beaches MLS
- 2026-03-13 Listed $84,999 Beaches MLS
- 2025-10-17 Listing Removed — Beaches MLS
- 2025-10-13 Price Changed $84,000 Beaches MLS
- 2025-10-07 Price Changed $89,000 Beaches MLS
- 2025-09-23 Listed $99,000 Beaches MLS
- 2021-04-23 Listing Removed — Beaches MLS
- 2021-03-07 Listed $85,000 Beaches MLS
- 2021-01-07 Listing Removed — Beaches MLS
- 2020-11-19 Listed $85,000 Beaches MLS
- 2017-02-08 Sold (MLS) $25,800 Beaches MLS
- 2017-02-07 Sold (Public Records) $25,000 Public Records
- 2017-01-04 Contingent — Beaches MLS
- 2016-11-07 Price Changed $34,000 Beaches MLS
- 2016-10-22 Price Changed $49,000 Beaches MLS
- 2016-10-19 Listed $55,000 Beaches MLS
- 2001-06-27 Sold (MLS) $14,900 Beaches MLS
- 2001-05-03 Listing Removed — Beaches MLS
- 2000-04-25 Listed $14,900 Beaches MLS
- 1992-04-08 Sold (Public Records) $23,000 Public Records
- 1991-04-02 Sold (Public Records) $25,000 Public Records
Property tax history
+8.4%/yrLatest (2025): $653 · +3.5% YoY. Source: county tax records.
Cash-flow waterfall
monthlySold comps — $/sqft
last 12 mo · ≤1 miLoading sold comps…