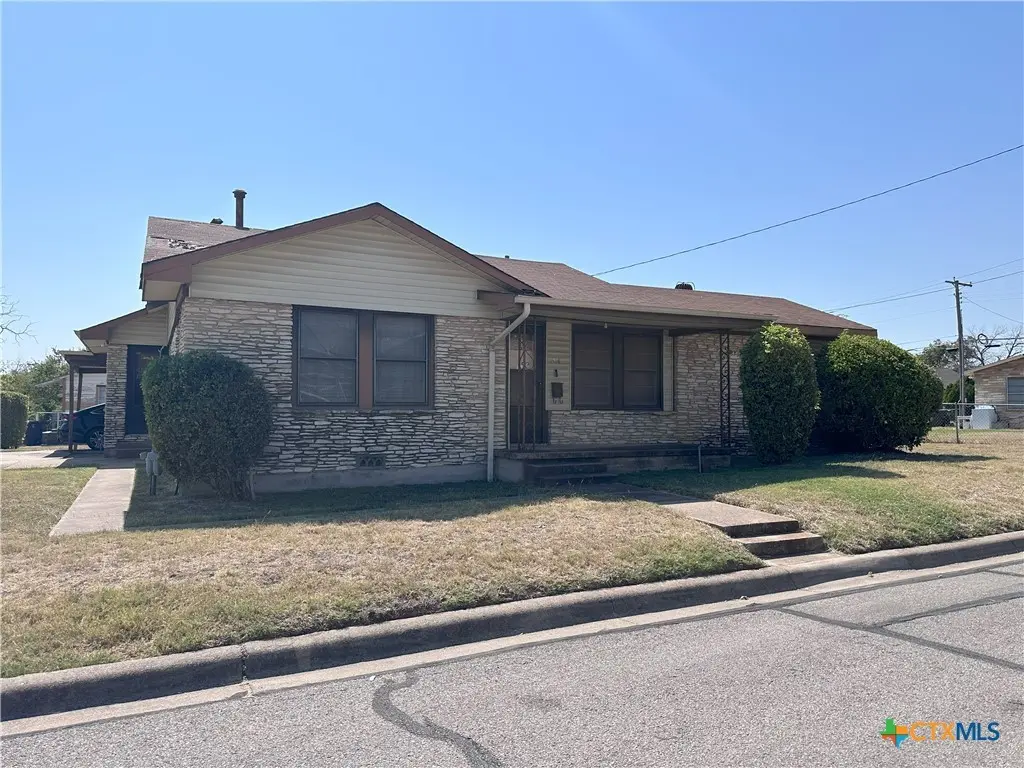
1014 Parmer Ave · Killeen, TX
Flood risk 1/10 · Minimal
- FEMA flood zone
- X (unshaded)
- Chance of flooding over 30 yrs
- 0.0%
- Est. flood insurance / yr
- $507 – $1,088
Fire risk 1/10 · Minimal
- Est. fire insurance / yr
- $1,222 – $2,270
Heat risk 8/10 · Major
- Hot days now (above 107°F)
- 7 days/yr
- Hot days in 30 yrs
- 25 days/yr
Wind risk 6/10 · Moderate
- Chance of severe wind over 30 yrs
- 58.0%
Air-quality risk 1/10 · Minimal
- Unhealthy air days now
- 0 days/yr
- Unhealthy air days in 30 yrs
- 0 days/yr
Risk factors via First Street. Map © Google.
Why this score? — see what drove the D grade
The composite is a weighted blend of 9 inputs, each scored 0–100. Each bar is that input's sub-score; the figure is the points it added to the 100-point composite (weight × sub-score).
- ARV discount +12.3/15.0
- Cash flow +7.9/30.0
- Appreciation +6.1/10.0
- 1% rule +3.2/10.0
- Livability +3.2/5.0
- Schools +3.0/10.0
- Condition / age +2.5/5.0
- DSCR +2.0/10.0
- Rent growth +2.0/5.0
$125,000
🖨 Deal sheet (PDF) 📄 Offer letter ✓ Due diligence
Listing remarks MLS
100% FINANCING AVAILABLE! Good curb appeal on this home built in 1937 with some charming touches of a home from this era. Two bedrooms but could use den as 3rd bedroom. Pretty paneling in den. 2 bathrooms. Large living room with built-in bookcases. Corner lot. New roof installed November 2024. Fenced backyard. Convenient to Fort Cavazos. Perfect for 1st time buyer or investor. Being sold “as is“.
Key facts
- Built in 1937
- Fenced backyard
- Corner lot
Tags
Neighborhood map
What this means for you Summary
Snapshot
- This is a 2-bed/2.0-bath single-family listed at $125k.
Deal economics
- At list price, monthly cash flow is $-132 ($-2k/yr) — negative.
- To cash-flow at today's rent, offer at most $102k (18.6% below list).
- To meet the 1% rule (rent ≥ 1% of price), the offer needs to be $102k (18.3% below list).
- Recommended offer: $102k (18.6% below list) — sets the bar for cash-flow.
- Cap rate 5.0% vs local median 3.9% in Killeen — top-decile yield for the area; either an underpriced asset or a hidden risk that comps aren't pricing in. Stress-test before assuming the spread holds.
Location & tenants
- Location reads 63/100 on livability (#853 in TX) — a middle-class / working-renter tenant base. Strengths: cost of living A+, housing A+; Watch: schools D+, amenities D, employment D.
- Killeen ISD (urban): math 31% / reading 38% proficiency, ranked #524 of 826 in TX (top 63%) — families likely to look elsewhere, expect single-tenant / working-renter base with shorter leases.
- Market conditions: Rents soft (-2.0%/yr); 123 active listings in the ZIP; 40 comparable units currently listed for rent nearby; rentals lingering (median 45d on market — plan ~5-8 weeks vacancy on turnover, expect pricing pressure); 55% of comp listings sitting > 30 days — soft ceiling on asking rent; lower-income renter base — watch delinquency; 3,222 units permitted in Bell County in 2024 (246 in 5+ unit buildings).
- This rent runs 33% of the median local income ($37k/yr) — at the standard rent-burdened threshold; future hikes will face affordability resistance.
Forward outlook
- In year one you build about $4k of equity ($864 loan paydown + $3k appreciation (2.3% local appreciation)).
- Bell County population projected at +21% by 2050 — long-run rental-demand tailwind backs the buy-and-hold thesis.
- By year 9, paydown + projected appreciation supports a ~$32k cash-out refi (75% LTV) — recoverable capital for the next deal without selling this one.
Negotiation context
- It's been on market 402 days — a 12% lower offer ($110k) is reasonable based on typical stale-listing flexibility.
- 2 sale attempts since 2y ago; this cycle's ask has dropped $15k (11%) from the opening price — seller is motivated, your offer sets the floor, not the list.
Risks & watch-outs
- Watch-outs: built in 1937 — expect roof / HVAC / electrical / plumbing capex.
- Climate carrying-cost: major wind risk, 58% chance of damaging wind over 30y; extreme-heat days projected 7→25/yr by 2055 (HVAC capex compounding) — expect insurance premiums to compound above CPI over the hold.
Questions for the listing agent
- What do current leases actually rent for vs. the listed asking? Can we see a recent rent roll and the last 12 months of T-12 income?
- It's been on market 402 days. Have you received any prior offers? Is the seller open to a 19% concession, seller financing, or rate buy-down credit?
- Built in 1937 — when were the roof, HVAC, electrical panel, plumbing, and water heater last replaced?
- Why hasn't it sold? Are there any deal-killer items the seller is aware of (foundation, flood, title, zoning, code violations)?
- Is there a deadline driving the sale (1031 exchange, divorce, estate, relocation)? That informs how much negotiation room exists.
- Schools are D-rated, which usually means shorter tenancies and higher turnover. Who's the typical renter profile here, and what's been the actual vacancy rate?
- Crime grade is D in this area — have there been break-ins, vandalism, or insurance claims at this property in the last 3 years? What carrier currently insures it and at what premium?
- The area grade is low — what's the realistic commute time and amenity access for the typical tenant pool here? Any planned neighborhood developments (good or bad) we should know about?
- What's the average days-on-market for RENTAL listings here right now (not sales)? A rising rental-DOM trend means longer vacancies and softer asking-rent achievability than the comps imply.
- What's the recent tenant-quality profile in this submarket — average credit score on applications, eviction rate, late-payment / NSF rate, and stable-employment percentage? A property-management company in the area should have these aggregated.
- How much new for-sale + rental construction is in the pipeline within 1–3 miles? Heavy new supply typically softens prices + rents 12–24 months out; constrained supply supports both.
Investment metrics
- 1% rule
- 0.82% ✗
- Cap rate
- 5.03%
- Cash-on-cash
- -4.51%
- DSCR
- 0.80
- GRM
- 10.2
CMA / ARV
- ARV (median comp)
- $139,854
- List price
- $125,000
- Delta
- -10.62%
- Verdict
- UNDERPRICED
- Comps
- 20 within 1.0 mi
Show comp detail 3 sales within ~0.75 mi
| Address | Dist | Beds/Ba | Sqft | Sold | Price | $/sf | Match |
|---|---|---|---|---|---|---|---|
| 507 Harbour Ave | 0.23mi | 3/2.0 (+1) | 1,478 (-1%) | 6mo | $130,000 | $88 | 77 |
| 701 Alexander St | 0.25mi | 3/2.0 (+1) | 1,630 (+9%) | 6mo | $142,000 | $87 | 63 |
| 1602 N 22nd St | 0.51mi | 3/2.0 (+1) | 1,276 (-15%) | 3mo | $196,000 | $154 | 44 |
Match score weights: distance 35% · size 25% · config 20% · recency 20%. Top-matched comps best support the ARV.
Projected returns pro-forma
2.26% appreciation · 0.0% rent growth · sell at horizon
- IRR
- -0.6%
- Equity multiple
- 0.97×
- Total profit
- $-1,070
- Equity at exit
- $51,080
- IRR
- 2.3%
- Equity multiple
- 1.31×
- Total profit
- $10,697
- Equity at exit
- $74,947
Cash invested: $35,000 (down + closing). Projections, not guarantees.
Landlord ↔ Tenant lean methodology
- Overall (STATE)
- 87 Strongly Landlord-Friendly
- State Texas
- 87 Strongly Landlord-Friendly · R+5
- County
- — inherits STATE
- City
- — inherits STATE
ZIP-level market 76541
- Home prices YoY
- 1.4%
- Rents YoY
- -2.0%
- Active inventory
- 123
- Price-to-rent
- 10.2×
Monthly cashflow live
- Estimated rent
- $1,021 high interval (Pro) →
- Mortgage (P&I)
- −$656
- Tax from tax record
- −$231 /mo · $2,768/yr
- Insurance
- −$52
- HOA
- −$0
- Vacancy / Maint / Mgmt
- −$214
- Net cashflow
- $-132
Break-even live
Sensitivity live
| Price | -10% $-61 | -5% $-96 | +0% $-132 | +5% $-167 | +10% $-202 |
|---|---|---|---|---|---|
| Rent | -10% $-212 | -5% $-172 | +0% $-132 | +5% $-91 | +10% $-51 |
| Rate | -1.0pp $-69 | -0.5pp $-100 | base $-132 | +0.5pp $-164 | +1.0pp $-197 |
UW: 25.0% down · 7.5% · 30yr · 1.5% tax · 5.0% vac · 8.0% maint · 8.0% mgmt
Financing live
Cash to close
- Down payment
- $31,250
- Closing costs
- $3,750
- Reserves months
- —
- Total cash needed
- —
Loan-product check · same deal, 3 products live
Conventional
25% down · 7.5% · 30yr
- Down + closing
- —
- Monthly P&I
- —
- Monthly cashflow
- —
- DSCR
- —
- Eligible?
- —
Personal DTI + credit; lowest rate.
DSCR
20% down · 8.5% · 30yr
- Down + closing
- —
- Monthly P&I
- —
- Monthly cashflow
- —
- DSCR
- —
- Eligible?
- —
No personal income docs; deal must DSCR.
Hard money
10% down · 12.0% · 12mo
- Down + closing
- —
- Monthly P&I
- —
- Monthly cashflow
- —
- DSCR
- —
- Eligible?
- —
Short-term bridge; refi at stabilization.
Rent comps 40 comps
| Address | Beds | Baths | Sqft | Rent | $/sqft | DOM | Units | Dist |
|---|---|---|---|---|---|---|---|---|
| 905 Parmer Ave Unit A Killeen, TX | 3.0 | 1.0 | 1672 | $750 | $0.45 | 44d | 1 | 0.07mi |
| 501 N 18th St Unit B Killeen, TX | 3.0 | 1.5 | 1286 | $1,250 | $0.97 | 24d | 1 | 0.11mi |
| 715 Cardinal Ave Killeen, TX | 3.0 | 1.0 | 1142 | $800 | $0.70 | 44d | 1 | 0.14mi |
| 1309 Greenwood Ave Killeen, TX | 3.0 | 1.0 | 925 | $900 | $0.97 | 22d | 1 | 0.24mi |
| 1108 Stewart St Killeen, TX | 3.0 | 1.0 | 995 | $1,150 | $1.16 | 24d | 1 | 0.35mi |
| 1204 N 18th St Unit B Killeen, TX | 3.0 | 2.0 | 1200 | $1,200 | $1.00 | 44d | 1 | 0.36mi |
| 508 Patton Dr Killeen, TX | 3.0 | 1.5 | 924 | $1,150 | $1.24 | 24d | 1 | 0.36mi |
| 705 Crockett Dr Killeen, TX | 3.0 | 1.0 | 1174 | $1,095 | $0.93 | 44d | 1 | 0.39mi |
| 1312 Carol Way Killeen, TX | 3.0 | 1.0 | 1221 | $1,100 | $0.90 | 14d | 1 | 0.42mi |
| 1015 N 10th St Unit B Killeen, TX | 3.0 | 2.0 | 1118 | $1,100 | $0.98 | 44d | 1 | 0.43mi |
| 1704 Smith Dr Killeen, TX | 2.0 | 1.0 | 925 | $1,000 | $1.08 | 44d | 1 | 0.50mi |
| 1703 Smith Dr Killeen, TX | 2.0 | 1.0 | 1176 | $900 | $0.77 | 24d | 1 | 0.51mi |
| 1701 Elkins Ave Killeen, TX | 3.0 | 1.0 | 918 | $1,000 | $1.09 | 14d | 1 | 0.54mi |
| 1206 Middleton St Killeen, TX | 2.0 | 1.0 | 1750 | $800 | $0.46 | 44d | 1 | 0.60mi |
| 1507 N 8th St Unit 8 Killeen, TX | 3.0 | 2.0 | 1116 | $995 | $0.89 | 24d | 1 | 0.65mi |
| 506 Powell St Killeen, TX | 3.0 | 1.0 | 1546 | $1,400 | $0.91 | 44d | 1 | 0.67mi |
| 209 West Avenue A Unit A Killeen, TX | 3.0 | 2.0 | 876 | $935 | $1.07 | 14d | 1 | 0.68mi |
| 1901 N 10th St Unit 3 Killeen, TX | 2.0 | 1.0 | 920 | $745 | $0.81 | 44d | 1 | 0.71mi |
| 710 Sutton Dr Killeen, TX | 1.0 | 1.0 | 1322 | $752 | $0.57 | 44d | 1 | 0.75mi |
| 1901 Poage Ave Killeen, TX | 2.0 | 1.0 | 1596 | $875 | $0.55 | 44d | 1 | 0.75mi |
| 1915 Poage Ave Killeen, TX | 2.0 | 1.0 | 875 | $850 | $0.97 | 44d | 1 | 0.77mi |
| 1111 N College St Unit B Killeen, TX | 3.0 | 2.0 | 1235 | $995 | $0.81 | 14d | 1 | 0.80mi |
| 724 Carrie Ave Killeen, TX | 3.0 | 1.0 | 1100 | $1,000 | $0.91 | 44d | 1 | 0.84mi |
| 2303 Debra Cir Killeen, TX | 3.0 | 1.5 | 1617 | $1,600 | $0.99 | 24d | 1 | 0.85mi |
| 424 W Green Ave Killeen, TX | 1.0 | 1.0 | 968 | $595 | $0.61 | 44d | 1 | 0.85mi |
| 505 W Church Ave Killeen, TX | 3.0 | 1.0 | 1160 | $1,100 | $0.95 | 14d | 1 | 0.86mi |
| 1203 N College St Unit 1203-207 Killeen, TX | 2.0 | 2.0 | 980 | $725 | $0.74 | 44d | 1 | 0.86mi |
| 801 S W S Young Dr Killeen, TX | 3.0 | 1.0–2.0 | 1027 | $1,760 | $1.71 | 14d | 12 | 0.88mi |
| 514 McArthur Dr Killeen, TX | 3.0 | 1.0 | 1084 | $995 | $0.92 | 44d | 1 | 0.89mi |
| 1809 N W S Young Dr Unit 1B Killeen, TX | 2.0 | 2.0 | 1200 | $1,050 | $0.88 | 44d | 1 | 0.95mi |
| 907 Wells St Killeen, TX | 3.0 | 1.0 | 1050 | $950 | $0.90 | 24d | 1 | 0.97mi |
| 717 Norris Ave Killeen, TX | 3.0 | 1.0 | 1118 | $1,000 | $0.89 | 44d | 1 | 1.00mi |
| 2504 Lake Rd Killeen, TX | 3.0 | 1.5 | 1454 | $1,295 | $0.89 | 14d | 1 | 1.06mi |
| 905 N Gilmer St Killeen, TX | 1.0–3.0 | 1.0–2.0 | 925 | $1,145 | $1.24 | 14d | 5 | 1.07mi |
| 805 W Kern Rd Unit 807 Killeen, TX | 3.0 | 1.0 | 1692 | $775 | $0.46 | 44d | 1 | 1.13mi |
| 2701 Stetson Ave #2703 Killeen, TX | 2.0 | 1.0 | 1536 | $800 | $0.52 | 44d | 1 | 1.14mi |
| 2218 Terrace Dr Killeen, TX | 3.0 | 2.0 | 1772 | $1,750 | $0.99 | 14d | 1 | 1.14mi |
| 2307 Terrace Dr Unit C Killeen, TX | 3.0 | 2.0 | 1203 | $850 | $0.71 | 14d | 1 | 1.15mi |
| 921 Mimosa St Killeen, TX | 1.0 | 1.0 | 1024 | $490 | $0.48 | 44d | 1 | 1.15mi |
| 118 E Fowler Ave Killeen, TX | 3.0 | 1.0 | 902 | $875 | $0.97 | 44d | 1 | 1.18mi |
Listing history 24 events
-
2026-06-18days on market $125,000 Active 402 DOM
-
2026-06-17days on market $125,000 Active 401 DOM
-
2026-06-16days on market $125,000 Active 400 DOM
-
2026-06-15days on market $125,000 Active 399 DOM
-
2026-06-14days on market $125,000 Active 397 DOM
-
2026-06-13days on market $125,000 Active 396 DOM
-
2026-06-10days on market $125,000 Active 394 DOM
-
2026-06-09days on market $125,000 Active 393 DOM
-
2026-06-08days on market $125,000 Active 392 DOM
-
2026-06-07days on market $125,000 Active 391 DOM
-
2026-06-03days on market $125,000 Active 387 DOM
-
2026-06-02days on market $125,000 Active 386 DOM
-
2026-06-01days on market $125,000 Active 385 DOM
-
2026-05-31days on market $125,000 Active 384 DOM
-
2026-05-30days on market $125,000 Active 383 DOM
-
2026-02-28price $125,000 411-char remark
Show marketing remark (411 chars)
100% FINANCING AVAILABLE! Good curb appeal on this home built in 1937 with some charming touches of a home from this era. Two bedrooms but could use den as 3rd bedroom. Pretty paneling in den. 2 bathrooms. Large living room with built-in bookcases. Corner lot. New roof installed November 2024. Fenced backyard. Convenient to Fort Cavazos. Perfect for 1st time buyer or investor. Being sold “as is“.
-
2025-07-15price $130,000 411-char remark
Show marketing remark (411 chars)
100% FINANCING AVAILABLE! Good curb appeal on this home built in 1937 with some charming touches of a home from this era. Two bedrooms but could use den as 3rd bedroom. Pretty paneling in den. 2 bathrooms. Large living room with built-in bookcases. Corner lot. New roof installed November 2024. Fenced backyard. Convenient to Fort Cavazos. Perfect for 1st time buyer or investor. Being sold “as is“.
-
2025-06-13price $135,000 411-char remark
Show marketing remark (411 chars)
100% FINANCING AVAILABLE! Good curb appeal on this home built in 1937 with some charming touches of a home from this era. Two bedrooms but could use den as 3rd bedroom. Pretty paneling in den. 2 bathrooms. Large living room with built-in bookcases. Corner lot. New roof installed November 2024. Fenced backyard. Convenient to Fort Cavazos. Perfect for 1st time buyer or investor. Being sold “as is“.
-
2025-05-12$140,000 Active 411-char remark
Show marketing remark (411 chars)
100% FINANCING AVAILABLE! Good curb appeal on this home built in 1937 with some charming touches of a home from this era. Two bedrooms but could use den as 3rd bedroom. Pretty paneling in den. 2 bathrooms. Large living room with built-in bookcases. Corner lot. New roof installed November 2024. Fenced backyard. Convenient to Fort Cavazos. Perfect for 1st time buyer or investor. Being sold “as is“.
-
2025-04-30historical
-
2025-03-21price $140,000
-
2025-01-17price $145,000
-
2024-10-11$150,000 Active
-
1974-05-17soldstatus
ⓘ Source: listings_history table (triggers on properties + properties_extension) + one-shot
backfill from property_details.listing_events for pre-trigger history.
Tax reassessment forecast TX · Resets to sale price
- Current annual tax
- $2,768 · $231/mo
- Projected year-2 tax
- $2,768 · $231/mo
- Expected delta
- $0/yr ($0/mo · 0.0%)
ⓘ Screening estimate from a state-policy table — verify with the county assessor before closing.
Climate risk First Street
- Flood 1/10 Low FEMA zone X (unshaded) · 0% chance over 30 yrs
- Wildfire 1/10 Low
- Heat 8/10 Severe 7 d/yr ≥107°F today · 25 d/yr by 30 yrs out
- Wind 6/10 Major 58% chance of damaging wind over 30 yrs
- Air quality 1/10 Low 0 unhealthy d/yr today · 0 by 30 yrs out
Nearby sold comps map
Loading sold comps map…
Walkable amenities ~0.75 mi
Loading nearby amenities…
Taxation est. · year 1
- Rental income
- $12,254
- − Mortgage interest
- −$7,002
- − Property taxes
- −$2,768
- − Insurance
- −$625
- − Repairs & maintenance
- −$980
- − Management
- −$980
- − Depreciation
- −$3,636
- Taxable loss
- −$3,738
- Est. tax savings @ 24.0%
- +$897
- After-tax cash flow
- $-682/yr
For passive investors: Depreciation is non-cash, so a rental often shows a tax loss while cash-flowing — sheltering income. Rental losses are passive: they offset passive income freely, and up to $25,000/yr can offset ordinary (W-2) income if you actively participate and your MAGI is under $100k (phasing out to $0 by $150k); unused losses carry forward. On sale, claimed depreciation is recaptured at up to 25%, and gains may owe capital-gains tax (a 1031 exchange can defer both). Figures are a year-1 estimate at your 24.0% rate — not tax advice; consult a CPA.
Schools (NCES district)
- District
- Killeen ISD
- NCES district ID
- 4825660
- Math proficiency
- 31% ▼ -16.00%
- Reading proficiency
- 38% ▼ -3.00%
- Median HH income
- $47,665
- Composite
- 29.69/100
- National rank
- #6458
- State rank
- #524 of 826 in TX
Livability — Killeen
- Score
- 63/100
- State rank
- #853
- US rank
- #15359
Category grades
Schools grade is shown separately in the Schools card above.
Census & demographics
- Census place
- Killeen, TX
- County
- Bell County · 345,090 people
- City population
- 163,398
- Metro
- Killeen-Temple, TX
- Population (ZIP)
- 19,011
- Household income
- $37,349
- Rent vs Own
- Severe rent burden
- 1668.0
Population outlook (Bell County) Hauer SSP2
- Today (2025)
- 371,114 people
- By 2030
- 389,104 · +4.8%
- By 2040
- 420,592 · +13.3%
- By 2050
- 447,779 · +20.7%
- By 2075
- 499,130 · +34.5%
- By 2100
- 505,680 · +36.3%
Race, ethnicity, and origin ACS 2023
- Neighborhood character
- Highly diverse neighborhood (Simpson 0.73)
- Race & ethnicity
- Hispanic / Latino 32% White 31% Black 27% Two or more races 10% Asian 3% Pacific Islander 1%
- Hispanic origin (detail)
- Mexican 21% Puerto Rican 6% Dominican 1%
- Common ancestry
- Italian 2% Slovak 1% Lithuanian 1%
- Foreign-born
- 14% · Canada, Vietnam, South Korea
- Languages at home
- 69% English-only · Spanish 25% German/W. Germanic 2% Korean 1%
Political lean MEDSL · Bell
- 2024 margin
- R (+16.2) · D 41.3% · R 57.6% · Other 1.1%
- 2008→2024 swing
- -6.5pp toward R · 2008: -9.8pp · 2024: -16.2pp
- All cycles
- 2024: R+16.2 2020: R+8.5 2016: R+15.1 2012: R+16.4 2008: R+9.8
Not yet ingested
- Civics
- —
Market trends
- HPI YoY
- ▲ 2.26%
- Current HPI
- 168.1206
- Rent YoY
- ▼ -2.00%
- Metro
- Killeen-Temple, TX
- State GDP YoY
- ▲ 3.95%
- F500 in state
- 110
Industry mix (Fortune 500 HQ in TX)
| Industry | F500 HQs | Revenue |
|---|---|---|
| Energy | 16 | $1,198B |
|
||
| Technology | 5 | $198B |
|
||
| Engineering / Construction | 4 | $72B |
|
||
| Energy Services | 3 | $60B |
|
||
| Utilities | 3 | $41B |
|
||
| Healthcare | 2 | $330B |
|
||
Price history
-16.7% since first listed9 events — show timeline
- 2026-02-28 Price Changed $125,000 CTXMLS
- 2025-07-15 Price Changed $130,000 CTXMLS
- 2025-06-13 Price Changed $135,000 CTXMLS
- 2025-05-12 Listed $140,000 CTXMLS
- 2025-04-30 Listing Removed — CTXMLS
- 2025-03-21 Price Changed $140,000 CTXMLS
- 2025-01-17 Price Changed $145,000 CTXMLS
- 2024-10-11 Listed $150,000 CTXMLS
- 1974-05-17 Sold (Public Records) — Public Records
Property tax history
+7.1%/yrLatest (2025): $2,768 · +76.6% YoY. Source: county tax records.
Cash-flow waterfall
monthlySold comps — $/sqft
last 12 mo · ≤1 miLoading sold comps…