 🏷️ Likely Rental
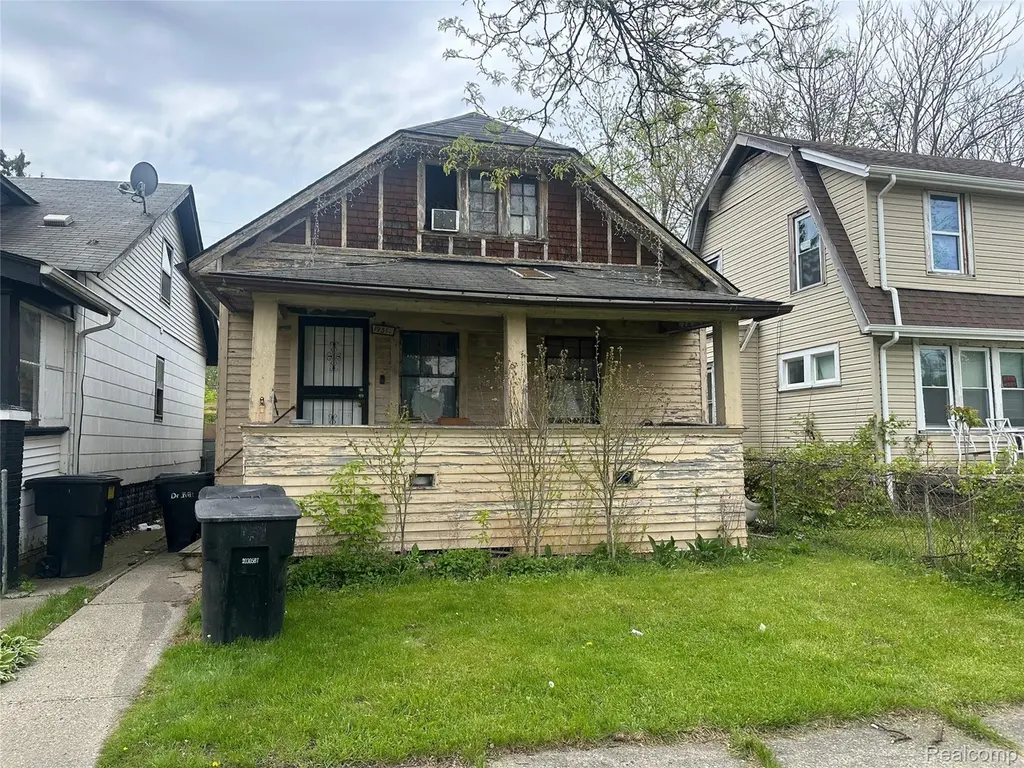
19397 Andover St · Detroit, MI
Flood risk 1/10 · Minimal
- FEMA flood zone
- X (unshaded)
- Chance of flooding over 30 yrs
- 0.0%
- Est. flood insurance / yr
- $473 – $860
Fire risk 1/10 · Minimal
- Est. fire insurance / yr
- $784 – $1,456
Heat risk 3/10 · Minor
- Hot days now (above 97°F)
- 7 days/yr
- Hot days in 30 yrs
- 15 days/yr
Wind risk 2/10 · Minimal
- Chance of severe wind over 30 yrs
- —
Air-quality risk 4/10 · Minor
- Unhealthy air days now
- 4 days/yr
- Unhealthy air days in 30 yrs
- 6 days/yr
Risk factors via First Street. Map © Google.
Why this score? — see what drove the D grade
The composite is a weighted blend of 9 inputs, each scored 0–100. Each bar is that input's sub-score; the figure is the points it added to the 100-point composite (weight × sub-score).
- Cash flow +15.0/30.0
- ARV discount +7.5/15.0
- 1% rule +5.0/10.0
- DSCR +5.0/10.0
- Livability +3.7/5.0
- Rent growth +2.5/5.0
- Condition / age +2.5/5.0
- Schools +1.3/10.0
- Appreciation +0.0/10.0
$15,000
🖨 Deal sheet 📄 Offer letter ✓ Due diligence
Listing remarks MLS
Tenant-occupied investment opportunity featuring a long-term tenant currently paying $1000/month. Property is occupied - accepted offer required prior to interior access or showings. Excellent opportunity for investors seeking immediate cash flow with additional upside potential through future rent adjustments. Previously rented for $1,000/month, this property will be delivered vacant at closing, offering flexibility for both investors and owner-occupants. Flexible land contract terms available. Ask about additional investment properties available from the same owner. Seller is offering a 3-property portfolio, including professionally managed, income-producing homes with established tenants. Package pricing or portfolio discounts may be available. Seller is related to the agent. Lease agreement and rent ledgers available upon request.
Key facts
- 3,049 sq ft lot
- Built 1923
- Listed 38 days
Property features AI
Finance
- Other: Lot dimensions approximately 30 x 100 (0.07 acres); Subdivision: LINDALE GARDENS; Directions: N of 7 Mile / W of Chrysler and E of John
Exterior
- Parking: No garage
- Utilities: Public water; Public sewer
- Home design: Single-family residence; One and one-half stories; Ground-level entry with steps; Aluminum and wood siding
- Construction: Block foundation
- Exterior features: Exterior lighting; Covered porch; Porch; Back yard fencing; Asphalt roof; Paved road access
Interior
- Kitchen: No kitchen appliance details provided
- Bedrooms: Total of 5 rooms (includes bedrooms and living spaces)
- Bathrooms: 1 full bathroom
- Heating & cooling: Forced air heating; Natural gas heating; No cooling
- Interior features: Gas water heater; Unfinished basement; Basement present
- Laundry & utility: Washer hookup; Gas dryer hookup
Neighborhood map
What this means for you Summary
Snapshot
- This is a 3-bed/1.0-bath single-family listed at $15k.
Deal economics
- At list price, monthly cash flow is $964 ($12k/yr) — positive.
- The deal already cash-flows at list — no discount required.
- Meets the 1% rule at list price ($1k rent vs $15k).
- Recommended offer: $15k (3.0% below list) — sets the bar for market timing.
- Cap rate 83.4% vs local median 10.2% in Detroit — top-decile yield for the area; either an underpriced asset or a hidden risk that comps aren't pricing in. Stress-test before assuming the spread holds.
Location & tenants
- Location reads 73/100 on livability (#218 in MI) — a middle-class / working-renter tenant base. Strengths: amenities A+, commute A+, cost of living A+; Watch: schools F, crime F, employment F.
- Detroit Public Schools Community District (urban): math 10% / reading 24% proficiency, ranked #499 of 540 in MI (top 92%) — low school quality limits family demand, transient renter base, plan for 1-2y turnover; 90% free/reduced lunch — lower-income household profile, screen leases tightly.
- Market conditions: 216 active listings in the ZIP; 37 comparable units currently listed for rent nearby; rentals at typical pace (median 24d on market — plan ~3-4 weeks tenant-placement turnaround); lower-income renter base — watch delinquency; 2,639 units permitted in Wayne County in 2024 (1,216 in 5+ unit buildings).
- This rent runs 42% of the median local income ($38k/yr) — at the standard rent-burdened threshold; future hikes will face affordability resistance.
Forward outlook
- Local home prices are declining (-3.0%/yr); year-one equity from $104 of loan paydown is wiped out by about $450 of value loss. Plan a longer hold.
- Wayne County population projected at -17% by 2050 — secular population decline; favor cash flow + early exit over multi-decade hold.
- At projected returns (-3.0% appreciation + 3.0% rent growth), your $4k cash investment doubles in ~1 year — after that, you're playing with house money.
Negotiation context
- It's been on market 38 days — a 3% lower offer ($15k) is reasonable based on typical stale-listing flexibility.
- 6 sale attempts since 3y ago; this cycle's ask has dropped $13k (46%) from the opening price — seller is motivated, your offer sets the floor, not the list.
Risks & watch-outs
- Watch-outs: built in 1923 — expect roof / HVAC / electrical / plumbing capex.
Questions for the listing agent
- It's been on market 38 days. Have you received any prior offers? Is the seller open to a 3% concession, seller financing, or rate buy-down credit?
- Built in 1923 — when were the roof, HVAC, electrical panel, plumbing, and water heater last replaced?
- Is there a deadline driving the sale (1031 exchange, divorce, estate, relocation)? That informs how much negotiation room exists.
- Schools are F-rated, which usually means shorter tenancies and higher turnover. Who's the typical renter profile here, and what's been the actual vacancy rate?
- Crime grade is F in this area — have there been break-ins, vandalism, or insurance claims at this property in the last 3 years? What carrier currently insures it and at what premium?
- The area grade is low — what's the realistic commute time and amenity access for the typical tenant pool here? Any planned neighborhood developments (good or bad) we should know about?
- What's the average days-on-market for RENTAL listings here right now (not sales)? A rising rental-DOM trend means longer vacancies and softer asking-rent achievability than the comps imply.
- What's the recent tenant-quality profile in this submarket — average credit score on applications, eviction rate, late-payment / NSF rate, and stable-employment percentage? A property-management company in the area should have these aggregated.
- How much new for-sale + rental construction is in the pipeline within 1–3 miles? Heavy new supply typically softens prices + rents 12–24 months out; constrained supply supports both.
Investment metrics
- 1% rule
- 9.01% ✓
- Cap rate
- 83.40%
- Cash-on-cash
- 275.40%
- DSCR
- 13.25
- GRM
- 0.9
CMA / ARV
- ARV (median comp)
- $49,833
- List price
- $15,000
- Delta
- -69.90%
- Verdict
- UNDERPRICED
- Comps
- 20 within 1.0 mi
Show comp detail 12 sales within ~0.75 mi
| Address | Dist | Beds/Ba | Sqft | Sold | Price | $/sf | Match |
|---|---|---|---|---|---|---|---|
| 19403 Andover St | 0.01mi | 3/1.0 | 1,009 (-3%) | 6mo | $25,000 | $25 | 90 |
| 19640 Yacama Rd | 0.18mi | 3/1.0 | 1,156 (+11%) | 1mo | $15,000 | $13 | 72 |
| 20031 Hawthorne St | 0.49mi | 4/2.0 (+1) | 1,040 (+0%) | 8mo | $121,000 | $116 | 61 |
| 19711 Greeley St | 0.61mi | 3/1.0 | 1,125 (+8%) | 4mo | $75,000 | $67 | 54 |
| 400 Annin St | 0.41mi | 3/1.0 | 1,187 (+14%) | 5mo | $59,000 | $50 | 53 |
| 20529 Coventry St | 0.71mi | 2/1.5 (-1) | 1,019 (-2%) | 5mo | $75,900 | $74 | 53 |
| 19163 Orleans St | 0.73mi | 2/1.0 (-1) | 1,080 (+4%) | 2mo | $32,500 | $30 | 52 |
| 20529 Irvington St | 0.70mi | 3/1.0 | 946 (-9%) | 3mo | $50,000 | $53 | 50 |
| 19710 Greeley St | 0.64mi | 3/1.5 | 1,143 (+10%) | 3mo | $80,000 | $70 | 49 |
| 19145 Riopelle St | 0.68mi | 3/2.0 | 1,152 (+11%) | 2mo | $80,000 | $69 | 44 |
| 709 E Margaret St | 0.70mi | 3/1.5 | 913 (-12%) | 6mo | $15,000 | $16 | 40 |
| 20172 Russell St | 0.66mi | 4/1.0 (+1) | 1,161 (+12%) | 7mo | $125,000 | $108 | 38 |
Match score weights: distance 35% · size 25% · config 20% · recency 20%. Top-matched comps best support the ARV.
Projected returns pro-forma
-3.0% appreciation · 3.0% rent growth · sell at horizon
- IRR
- —
- Equity multiple
- 15.04×
- Total profit
- $58,981
- Equity at exit
- $2,237
- IRR
- —
- Equity multiple
- 32.07×
- Total profit
- $130,493
- Equity at exit
- $1,297
Cash invested: $4,200 (down + closing). Projections, not guarantees.
Landlord ↔ Tenant lean methodology
- Overall (STATE)
- 62 Landlord-Friendly
- State Michigan
- 62 Landlord-Friendly · EVEN
- County
- — inherits STATE
- City
- — inherits STATE
ZIP-level market 48203
- Home prices YoY
- -23.3%
- Active inventory
- 216
- Price-to-rent
- 0.9×
Monthly cashflow live
- Estimated rent
- $1,351 high interval (Pro) →
- Mortgage (P&I)
- −$79
- Tax est. 1.5%
- −$19 /mo · $225/yr
- Insurance
- −$6
- HOA
- −$0
- Vacancy / Maint / Mgmt
- −$284
- Net cashflow
- $964
Break-even live
UW: 25.0% down · 7.5% · 30yr · 1.5% tax · 5.0% vac · 8.0% maint · 8.0% mgmt
Financing live
Cash to close
- Down payment
- $3,750
- Closing costs
- $450
- Reserves months
- —
- Total cash needed
- —
Loan-product check · same deal, 3 products live
Conventional
25% down · 7.5% · 30yr
- Down + closing
- —
- Monthly P&I
- —
- Monthly cashflow
- —
- DSCR
- —
- Eligible?
- —
Personal DTI + credit; lowest rate.
DSCR
20% down · 8.5% · 30yr
- Down + closing
- —
- Monthly P&I
- —
- Monthly cashflow
- —
- DSCR
- —
- Eligible?
- —
No personal income docs; deal must DSCR.
Hard money
10% down · 12.0% · 12mo
- Down + closing
- —
- Monthly P&I
- —
- Monthly cashflow
- —
- DSCR
- —
- Eligible?
- —
Short-term bridge; refi at stabilization.
Rent comps 37 comps
| Address | Beds | Baths | Sqft | Rent | $/sqft | DOM | Units | Dist |
|---|---|---|---|---|---|---|---|---|
| 19703 Keating St Highland Park, MI | 3.0 | 1.0 | 1000 | $1,200 | $1.20 | 16d | 1 | 0.19mi |
| 404 W Golden Gate Highland Park, MI | 2.0 | 1.0 | 1050 | $1,100 | $1.05 | 43d | 1 | 0.60mi |
| 406 W Goldengate St Detroit, MI | 2.0 | 1.0 | 1050 | $1,100 | $1.05 | 43d | 1 | 0.61mi |
| 574 W Golden Gate Highland Park, MI | 3.0 | 1.0 | 1315 | $1,300 | $0.99 | 43d | 1 | 0.71mi |
| 18503 Riopelle St Highland Park, MI | 3.0 | 1.0 | 1254 | $1,250 | $1.00 | 5d | 1 | 0.87mi |
| 18882 Marx St Highland Park, MI | 2.0 | 1.0 | 1000 | $1,300 | $1.30 | 43d | 1 | 0.88mi |
| 155 W George Ave Hazel Park, MI | 2.0 | 1.0 | 725 | $1,000 | $1.38 | 24d | 1 | 0.90mi |
| 407 E Hayes Ave Hazel Park, MI | 3.0 | 1.0 | 1000 | $1,750 | $1.75 | 24d | 1 | 0.94mi |
| 1301 E Muir Ave Hazel Park, MI | 3.0 | 2.0 | 1236 | $1,600 | $1.29 | 21d | 1 | 0.96mi |
| 1291 W State Fair Ave Detroit, MI | 1.0–2.0 | 1.0 | 700 | $950 | $1.36 | 12d | 2 | 0.99mi |
| 1019 E Hayes Ave Unit 1032331P Hazel Park, MI | 3.0 | 1.0 | 1033 | $5,301 | $5.13 | 1d | 1 | 1.00mi |
| 18551 Saint Aubin St Detroit, MI | 3.0 | 1.0 | 962 | $1,200 | $1.25 | 16d | 1 | 1.05mi |
| 1561 E Webster St Ferndale, MI | 2.0 | 1.0 | 939 | $1,600 | $1.70 | 24d | 1 | 1.12mi |
| 1211 E Bernhard Ave Hazel Park, MI | 2.0 | 1.0 | 721 | $1,500 | $2.08 | 24d | 1 | 1.12mi |
| 18629 Fleming St Detroit, MI | 3.0 | 1.5 | 900 | $1,150 | $1.28 | 24d | 1 | 1.13mi |
| 19995 Goddard St Detroit, MI | 4.0 | 1.0 | 1292 | $1,400 | $1.08 | 21d | 1 | 1.20mi |
| 17550 2nd Ave Detroit, MI | 2.0 | 1.0 | 1350 | $1,150 | $0.85 | 17d | 1 | 1.22mi |
| 1326 E Evelyn Ave Unit 1032332P Hazel Park, MI | 3.0 | 2.0 | 1097 | $6,448 | $5.88 | 1d | 1 | 1.27mi |
| 730 Whitmore Rd Detroit, MI | 1.0–2.0 | 1.0 | 850 | $850 | $1.00 | 43d | 3 | 1.29mi |
| 18084 Goddard St Detroit, MI | 2.0 | 1.5 | 790 | $1,050 | $1.33 | 16d | 1 | 1.29mi |
| 2034 John B Ave Warren, MI | 3.0 | 1.0 | 920 | $1,261 | $1.37 | 43d | 1 | 1.30mi |
| 101 Stevens St Highland Park, MI | 3.0 | 1.5 | 1152 | $1,600 | $1.39 | 17d | 1 | 1.30mi |
| 885 Covington Dr Unit 201 Highland Park, MI | 2.0 | 2.0 | 1350 | $1,695 | $1.26 | 43d | 1 | 1.31mi |
| 1031 Covington Dr Unit 1061 Detroit, MI | 2.0 | 1.0 | 1200 | $1,595 | $1.33 | 43d | 1 | 1.32mi |
| 1029 Covington Dr Unit 1029 Detroit, MI | 2.0 | 1.0 | 1200 | $1,495 | $1.25 | 43d | 1 | 1.32mi |
| 90 W Meyers Ave Hazel Park, MI | 2.0 | 1.0 | 831 | $1,800 | $2.17 | 24d | 1 | 1.33mi |
| 17666 Manderson Rd Unit 17666 Detroit, MI | 2.0 | 1.0 | 1200 | $1,595 | $1.33 | 43d | 1 | 1.33mi |
| 17670 Manderson Rd Unit 17670 Detroit, MI | 2.0 | 1.0 | 1199 | $1,595 | $1.33 | 43d | 1 | 1.33mi |
| 17765 Manderson Rd Unit 8 Highland Park, MI | 2.0 | 1.0 | 1000 | $1,215 | $1.22 | 1d | 1 | 1.33mi |
| 17765 Manderson Rd Unit 14 Highland Park, MI | 2.0 | 1.0 | 1000 | $1,175 | $1.18 | 43d | 1 | 1.33mi |
| 1621 E Evelyn Ave Hazel Park, MI | 2.0 | 1.0 | 749 | $1,295 | $1.73 | 18d | 1 | 1.38mi |
| 790 Jewell St Ferndale, MI | 2.0 | 1.0 | 800 | $1,445 | $1.81 | 24d | 1 | 1.40mi |
| 17449 Manderson Rd Unit 1 Detroit, MI | 2.0 | 1.0 | 750 | $1,150 | $1.53 | 24d | 1 | 1.43mi |
| 20255 Harned St Detroit, MI | 3.0 | 1.0 | 1000 | $1,374 | $1.37 | 16d | 1 | 1.45mi |
| 18666 Joseph Campau St Detroit, MI | 3.0 | 1.0 | 1000 | $1,400 | $1.40 | 16d | 1 | 1.46mi |
| 941 Merton Rd Highland Park, MI | 2.0 | 1.0 | 850 | $1,000 | $1.18 | 43d | 1 | 1.46mi |
| 21516 Dequindre Rd Warren, MI | 1.0–2.0 | 1.0 | 837 | $1,375 | $1.64 | 21d | 1 | 1.49mi |
Listing history 30 events
-
2026-06-18days on market $15,000 Active 38 DOM
-
2026-06-17days on market $15,000 Active 37 DOM
-
2026-06-16price $15,000 Active 35 DOM
Show marketing remark (848 chars)
Tenant-occupied investment opportunity featuring a long-term tenant currently paying $1000/month. Property is occupied - accepted offer required prior to interior access or showings. Excellent opportunity for investors seeking immediate cash flow with additional upside potential through future rent adjustments. Previously rented for $1,000/month, this property will be delivered vacant at closing, offering flexibility for both investors and owner-occupants. Flexible land contract terms available. Ask about additional investment properties available from the same owner. Seller is offering a 3-property portfolio, including professionally managed, income-producing homes with established tenants. Package pricing or portfolio discounts may be available. Seller is related to the agent. Lease agreement and rent ledgers available upon request.
-
2026-06-15days on market $20,000 Active 35 DOM
-
2026-06-13days on market $20,000 Active 33 DOM
-
2026-06-13days on market $20,000 Active 32 DOM
-
2026-06-09days on market $20,000 Active 29 DOM
-
2026-06-08days on market $20,000 Active 28 DOM
-
2026-06-07days on market $20,000 Active 27 DOM
-
2026-06-04days on market $20,000 Active 24 DOM
-
2026-06-03days on market $20,000 Active 23 DOM
-
2026-06-02days on market $20,000 Active 22 DOM
-
2026-06-01days on market $20,000 Active 21 DOM
-
2026-05-31days on market $20,000 Active 20 DOM
-
2026-05-18price $20,000 660-char remark
Show marketing remark (848 chars)
Tenant-occupied investment opportunity featuring a long-term tenant currently paying $1000/month. Property is occupied - accepted offer required prior to interior access or showings. Excellent opportunity for investors seeking immediate cash flow with additional upside potential through future rent adjustments. Previously rented for $1,000/month, this property will be delivered vacant at closing, offering flexibility for both investors and owner-occupants. Flexible land contract terms available. Ask about additional investment properties available from the same owner. Seller is offering a 3-property portfolio, including professionally managed, income-producing homes with established tenants. Package pricing or portfolio discounts may be available. Seller is related to the agent. Lease agreement and rent ledgers available upon request.
-
2026-05-18price $20,000 664-char remark
Show marketing remark (848 chars)
Tenant-occupied investment opportunity featuring a long-term tenant currently paying $1000/month. Property is occupied - accepted offer required prior to interior access or showings. Excellent opportunity for investors seeking immediate cash flow with additional upside potential through future rent adjustments. Previously rented for $1,000/month, this property will be delivered vacant at closing, offering flexibility for both investors and owner-occupants. Flexible land contract terms available. Ask about additional investment properties available from the same owner. Seller is offering a 3-property portfolio, including professionally managed, income-producing homes with established tenants. Package pricing or portfolio discounts may be available. Seller is related to the agent. Lease agreement and rent ledgers available upon request.
-
2026-05-11$28,000 Active 664-char remark
Show marketing remark (848 chars)
Tenant-occupied investment opportunity featuring a long-term tenant currently paying $1000/month. Property is occupied - accepted offer required prior to interior access or showings. Excellent opportunity for investors seeking immediate cash flow with additional upside potential through future rent adjustments. Previously rented for $1,000/month, this property will be delivered vacant at closing, offering flexibility for both investors and owner-occupants. Flexible land contract terms available. Ask about additional investment properties available from the same owner. Seller is offering a 3-property portfolio, including professionally managed, income-producing homes with established tenants. Package pricing or portfolio discounts may be available. Seller is related to the agent. Lease agreement and rent ledgers available upon request.
-
2026-05-11$28,000 Active 660-char remark
Show marketing remark (848 chars)
Tenant-occupied investment opportunity featuring a long-term tenant currently paying $1000/month. Property is occupied - accepted offer required prior to interior access or showings. Excellent opportunity for investors seeking immediate cash flow with additional upside potential through future rent adjustments. Previously rented for $1,000/month, this property will be delivered vacant at closing, offering flexibility for both investors and owner-occupants. Flexible land contract terms available. Ask about additional investment properties available from the same owner. Seller is offering a 3-property portfolio, including professionally managed, income-producing homes with established tenants. Package pricing or portfolio discounts may be available. Seller is related to the agent. Lease agreement and rent ledgers available upon request.
-
2023-03-24status Pending
-
2023-03-24status Pending
-
2023-03-24historical
-
2023-03-24historical
-
2023-02-22$20,000 Active
-
2023-02-21$20,000 Active
-
2023-02-06historical
-
2023-02-06historical
-
2023-02-01price $17,500
-
2023-01-31price $17,500
-
2023-01-26$25,000 Active
-
2023-01-25$25,000 Active
ⓘ Source: listings_history table (triggers on properties + properties_extension) + one-shot
backfill from property_details.listing_events for pre-trigger history.
Climate risk First Street
- Flood 1/10 Low FEMA zone X (unshaded) · 0% chance over 30 yrs
- Wildfire 1/10 Low
- Heat 3/10 Moderate 7 d/yr ≥97°F today · 15 d/yr by 30 yrs out
- Wind 2/10 Low
- Air quality 4/10 Moderate 4 unhealthy d/yr today · 6 by 30 yrs out
Nearby sold comps map
Loading sold comps map…
Walkable amenities ~0.75 mi
Loading nearby amenities…
Taxation est. · year 1
- Rental income
- $16,216
- − Mortgage interest
- −$840
- − Property taxes
- −$225
- − Insurance
- −$75
- − Repairs & maintenance
- −$1,297
- − Management
- −$1,297
- − Depreciation
- −$436
- Taxable income
- $12,045
- Est. tax owed @ 24.0%
- −$2,891
- After-tax cash flow
- $8,676/yr
For passive investors: Depreciation is non-cash, so a rental often shows a tax loss while cash-flowing — sheltering income. Rental losses are passive: they offset passive income freely, and up to $25,000/yr can offset ordinary (W-2) income if you actively participate and your MAGI is under $100k (phasing out to $0 by $150k); unused losses carry forward. On sale, claimed depreciation is recaptured at up to 25%, and gains may owe capital-gains tax (a 1031 exchange can defer both). Figures are a year-1 estimate at your 24.0% rate — not tax advice; consult a CPA.
Schools (NCES district)
- District
- Detroit Public Schools Community District
- NCES district ID
- 2601103
- Math proficiency
- 10% ▼ -2.00%
- Reading proficiency
- 24% ▲ 6.00%
- Median HH income
- $25,815
- Composite
- 13.06/100
- National rank
- #9564
- State rank
- #499 of 540 in MI
Livability — Detroit
- Score
- 73/100
- State rank
- #218
- US rank
- #5427
Category grades
Schools grade is shown separately in the Schools card above.
Census & demographics
- Census place
- Detroit, MI
- County
- Wayne County · 1,562,939 people
- City population
- 572,865
- Metro
- Detroit-Warren-Dearborn, MI
- Population (ZIP)
- 20,049
- Household income
- $38,404
- Rent vs Own
- Severe rent burden
- 1192.0
Population outlook (Wayne County) Hauer SSP2
- Today (2025)
- 1,675,273 people
- By 2030
- 1,620,300 · -3.3%
- By 2040
- 1,502,341 · -10.3%
- By 2050
- 1,384,039 · -17.4%
- By 2075
- 1,124,592 · -32.9%
- By 2100
- 881,193 · -47.4%
Race, ethnicity, and origin ACS 2023
- Neighborhood character
- Predominantly Black (85%)
- Race & ethnicity
- Black 85% White 8% Two or more races 5% Hispanic / Latino 2%
- Common ancestry
- Lithuanian 1%
- Foreign-born
- 2% · Canada
- Languages at home
- 95% English-only · Spanish 3% French/Haitian/Cajun 1%
Political lean MEDSL · Wayne
- 2024 margin
- Strong D (+29.0) · D 62.7% · R 33.7% · Other 3.6%
- 2008→2024 swing
- -20.5pp toward R · 2008: 49.5pp · 2024: 29.0pp
- All cycles
- 2024: D+29.0 2020: D+38.1 2016: D+37.3 2012: D+46.9 2008: D+49.5
Not yet ingested
- Civics
- —
Market trends
- HPI YoY
- ▼ -90.13%
- Current HPI
- 297.0176
- Rent YoY
- —
- Metro
- Detroit-Warren-Dearborn, MI
- State GDP YoY
- ▲ 1.37%
- F500 in state
- 28
Industry mix (Fortune 500 HQ in MI)
| Industry | F500 HQs | Revenue |
|---|---|---|
| Automotive Parts | 3 | $48B |
|
||
| Automotive | 2 | $372B |
|
||
| Chemicals | 1 | $45B |
|
||
| Automotive Retail | 1 | $29B |
|
||
| Healthcare / Medical Devices | 1 | $23B |
|
||
| Automotive Technology | 1 | $20B |
|
||
Price history
-40.0% since first listed18 events — show timeline
- 2026-06-16 Price Changed $15,000 MiRealSource-MiMLS
- 2026-06-15 Price Changed $15,000 REALCOMP
- 2026-05-18 Price Changed $20,000 MiRealSource-MiMLS
- 2026-05-18 Price Changed $20,000 REALCOMP
- 2026-05-11 Listed $28,000 REALCOMP
- 2026-05-11 Listed $28,000 MiRealSource-MiMLS
- 2023-03-24 Pending — MiRealSource-MiMLS
- 2023-03-24 Pending — REALCOMP
- 2023-03-24 Listing Removed — MiRealSource-MiMLS
- 2023-03-24 Listing Removed — REALCOMP
- 2023-02-22 Listed $20,000 REALCOMP
- 2023-02-21 Listed $20,000 MiRealSource-MiMLS
- 2023-02-06 Listing Removed — MiRealSource-MiMLS
- 2023-02-06 Listing Removed — REALCOMP
- 2023-02-01 Price Changed $17,500 MiRealSource-MiMLS
- 2023-01-31 Price Changed $17,500 REALCOMP
- 2023-01-26 Listed $25,000 REALCOMP
- 2023-01-25 Listed $25,000 MiRealSource-MiMLS
Property tax history
+5.4%/yrLatest (2025): $2,159 · +100.5% YoY. Source: county tax records.
Cash-flow waterfall
monthlySold comps — $/sqft
last 12 mo · ≤1 miLoading sold comps…