 🌊 Lakefront
6070 NW 64th Ave #308 · Tamarac, FL
Flood risk No data
- FEMA flood zone
- —
- Chance of flooding over 30 yrs
- —
- Est. flood insurance / yr
- —
Fire risk No data
- Est. fire insurance / yr
- —
Heat risk No data
- Hot days now (above threshold)
- —
- Hot days in 30 yrs
- —
Wind risk No data
- Chance of severe wind over 30 yrs
- —
Air-quality risk No data
- Unhealthy air days now
- —
- Unhealthy air days in 30 yrs
- —
Risk factors via First Street. Map © Google.
Why this score? — see what drove the C grade
The composite is a weighted blend of 9 inputs, each scored 0–100. Each bar is that input's sub-score; the figure is the points it added to the 100-point composite (weight × sub-score).
- Cash flow +19.8/30.0
- 1% rule +10.0/10.0
- ARV discount +7.5/15.0
- DSCR +6.3/10.0
- Schools +4.1/10.0
- Livability +3.8/5.0
- Condition / age +2.5/5.0
- Rent growth +2.2/5.0
- Appreciation +0.0/10.0
$79,000
🖨 Deal sheet 📄 Offer letter ✓ Due diligence
Listing remarks
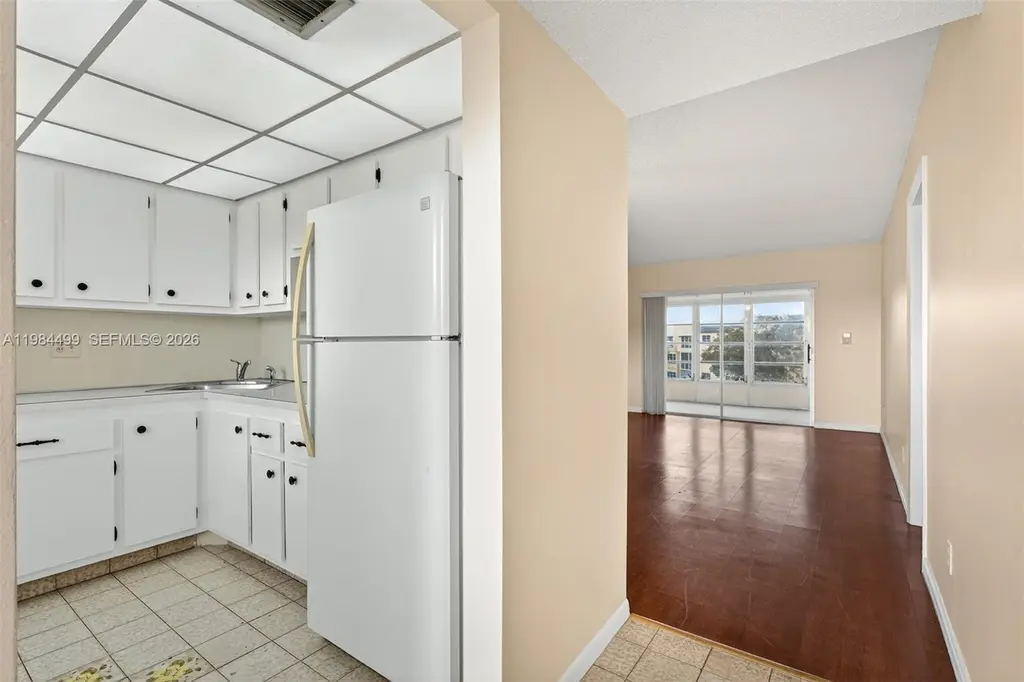
SENIOR COMMUNITY. Very well maintained 1 bedroom unit in Bermuda Club on the third floor accessible by elevators or stairs. Spacious and bright unit. Beautiful water views. Enclosed patio with peaceful water views. Walk in closet. Common laundry room. Assigned parking spot. Requirements: $25,000 annual income; 675+ credit score; Must be 55+ years old; No pets; 20% down payment. Rental restriction with new ownership. Community offers several amenities.
Key facts
- Water views
- Community amenities
- Walk in closet
Tags
Property features AI
Finance
- Financial info: Pets not allowed
- HOA & community: Monthly association fee; Association amenities: clubhouse, fitness center, laundry, pool, tennis court(s), elevator(s); Association covers amenities, common areas, structure maintenance, parking, pool(s), sewer and water; Senior community
Exterior
- Parking: Assigned parking; Guest parking
- Security: Smoke detector(s)
- Utilities: Water service included in association; Sewer service included in association; Electric service
- Home design: 4-story building; Entry on level 3; Property is attached
- Construction: Block construction; Resale property
- Exterior features: Patio; Exterior lighting; Lakefront; Association pool; Has view
Interior
- Kitchen: Electric range; Refrigerator
- Bedrooms: Bedroom located on main level
- Flooring: Vinyl
- Bathrooms: 1 full bathroom
- Heating & cooling: Electric heating; Ceiling fan(s); Electric cooling
- Interior features: Bedroom on main level; Walk-in closet(s); Vinyl flooring
- Laundry & utility: Common area laundry
Neighborhood map
What this means for you Summary
Snapshot
- This is a 1-bed/1.0-bath condo listed at $79k.
Deal economics
- At list price, monthly cash flow is $94 ($1k/yr) — positive.
- The deal already cash-flows at list — no discount required.
- Meets the 1% rule at list price ($1k rent vs $79k).
- Recommended offer: $72k (9.0% below list) — sets the bar for market timing.
- Cap rate 7.7% vs local median 3.9% in Tamarac — top-decile yield for the area; either an underpriced asset or a hidden risk that comps aren't pricing in. Stress-test before assuming the spread holds.
Location & tenants
- Location reads 76/100 on livability (#239 in FL, #3,785 nationally) — a middle-class / working-renter tenant base. Strengths: housing A+, health & safety A+, cost of living A-; Watch: employment C-, amenities F, commute F.
- Broward (suburban): math 42% / reading 53% proficiency, ranked #46 of 73 in FL (top 63%) — families likely to look elsewhere, expect single-tenant / working-renter base with shorter leases.
- Market conditions: Rents soft (-1.4%/yr); 821 active listings in the ZIP; 33 comparable units currently listed for rent nearby; rentals at typical pace (median 14d on market — plan ~3-4 weeks tenant-placement turnaround); 2,111 units permitted in Broward County in 2024 (1,265 in 5+ unit buildings).
- This rent runs 31% of the median local income ($58k/yr) — at the standard rent-burdened threshold; future hikes will face affordability resistance.
Forward outlook
- Local home prices are declining (-3.0%/yr); year-one equity from $546 of loan paydown is wiped out by about $2k of value loss. Plan a longer hold.
- Broward County population projected at +34% by 2050 — long-run rental-demand tailwind backs the buy-and-hold thesis.
Negotiation context
- It's been on market 93 days — a 9% lower offer ($72k) is reasonable based on typical stale-listing flexibility.
- Current owner paid $24k; list at $79k implies a 229% gain — meaningful room to come down on a strong offer.
Risks & watch-outs
- Watch-outs: property tax is 2.6% of price; HOA is 31% of rent.
Questions for the listing agent
- It's been on market 93 days. Have you received any prior offers? Is the seller open to a 9% concession, seller financing, or rate buy-down credit?
- Built in 1973 — when were the roof, HVAC, electrical panel, plumbing, and water heater last replaced?
- Property tax is high relative to price — has the assessment been appealed recently, and will the sale trigger a re-assessment?
- What does the HOA fee cover, when was the last increase, and are there any pending special assessments or reserve-fund shortfalls?
- Any open or pending special assessments — roof, HVAC, plumbing, elevator, façade? What's the per-unit balance and payoff schedule, and is the seller paying it off at close or rolling it to the buyer?
- Why hasn't it sold? Are there any deal-killer items the seller is aware of (foundation, flood, title, zoning, code violations)?
- Is there a deadline driving the sale (1031 exchange, divorce, estate, relocation)? That informs how much negotiation room exists.
- Schools are B-rated — typically a magnet for longer-tenancy family renters. What's the average tenant stay here, and is there a school-zone premium baked into asking?
- This sits on a lake — are riparian / water-frontage rights deeded with the parcel? Any dock permits, shoreline easements, or HOA water-use restrictions?
- What's the documented flood / surge / shoreline-erosion history here (FEMA AND non-FEMA — e.g., storm surge, creek backup, septic-field saturation)?
- Any water-quality or seasonal algae-bloom issues that affect tenant satisfaction or short-term-rental demand?
- What's the average days-on-market for RENTAL listings here right now (not sales)? A rising rental-DOM trend means longer vacancies and softer asking-rent achievability than the comps imply.
- What's the recent tenant-quality profile in this submarket — average credit score on applications, eviction rate, late-payment / NSF rate, and stable-employment percentage? A property-management company in the area should have these aggregated.
- How much new apartment / multifamily construction is in the pipeline within 1–3 miles? Heavy new supply (>2% of stock underway) typically softens rents 12–24 months out; light construction supports rent growth.
Investment metrics
- 1% rule
- 1.88% ✓
- Cap rate
- 7.72%
- Cash-on-cash
- 5.11%
- DSCR
- 1.23
- GRM
- 4.4
CMA / ARV
No comps found within radius.
Projected returns pro-forma
-3.0% appreciation · 0.0% rent growth · sell at horizon
- IRR
- -14.4%
- Equity multiple
- 0.51×
- Total profit
- $-10,811
- Equity at exit
- $11,779
- IRR
- -19.9%
- Equity multiple
- 0.23×
- Total profit
- $-17,102
- Equity at exit
- $6,830
Cash invested: $22,120 (down + closing). Projections, not guarantees.
Landlord ↔ Tenant lean methodology
- Overall (STATE)
- 87 Strongly Landlord-Friendly
- State Florida
- 87 Strongly Landlord-Friendly · R+3
- County
- — inherits STATE
- City
- — inherits STATE
ZIP-level market 33319
- Rents YoY
- -1.4%
- Active inventory
- 821
- Price-to-rent
- 4.4×
Monthly cashflow live
- Estimated rent
- $1,486 high interval (Pro) →
- Mortgage (P&I)
- −$414
- Tax from tax record
- −$172 /mo · $2,063/yr
- Insurance
- −$33
- HOA
- −$461
- Vacancy / Maint / Mgmt
- −$312
- Net cashflow
- $94
Break-even live
UW: 25.0% down · 7.5% · 30yr · 1.5% tax · 5.0% vac · 8.0% maint · 8.0% mgmt
Financing live
Cash to close
- Down payment
- $19,750
- Closing costs
- $2,370
- Reserves months
- —
- Total cash needed
- —
Loan-product check · same deal, 3 products live
Conventional
25% down · 7.5% · 30yr
- Down + closing
- —
- Monthly P&I
- —
- Monthly cashflow
- —
- DSCR
- —
- Eligible?
- —
Personal DTI + credit; lowest rate.
DSCR
20% down · 8.5% · 30yr
- Down + closing
- —
- Monthly P&I
- —
- Monthly cashflow
- —
- DSCR
- —
- Eligible?
- —
No personal income docs; deal must DSCR.
Hard money
10% down · 12.0% · 12mo
- Down + closing
- —
- Monthly P&I
- —
- Monthly cashflow
- —
- DSCR
- —
- Eligible?
- —
Short-term bridge; refi at stabilization.
Rent comps 33 comps
| Address | Beds | Baths | Sqft | Rent | $/sqft | DOM | Units | Dist |
|---|---|---|---|---|---|---|---|---|
| 6050 NW 64th Ave #307 Fort Lauderdale, FL | 1.0 | 1.0 | 660 | $1,375 | $2.08 | 24d | 1 | 0.06mi |
| 6300 NW 62nd St Tamarac, FL | 1.0–2.0 | 1.0–2.0 | 770 | $1,350 | $1.75 | 2d | 3 | 0.07mi |
| 6020 NW 64th Ave Tamarac, FL | 1.0–2.0 | 1.0–2.0 | 770 | $1,400 | $1.82 | 4d | 3 | 0.09mi |
| 6020 NW 64th Ave Tamarac, FL | 1.0–2.0 | 1.0–2.0 | 770 | $1,425 | $1.85 | 24d | 4 | 0.09mi |
| 6150 NW 62nd St Tamarac, FL | 1.0 | 1.0 | 660 | $1,525 | $2.31 | 24d | 2 | 0.10mi |
| 6021 NW 61st Ave #207 Tamarac, FL | 1.0 | 1.0 | 660 | $1,350 | $2.05 | 2d | 1 | 0.10mi |
| 5940 NW 64th Ave #106 Fort Lauderdale, FL | 1.0 | 1.0 | 660 | $1,400 | $2.12 | 24d | 1 | 0.13mi |
| 6000 NW 64th Ave #106 Fort Lauderdale, FL | 1.0 | 1.0 | 660 | $1,450 | $2.20 | 7d | 1 | 0.14mi |
| 5890 NW 64th Ave #308 Tamarac, FL | 1.0 | 1.0 | 660 | $1,500 | $2.27 | 2d | 1 | 0.19mi |
| 5851 NW 62nd Ave #305 Tamarac, FL | 1.0 | 1.0 | 660 | $1,500 | $2.27 | 24d | 1 | 0.21mi |
| 5860 NW 64th Ave Tamarac, FL | 1.0–2.0 | 1.0–2.0 | 770 | $1,450 | $1.88 | 7d | 3 | 0.22mi |
| 5860 NW 64th Ave Tamarac, FL | 1.0–2.0 | 1.0–2.0 | 770 | $1,485 | $1.93 | 24d | 2 | 0.22mi |
| 5801 NW 62nd Ave #106 Tamarac, FL | 1.0 | 1.0 | 660 | $1,350 | $2.05 | 24d | 1 | 0.26mi |
| 5750 NW 64th Ave #305 Tamarac, FL | 1.0 | 1.0 | 660 | $1,650 | $2.50 | 20d | 1 | 0.26mi |
| 8140 SW 22nd St North Lauderdale, FL | 1.0–2.0 | 1.5–2.0 | 764 | $1,672 | $2.19 | 16d | 2 | 0.27mi |
| 8140 SW 22nd St North Lauderdale, FL | 1.0 | 1.5 | 695 | $1,527 | $2.20 | 18d | 1 | 0.27mi |
| 1400 Avon Ln North Lauderdale, FL | 1.0–3.0 | 1.0–2.0 | 1070 | $1,637 | $1.53 | 1d | 58 | 0.79mi |
| 7900 Hampton Blvd North Lauderdale, FL | 1.0–2.0 | 1.0–2.0 | 925 | $1,748 | $1.89 | 2d | 35 | 0.80mi |
| 7575 Hampton Blvd North Lauderdale, FL | 1.0 | 1.0 | 720 | $1,815 | $2.52 | 3d | 5 | 0.82mi |
| 5780 Rock Island Rd #360 Tamarac, FL | 1.0 | 1.0 | 690 | $1,750 | $2.54 | 4d | 1 | 0.94mi |
| 5780 Rock Island Rd #360 Tamarac, FL | 1.0 | 1.0 | 690 | $1,750 | $2.54 | 7d | 1 | 0.94mi |
| 5686 Rock Island Rd Tamarac, FL | 1.0 | 1.0 | 655 | $1,675 | $2.56 | 15d | 2 | 0.99mi |
| 5612 Rock Island Rd #154 Tamarac, FL | 1.0 | 1.0 | 695 | $1,690 | $2.43 | 15d | 1 | 0.99mi |
| 5760 Rock Island Rd Tamarac, FL | 1.0–2.0 | 1.0–2.0 | 655 | $1,575 | $2.40 | 4d | 3 | 0.99mi |
| 5760 Rock Island Rd Tamarac, FL | 1.0–2.0 | 1.0–2.0 | 655 | $1,599 | $2.44 | 10d | 3 | 0.99mi |
| 5740 Rock Island Rd #299 Tamarac, FL | 1.0 | 1.0 | 750 | $1,895 | $2.53 | 14d | 1 | 1.00mi |
| 5740 Rock Island Rd Tamarac, FL | 1.0 | 1.0 | 722 | $1,722 | $2.38 | 24d | 1 | 1.00mi |
| 5672 Rock Island Rd Tamarac, FL | 1.0 | 1.0 | 717 | $1,748 | $2.44 | 3d | 2 | 1.03mi |
| 5628 Rock Island Rd Tamarac, FL | 1.0–2.0 | 1.0–2.0 | 867 | $1,700 | $1.96 | 5d | 2 | 1.04mi |
| 5475 N University Dr Lauderhill, FL | 3.0 | 1.0–2.0 | 794 | $2,085 | $2.63 | 2d | 35 | 1.30mi |
| 7900 Colony Cir S #303 Tamarac, FL | 1.0 | 1.5 | 750 | $1,680 | $2.24 | 24d | 1 | 1.41mi |
| 7910 Colony Cir N #308 Tamarac, FL | 1.0 | 1.5 | 750 | $1,600 | $2.13 | 24d | 1 | 1.41mi |
| 8040 Colony Cir N #207 Tamarac, FL | 1.0 | 1.5 | 750 | $1,475 | $1.97 | 24d | 1 | 1.46mi |
HOA detail condo
- Monthly dues
- $461 · $5,532/yr
- Likely covers
- waterparking
- Assessments
- None detected in remarks — confirm with the listing agent.
Listing history 17 events
-
2026-06-18days on market $79,000 Active 93 DOM
-
2026-06-17days on market $79,000 Active 92 DOM
-
2026-06-16days on market $79,000 Active 91 DOM
-
2026-06-15days on market $79,000 Active 90 DOM
-
2026-06-13days on market $79,000 Active 88 DOM
-
2026-06-09days on market $79,000 Active 84 DOM
-
2026-06-08days on market $79,000 Active 83 DOM
-
2026-06-07days on market $79,000 Active 82 DOM
-
2026-06-04days on market $79,000 Active 79 DOM
-
2026-06-03days on market $79,000 Active 78 DOM
-
2026-06-02days on market $79,000 Active 77 DOM
-
2026-06-01days on market $79,000 Active 76 DOM
-
2026-05-31days on market $79,000 Active 75 DOM
-
2026-03-17$79,000 Active
-
2012-09-11soldstatus $24,000
-
2001-06-21soldstatus $19,500
-
1996-03-07soldstatus $19,000
ⓘ Source: listings_history table (triggers on properties + properties_extension) + one-shot
backfill from property_details.listing_events for pre-trigger history.
Tax reassessment forecast FL · Resets to sale price
- Current annual tax
- $2,063 · $172/mo
- Projected year-2 tax
- $2,063 · $172/mo
- Expected delta
- $0/yr ($0/mo · 0.0%)
ⓘ Screening estimate from a state-policy table — verify with the county assessor before closing.
Nearby sold comps map
Loading sold comps map…
Walkable amenities ~0.75 mi
Loading nearby amenities…
Taxation est. · year 1
- Rental income
- $17,836
- − Mortgage interest
- −$4,425
- − Property taxes
- −$2,063
- − Insurance
- −$395
- − Repairs & maintenance
- −$1,427
- − Management
- −$1,427
- − HOA
- −$5,532
- − Depreciation
- −$2,298
- Taxable income
- $270
- Est. tax owed @ 24.0%
- −$65
- After-tax cash flow
- $1,065/yr
For passive investors: Depreciation is non-cash, so a rental often shows a tax loss while cash-flowing — sheltering income. Rental losses are passive: they offset passive income freely, and up to $25,000/yr can offset ordinary (W-2) income if you actively participate and your MAGI is under $100k (phasing out to $0 by $150k); unused losses carry forward. On sale, claimed depreciation is recaptured at up to 25%, and gains may owe capital-gains tax (a 1031 exchange can defer both). Figures are a year-1 estimate at your 24.0% rate — not tax advice; consult a CPA.
Schools (NCES district)
- District
- Broward
- NCES district ID
- 1200180
- Math proficiency
- 42% ▼ -18.00%
- Reading proficiency
- 53% ▼ -5.00%
- Median HH income
- $52,139
- Composite
- 40.88/100
- National rank
- #3621
- State rank
- #46 of 73 in FL
Livability — Tamarac
- Score
- 76/100
- State rank
- #239
- US rank
- #3785
Category grades
Schools grade is shown separately in the Schools card above.
Census & demographics
- Census place
- Tamarac, FL
- County
- Broward County · 1,963,430 people
- City population
- 105,666
- Metro
- Miami-Fort Lauderdale-Pompano Beach, FL
- Population (ZIP)
- 54,450
- Household income
- $58,388
- Rent vs Own
- Severe rent burden
- 2809.0
Population outlook (Broward County) Hauer SSP2
- Today (2025)
- 2,207,033 people
- By 2030
- 2,360,704 · +7.0%
- By 2040
- 2,661,208 · +20.6%
- By 2050
- 2,946,698 · +33.5%
- By 2075
- 3,602,273 · +63.2%
- By 2100
- 3,970,984 · +79.9%
Race, ethnicity, and origin ACS 2023
- Neighborhood character
- Diverse neighborhood (Simpson 0.58)
- Race & ethnicity
- Black 61% Hispanic / Latino 17% White 15% Two or more races 11% Asian 4%
- Hispanic origin (detail)
- Puerto Rican 4% Cuban 2% Dominican 1%
- Common ancestry
- Hispanic 13% Romanian 1% Italian 1%
- Foreign-born
- 46% · Canada, Jamaica, Vietnam
- Languages at home
- 64% English-only · Spanish 15% French/Haitian/Cajun 15% Other Indo-European 2%
Political lean MEDSL · Broward
- 2024 margin
- D (+17.0) · D 58.0% · R 41.0%
- 2008→2024 swing
- -17.8pp toward R · 2008: 34.7pp · 2024: 17.0pp
- All cycles
- 2024: D+17.0 2020: D+29.8 2016: D+35.0 2012: D+34.9 2008: D+34.7
Not yet ingested
- Civics
- —
Market trends
- HPI YoY
- ▼ -202.84%
- Current HPI
- 328.4307
- Rent YoY
- ▼ -1.38%
- Metro
- Miami-Fort Lauderdale-Pompano Beach, FL
- State GDP YoY
- ▲ 3.28%
- F500 in state
- 36
Industry mix (Fortune 500 HQ in FL)
| Industry | F500 HQs | Revenue |
|---|---|---|
| Industrial Technology | 2 | $29B |
|
||
| Insurance | 2 | $17B |
|
||
| Retail | 1 | $60B |
|
||
| Technology Distribution | 1 | $58B |
|
||
| Homebuilding | 1 | $35B |
|
||
| Technology Manufacturing | 1 | $35B |
|
||
Price history
+315.8% since first listed4 events — show timeline
- 2026-03-17 Listed $79,000 MARMLS
- 2012-09-11 Sold (Public Records) $24,000 Public Records
- 2001-06-21 Sold (Public Records) $19,500 Public Records
- 1996-03-07 Sold (Public Records) $19,000 Public Records
Property tax history
+15.8%/yrLatest (2025): $2,063 · +3.4% YoY. Source: county tax records.
Cash-flow waterfall
monthlySold comps — $/sqft
last 12 mo · ≤1 miLoading sold comps…