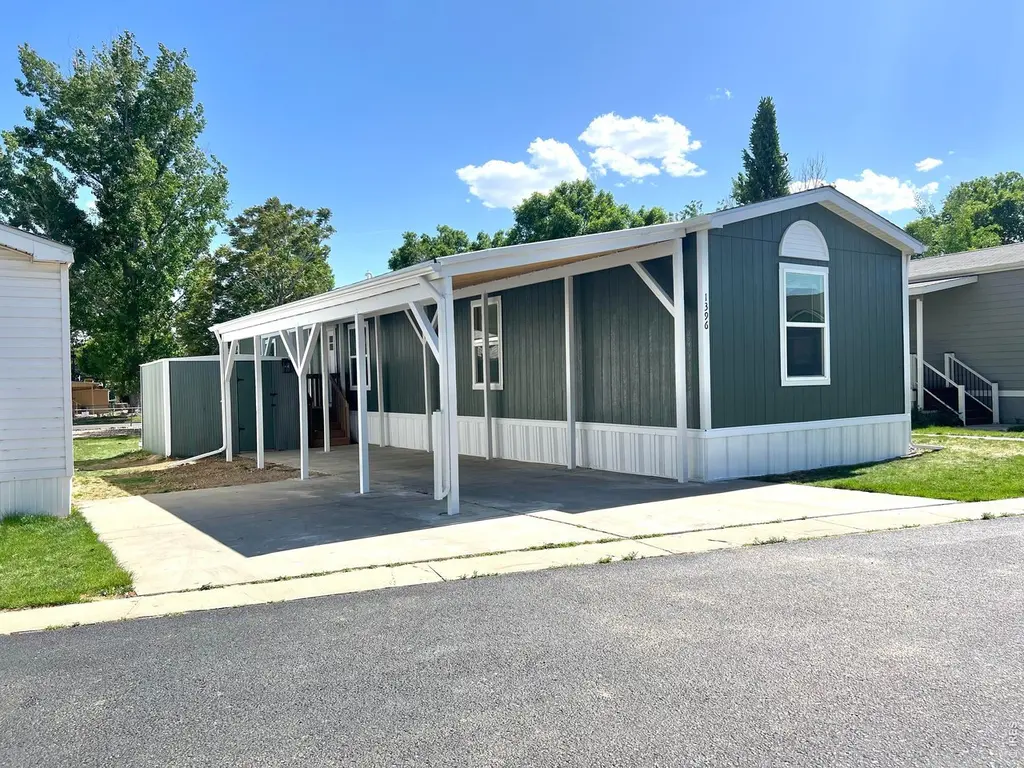
1396 Sylmar Pl #7 · Loveland, CO
Flood risk 1/10 · Minimal
- FEMA flood zone
- X (unshaded)
- Chance of flooding over 30 yrs
- 0.0%
- Est. flood insurance / yr
- $507 – $1,088
Fire risk 3/10 · Minor
- Est. fire insurance / yr
- $939 – $1,743
Heat risk 3/10 · Minor
- Hot days now (above 92°F)
- 7 days/yr
- Hot days in 30 yrs
- 18 days/yr
Wind risk 1/10 · Minimal
- Chance of severe wind over 30 yrs
- —
Air-quality risk 4/10 · Minor
- Unhealthy air days now
- 6 days/yr
- Unhealthy air days in 30 yrs
- 8 days/yr
Risk factors via First Street. Map © Google.
Why this score? — see what drove the C+ grade
The composite is a weighted blend of 9 inputs, each scored 0–100. Each bar is that input's sub-score; the figure is the points it added to the 100-point composite (weight × sub-score).
- Cash flow +26.8/30.0
- DSCR +9.2/10.0
- ARV discount +7.5/15.0
- 1% rule +5.8/10.0
- Livability +3.7/5.0
- Rent growth +3.4/5.0
- Schools +3.4/10.0
- Condition / age +2.5/5.0
- Appreciation +0.0/10.0
$139,900
🖨 Deal sheet 📄 Offer letter ✓ Due diligence
Listing remarks
Are you ready to experience all the peace of mind that a brand new home can offer? This home was just built in 2026 and never lived in, so no fixes to do! Sylmar is a Premier 55 and over community with lower lot rent of just $1075/ month. Water (interior and exterior), sewer, and trash are all included at no additional charge. Smart and energy efficient home, with smart thermostat, 2 x 6 exterior construction for added insulation, double pane vinyl windows with low E glass, high efficiency furnace, and smart water heater. Home features a great open layout in the living area with accent wood wall. Kitchen boasts an island with overhang for seating, great sized pantry that wraps around the fr
Key facts
- Lower lot rent
- Brand new home
- Smart thermostat
Tags
Property features AI
Finance
- Other: Minimal flood risk (C rating); Level drive; Asphalt road frontage on a city street; Stall shower accessibility feature; Southern exposure with energy-efficient windows and doors; Directions: When you turn into the park and are heading north, turn left, then the home will be on the left.; Builder: SNRG
- HOA & community: No association fees
Exterior
- Parking: Carport
- Utilities: City water (meter installed); Public sewer; Natural gas available (Xcel); Electricity available; Cable available; Satellite available; High-speed internet available; Underground utilities; Private trash service
- Home design: Manufactured in park; Manufactured home
- Construction: Frame construction; Composition roof
- Exterior features: Patio; Storage; Level lot; House faces north; City limits location; Paved access with sidewalks and street lights; Near bus
Interior
- Kitchen: Gas Range; Dishwasher; Refrigerator
- Bedrooms: 3 bedrooms
- Bathrooms: 1 full bath; 1 three-quarter bath
- Heating & cooling: Forced air heating; Central air conditioning
- Interior features: Eat-in kitchen; Open floor plan; Pantry; Kitchen island
- Laundry & utility: Washer; Dryer
Neighborhood map
What this means for you Summary
Snapshot
- This is a 2-bed/2.0-bath manufactured listed at $140k.
Deal economics
- At list price, monthly cash flow is $383 ($5k/yr) — positive.
- The deal already cash-flows at list — no discount required.
- Meets the 1% rule at list price ($2k rent vs $140k).
- Recommended offer: $138k (1.5% below list) — sets the bar for market timing.
- Cap rate 9.6% vs local median 2.9% in Loveland — top-decile yield for the area; either an underpriced asset or a hidden risk that comps aren't pricing in. Stress-test before assuming the spread holds.
Location & tenants
- Location reads 73/100 on livability (#52 in CO) — a middle-class / working-renter tenant base. Strengths: housing A+, health & safety A+, amenities A; Watch: crime C-, commute F, cost of living F.
- Thompson School District R-2J (suburban): math 28% / reading 48% proficiency, ranked #28 of 86 in CO (top 33%) — families likely to look elsewhere, expect single-tenant / working-renter base with shorter leases.
- Market conditions: Rents rising (+3.6%/yr); 283 active listings in the ZIP; 34 comparable units currently listed for rent nearby; rentals at typical pace (median 24d on market — plan ~3-4 weeks tenant-placement turnaround); solid renter incomes; 1,786 units permitted in Larimer County in 2024 (402 in 5+ unit buildings).
Forward outlook
- Local home prices are declining (-3.0%/yr); year-one equity from $967 of loan paydown is wiped out by about $4k of value loss. Plan a longer hold.
- Larimer County population projected at +51% by 2050 — long-run rental-demand tailwind backs the buy-and-hold thesis.
- At projected returns (-3.0% appreciation + 3.6% rent growth), your $39k cash investment doubles in ~10 years — after that, you're playing with house money.
Negotiation context
- It's been on market 28 days — a 2% lower offer ($138k) is reasonable based on typical stale-listing flexibility.
- 2 sale attempts since 3y ago with the ask held roughly flat each time — persistent listings suggest the price (not the market) is what's stuck; bring a comps-based counter.
Questions for the listing agent
- Is there a deadline driving the sale (1031 exchange, divorce, estate, relocation)? That informs how much negotiation room exists.
- What's the average days-on-market for RENTAL listings here right now (not sales)? A rising rental-DOM trend means longer vacancies and softer asking-rent achievability than the comps imply.
- What's the recent tenant-quality profile in this submarket — average credit score on applications, eviction rate, late-payment / NSF rate, and stable-employment percentage? A property-management company in the area should have these aggregated.
- How much new for-sale + rental construction is in the pipeline within 1–3 miles? Heavy new supply typically softens prices + rents 12–24 months out; constrained supply supports both.
Investment metrics
- 1% rule
- 1.08% ✓
- Cap rate
- 9.58%
- Cash-on-cash
- 11.73%
- DSCR
- 1.52
- GRM
- 7.7
CMA / ARV
- ARV (on-the-fly)
- $55,440
- Comps found
- 12
Show comp detail 12 sales within ~0.75 mi
| Address | Dist | Beds/Ba | Sqft | Sold | Price | $/sf | Match |
|---|---|---|---|---|---|---|---|
| 1166 Madison Ave #71 | 0.12mi | 2/2.0 | 924 (0%) | 1mo | $45,000 | $49 | 94 |
| 1535 Sunset Pl #32 | 0.06mi | 2/2.0 | 924 (0%) | 7mo | $47,500 | $51 | 92 |
| 1519 Sunset Pl #34 | 0.06mi | 3/2.0 (+1) | 924 (0%) | 10mo | $37,500 | $41 | 83 |
| 1700 Pearl Dr #106 | 0.24mi | 2/2.0 | 896 (-3%) | 3mo | $60,000 | $67 | 82 |
| 1519 Sunset Pl | 0.06mi | 3/2.0 (+1) | 924 (0%) | 15mo | $10,000 | $11 | 79 |
| 1166 Madison Ave #87 | 0.12mi | 2/1.0 | 928 (+0%) | 13mo | $24,500 | $26 | 78 |
| 1367 Sylmar Pl #11 | 0.08mi | 3/2.0 (+1) | 960 (+4%) | 10mo | $92,000 | $96 | 76 |
| 1166 Madison Ave #130 | 0.12mi | 2/1.0 | 896 (-3%) | 12mo | $47,500 | $53 | 76 |
| 1166 N Madison Ave #243 | 0.12mi | 2/2.0 | 992 (+7%) | 12mo | $60,000 | $60 | 72 |
| 1850 Sandstone Ct #84 | 0.29mi | 2/1.0 | 960 (+4%) | 7mo | $70,000 | $73 | 70 |
| 1826 Sandstone Ct #86 | 0.27mi | 3/1.0 (+1) | 980 (+6%) | 0mo | $115,000 | $117 | 68 |
| 1773 Sandstone Dr #131 | 0.22mi | 2/2.0 | 1,024 (+11%) | 11mo | $68,000 | $66 | 62 |
Match score weights: distance 35% · size 25% · config 20% · recency 20%. Top-matched comps best support the ARV.
Projected returns pro-forma
-3.0% appreciation · 3.57% rent growth · sell at horizon
- IRR
- 1.7%
- Equity multiple
- 1.06×
- Total profit
- $2,523
- Equity at exit
- $20,860
- IRR
- 11.7%
- Equity multiple
- 1.94×
- Total profit
- $36,951
- Equity at exit
- $12,096
Cash invested: $39,172 (down + closing). Projections, not guarantees.
Landlord ↔ Tenant lean methodology
- Overall (STATE)
- 38 Tenant-Leaning
- State Colorado
- 38 Tenant-Leaning · D+4
- County
- — inherits STATE
- City
- — inherits STATE
ZIP-level market 80537
- Rents YoY
- 3.6%
- Active inventory
- 283
- Price-to-rent
- 7.7×
Monthly cashflow live
- Estimated rent
- $1,518 high interval (Pro) →
- Mortgage (P&I)
- −$734
- Tax from tax record
- −$24 /mo · $291/yr
- Insurance
- −$58
- HOA
- −$0
- Vacancy / Maint / Mgmt
- −$319
- Net cashflow
- $383
Break-even live
UW: 25.0% down · 7.5% · 30yr · 1.5% tax · 5.0% vac · 8.0% maint · 8.0% mgmt
Financing live
Cash to close
- Down payment
- $34,975
- Closing costs
- $4,197
- Reserves months
- —
- Total cash needed
- —
Loan-product check · same deal, 3 products live
Conventional
25% down · 7.5% · 30yr
- Down + closing
- —
- Monthly P&I
- —
- Monthly cashflow
- —
- DSCR
- —
- Eligible?
- —
Personal DTI + credit; lowest rate.
DSCR
20% down · 8.5% · 30yr
- Down + closing
- —
- Monthly P&I
- —
- Monthly cashflow
- —
- DSCR
- —
- Eligible?
- —
No personal income docs; deal must DSCR.
Hard money
10% down · 12.0% · 12mo
- Down + closing
- —
- Monthly P&I
- —
- Monthly cashflow
- —
- DSCR
- —
- Eligible?
- —
Short-term bridge; refi at stabilization.
Rent comps 34 comps
| Address | Beds | Baths | Sqft | Rent | $/sqft | DOM | Units | Dist |
|---|---|---|---|---|---|---|---|---|
| 1302 Nickel Dr Unit 1 Loveland, CO | 3.0 | 1.0 | 950 | $1,300 | $1.37 | 23d | 1 | 0.13mi |
| 1710 E 16th St Loveland, CO | 2.0 | 1.5 | 900 | $1,427 | $1.59 | 23d | 1 | 0.29mi |
| 1706 E 16th St Unit 1710 Loveland, CO | 2.0 | 1.5 | 900 | $1,250 | $1.39 | 23d | 1 | 0.30mi |
| 1707 E 16th St Unit 1717 Loveland, CO | 2.0 | 1.5 | 825 | $1,295 | $1.57 | 14d | 1 | 0.33mi |
| 1840 E 17th St Unit 1840 Loveland, CO | 3.0 | 1.0 | 1000 | $1,345 | $1.34 | 14d | 1 | 0.41mi |
| 1707 Cheyenne Ave Unit 8 Loveland, CO | 2.0 | 1.0 | 820 | $1,245 | $1.52 | 23d | 1 | 0.43mi |
| 1640 Cheyenne Ave Loveland, CO | 2.0 | 1.0 | 900 | $1,900 | $2.11 | 23d | 1 | 0.45mi |
| 1338 E 7th St Loveland, CO | 2.0 | 1.0 | 598 | $1,695 | $2.83 | 14d | 1 | 0.54mi |
| 1292 E 6th St Loveland, CO | 1.0–3.0 | 1.0–1.5 | 845 | $1,729 | $2.05 | 14d | 1 | 0.64mi |
| 1494 E 5th St Loveland, CO | 2.0 | 1.0 | 800 | $1,525 | $1.91 | 23d | 1 | 0.66mi |
| 1492 E 5th St Loveland, CO | 1.0 | 1.0 | 800 | $1,350 | $1.69 | 23d | 1 | 0.67mi |
| 1143 E 5th St Loveland, CO | 2.0 | 1.0 | 760 | $1,250 | $1.64 | 23d | 1 | 0.69mi |
| 1145 E 5th St Loveland, CO | 2.0 | 1.0 | 760 | $1,250 | $1.64 | 23d | 1 | 0.70mi |
| 1054 E 5th St Loveland, CO | 3.0 | 1.0 | 1090 | $1,700 | $1.56 | 14d | 1 | 0.80mi |
| 1325 N Jefferson Ave Loveland, CO | 2.0 | 1.0 | 850 | $1,545 | $1.82 | 23d | 1 | 0.84mi |
| 339 E 10th St Loveland, CO | 1.0 | 1.0 | 576 | $1,358 | $2.36 | 21d | 3 | 0.88mi |
| 574 E 23rd St Loveland, CO | 2.0 | 1.0 | 956 | $1,250 | $1.31 | 23d | 5 | 0.98mi |
| 325 E 5th St Loveland, CO | 3.0 | 1.0–2.0 | 1188 | $2,045 | $1.72 | 14d | 1 | 1.09mi |
| 347 N Washington Ave Loveland, CO | 1.0 | 1.0 | 650 | $1,195 | $1.84 | 23d | 1 | 1.09mi |
| 347 N Washington Ave Loveland, CO | 1.0 | 1.0 | 650 | $1,195 | $1.84 | 14d | 1 | 1.09mi |
| 585 N Lincoln Ave Loveland, CO | 1.0–2.0 | 1.0–2.0 | 747 | $1,750 | $2.34 | 23d | 3 | 1.11mi |
| 2900 Mountain Lion Dr Loveland, CO | 3.0 | 1.0–2.0 | 936 | $2,048 | $2.19 | 14d | 17 | 1.17mi |
| 247 W 10th St Loveland, CO | 2.0 | 2.0 | 865 | $2,500 | $2.89 | 21d | 1 | 1.21mi |
| 331 N Cleveland Ave Unit 220 Loveland, CO | 2.0 | 1.0 | 625 | $1,400 | $2.24 | 23d | 1 | 1.24mi |
| 246 N Cleveland Ave Loveland, CO | 3.0 | 1.0–2.0 | 1022 | $2,544 | $2.49 | 14d | 11 | 1.26mi |
| 130 E 1st St Loveland, CO | 2.0 | 1.0 | 800 | $1,695 | $2.12 | 23d | 1 | 1.39mi |
| 140 E 1st St Loveland, CO | 2.0 | 2.0 | 875 | $1,795 | $2.05 | 14d | 1 | 1.40mi |
| 434 W 10th St Loveland, CO | 2.0 | 1.0 | 872 | $1,400 | $1.61 | 23d | 1 | 1.41mi |
| 430 W 10th St Loveland, CO | 2.0 | 1.0 | 756 | $1,400 | $1.85 | 23d | 1 | 1.42mi |
| 256 S Cleveland Ave Loveland, CO | 1.0 | 1.0 | 600 | $1,395 | $2.33 | 23d | 1 | 1.43mi |
| 260 S Cleveland Ave Loveland, CO | 1.0 | 1.0 | 600 | $1,395 | $2.33 | 23d | 1 | 1.44mi |
| 466 W 10th St Loveland, CO | 2.0 | 1.0 | 840 | $1,400 | $1.67 | 23d | 1 | 1.44mi |
| 480 W 10th St Loveland, CO | 2.0 | 2.0 | 940 | $1,700 | $1.81 | 23d | 1 | 1.45mi |
| 1015 Roosevelt Ave Unit B1 Loveland, CO | 2.0 | 1.0 | 900 | $1,500 | $1.67 | 23d | 1 | 1.47mi |
Listing history 19 events
-
2026-06-18days on market $139,900 Active 28 DOM
-
2026-06-17days on market $139,900 Active 27 DOM
-
2026-06-16days on market $139,900 Active 26 DOM
-
2026-06-15days on market $139,900 Active 25 DOM
-
2026-06-14days on market $139,900 Active 23 DOM
-
2026-06-13days on market $139,900 Active 22 DOM
-
2026-06-10days on market $139,900 Active 20 DOM
-
2026-06-09days on market $139,900 Active 19 DOM
-
2026-06-08days on market $139,900 Active 18 DOM
-
2026-06-07days on market $139,900 Active 17 DOM
-
2026-06-03days on market $139,900 Active 13 DOM
-
2026-06-02days on market $139,900 Active 12 DOM
-
2026-06-01days on market $139,900 Active 11 DOM
-
2026-05-31days on market $139,900 Active 10 DOM
-
2026-05-30days on market $139,900 Active 9 DOM
-
2026-05-21$139,900 Active
-
2023-10-03historical
-
2023-09-23price $75,000
-
2023-07-06$79,500 Active
ⓘ Source: listings_history table (triggers on properties + properties_extension) + one-shot
backfill from property_details.listing_events for pre-trigger history.
Tax reassessment forecast CO · Resets to sale price
- Current annual tax
- $291 · $24/mo
- Projected year-2 tax
- $769 · $64/mo
- Expected delta
- +$478/yr (+$40/mo · 164.2%)
ⓘ Screening estimate from a state-policy table — verify with the county assessor before closing.
Climate risk First Street
- Flood 1/10 Low FEMA zone X (unshaded) · 0% chance over 30 yrs
- Wildfire 3/10 Moderate
- Heat 3/10 Moderate 7 d/yr ≥92°F today · 18 d/yr by 30 yrs out
- Wind 1/10 Low
- Air quality 4/10 Moderate 6 unhealthy d/yr today · 8 by 30 yrs out
Nearby sold comps map
Loading sold comps map…
Walkable amenities ~0.75 mi
Loading nearby amenities…
Taxation est. · year 1
- Rental income
- $18,214
- − Mortgage interest
- −$7,837
- − Property taxes
- −$291
- − Insurance
- −$700
- − Repairs & maintenance
- −$1,457
- − Management
- −$1,457
- − Depreciation
- −$4,070
- Taxable income
- $2,403
- Est. tax owed @ 24.0%
- −$577
- After-tax cash flow
- $4,018/yr
For passive investors: Depreciation is non-cash, so a rental often shows a tax loss while cash-flowing — sheltering income. Rental losses are passive: they offset passive income freely, and up to $25,000/yr can offset ordinary (W-2) income if you actively participate and your MAGI is under $100k (phasing out to $0 by $150k); unused losses carry forward. On sale, claimed depreciation is recaptured at up to 25%, and gains may owe capital-gains tax (a 1031 exchange can defer both). Figures are a year-1 estimate at your 24.0% rate — not tax advice; consult a CPA.
Schools (NCES district)
- District
- Thompson School District R-2J
- NCES district ID
- 0805400
- Math proficiency
- 28% ▼ -7.00%
- Reading proficiency
- 48% ▬ 0.00%
- Median HH income
- $63,040
- Composite
- 34.01/100
- National rank
- #5313
- State rank
- #28 of 86 in CO
Livability — Loveland
- Score
- 73/100
- State rank
- #52
- US rank
- #5353
Category grades
Schools grade is shown separately in the Schools card above.
Census & demographics
- Census place
- Loveland, CO
- County
- Larimer County · 338,255 people
- City population
- 94,535
- Metro
- Fort Collins, CO
- Population (ZIP)
- 44,425
- Household income
- $86,325
- Rent vs Own
- Severe rent burden
- 1703.0
Population outlook (Larimer County) Hauer SSP2
- Today (2025)
- 415,361 people
- By 2030
- 457,762 · +10.2%
- By 2040
- 542,310 · +30.6%
- By 2050
- 627,048 · +51.0%
- By 2075
- 833,722 · +100.7%
- By 2100
- 952,590 · +129.3%
Race, ethnicity, and origin ACS 2023
- Neighborhood character
- Predominantly White (83%)
- Race & ethnicity
- White 83% Hispanic / Latino 12% Two or more races 8%
- Hispanic origin (detail)
- Mexican 10%
- Common ancestry
- Slovak 4% Italian 3% Lithuanian 3%
- Foreign-born
- 3% · Canada
- Languages at home
- 95% English-only · Spanish 4%
Political lean MEDSL · Larimer
- 2024 margin
- D (+17.6) · D 57.4% · R 39.8% · Other 2.9%
- 2008→2024 swing
- +7.9pp toward D · 2008: 9.7pp · 2024: 17.6pp
- All cycles
- 2024: D+17.6 2020: D+15.4 2016: D+4.9 2012: D+5.2 2008: D+9.7
Not yet ingested
- Civics
- —
Market trends
- HPI YoY
- ▼ -606.26%
- Current HPI
- 253.4939
- Rent YoY
- ▲ 3.57%
- Metro
- Fort Collins, CO
- State GDP YoY
- ▲ 1.95%
- F500 in state
- 14
Industry mix (Fortune 500 HQ in CO)
| Industry | F500 HQs | Revenue |
|---|---|---|
| Technology Distribution | 1 | $31B |
|
||
| Food / Agriculture | 1 | $18B |
|
||
| Packaging | 1 | $14B |
|
||
| Healthcare | 1 | $13B |
|
||
| Energy | 1 | $10B |
|
||
| Technology | 1 | $4B |
|
||
Price history
+76.0% since first listed4 events — show timeline
- 2026-05-21 Listed $139,900 IRES
- 2023-10-03 Listing Removed — IRES
- 2023-09-23 Price Changed $75,000 IRES
- 2023-07-06 Listed $79,500 IRES
Property tax history
+9.0%/yrLatest (2025): $291 · +265.0% YoY. Source: county tax records.
Cash-flow waterfall
monthlySold comps — $/sqft
last 12 mo · ≤1 miLoading sold comps…