 Multi-family
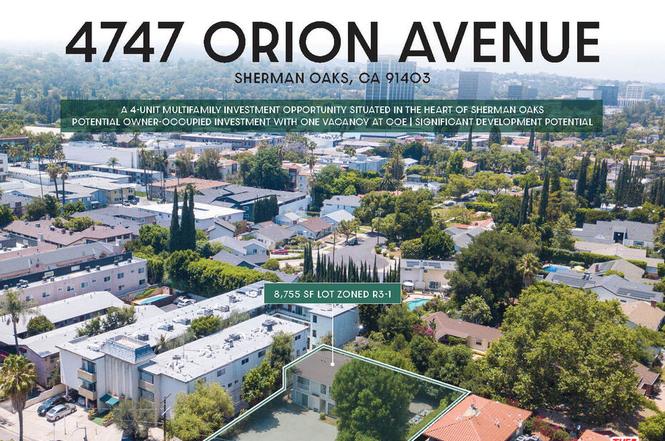
4747 Orion Ave · Los Angeles, CA
Flood risk 5/10 · Moderate
- FEMA flood zone
- X (unshaded)
- Chance of flooding over 30 yrs
- 0.51%
- Est. flood insurance / yr
- $507 – $1,088
Fire risk 1/10 · Minimal
- Est. fire insurance / yr
- $659 – $1,223
Heat risk 5/10 · Moderate
- Hot days now (above 97°F)
- 8 days/yr
- Hot days in 30 yrs
- 22 days/yr
Wind risk 1/10 · Minimal
- Chance of severe wind over 30 yrs
- —
Air-quality risk 5/10 · Moderate
- Unhealthy air days now
- 7 days/yr
- Unhealthy air days in 30 yrs
- 8 days/yr
Risk factors via First Street. Map © Google.
Why this score? — see what drove the D grade
The composite is a weighted blend of 9 inputs, each scored 0–100. Each bar is that input's sub-score; the figure is the points it added to the 100-point composite (weight × sub-score).
- Cash flow +11.8/30.0
- ARV discount +7.5/15.0
- Appreciation +5.7/10.0
- Schools +3.6/10.0
- DSCR +3.5/10.0
- Livability +3.4/5.0
- Condition / age +2.5/5.0
- Rent growth +2.4/5.0
- 1% rule +2.2/10.0
$1,500,000
🖨 Deal sheet (PDF) 📄 Offer letter ✓ Due diligence
Multi-family units
County records classify this as Multi-Family (2-4 Unit). Listing-text estimate: 1 unit. estimate disagrees with records
Listing remarks
We are pleased to present 4747 Orion Avenue, a4-unit multifamily investment opportunity situated in the heart of Sherman Oaks, just moments from Ventura Boulevard and the101/405 interchange - one of the San Fernando Valley's most desirable and supply-constrained rental submarkets. The property features three one-bedroom/one-bath units and one two-bedroom/two-bath unit across approximately 2,964 gross square feet, sitting on a spacious 8,755 SF lot. One unit will be delivered vacant at the close of escrow, providing an incoming investor with immediate market rate income for that unit from day one. At the asking price of $1,500,000, the property is offered at$375,000 per unit and $506 per squ
Key facts
- 10 units by right
- Density bonus
- 8
Tags
Property features AI
Finance
- Other: Property identified as a residential income (multi-family) asset
- Financial info: Actual annual gross rent: $84,360; Actual rent total: $88,800; Gross operating income: $84,360; Net operating income: $42,150; Total annual expenses: $42,150; Cap rate: 2.81%; Gross rent multiplier: 16.89; Vacancy allowance: $4,440; Rent roll highlights: three 1-bed/1-bath units and one 2-bed/2-bath unit; listed unit rents include $1,833, $1,900 and others reflecting actual/projected differences
- HOA & community: Four units in the complex (total)
Exterior
- Parking: Driveway parking
- Home design: Residential income property; Attached structure; Two total floors
- Construction: One building in the complex
- Exterior features: Zoned LAR3
Interior
- Bedrooms: Three 1-bedroom units; One 2-bedroom unit
- Bathrooms: Three 1-bath units; One 2-bath unit
- Heating & cooling: No central cooling; No central heating
- Interior features: Attached building (shared/common wall); Multi-level layout
Neighborhood map
What this means for you Summary
Snapshot
- This is a 5-bed/4.0-bath multifamily listed at $1.50M.
Deal economics
- At list price, monthly cash flow is $-414 ($-5k/yr) — negative.
- To cash-flow at today's rent, offer at most $1.43M (4.9% below list).
- To meet the 1% rule (rent ≥ 1% of price), the offer needs to be $1.09M (27.6% below list).
- Recommended offer: $1.09M (27.6% below list) — sets the bar for 1% rule.
- Cap rate 6.0% vs local median 2.1% in Los Angeles — top-decile yield for the area; either an underpriced asset or a hidden risk that comps aren't pricing in. Stress-test before assuming the spread holds.
Location & tenants
- Location reads 68/100 on livability (#273 in CA) — a middle-class / working-renter tenant base. Strengths: amenities A+, commute A+, employment B; Watch: health & safety C-, crime F, cost of living F.
- Los Angeles Unified (urban): math 29% / reading 54% proficiency, ranked #223 of 517 in CA (top 43%) — families likely to look elsewhere, expect single-tenant / working-renter base with shorter leases; 67% free/reduced lunch — lower-income household profile, screen leases tightly.
- Zoned schools: Hesby Oaks Leadership Charter (501 students, 15% FRL, charter); William Mulholland Middle (1,002 students, 94% FRL); Valley Academy of Arts And Sciences (math 22% / reading 52%, grade F, #578 of 1,170 statewide, top 51%, 868 students, 64% FRL).
- Market conditions: Rents soft (-0.6%/yr); 139 active listings in the ZIP; 30 comparable units currently listed for rent nearby; rentals lingering (median 46d on market — plan ~5-8 weeks vacancy on turnover, expect pricing pressure); 57% of comp listings sitting > 30 days — soft ceiling on asking rent; high-income renter base; 19,697 units permitted in Los Angeles County in 2024 (9,426 in 5+ unit buildings).
- At $10,856/mo this rent would consume 112% of the median local household income ($116k/yr) (locally 1750% of renters already pay >50% of income on rent) — very limited rent-growth headroom before tenants either downsize or default.
Forward outlook
- In year one you build about $30k of equity ($10k loan paydown + $20k appreciation (1.3% local appreciation)).
- Los Angeles County population projected at +9% by 2050 — modest demand growth; plan on rents tracking national, not racing it.
- By year 4, paydown + projected appreciation supports a ~$108k cash-out refi (75% LTV) — recoverable capital for the next deal without selling this one.
Negotiation context
- Only 4 days on market — expect competitive offers; lowballing is unlikely to land.
- Current owner paid $300k; list at $1.50M implies a 400% gain — meaningful room to come down on a strong offer.
Risks & watch-outs
- Climate carrying-cost: moderate flood risk; extreme-heat days projected 8→22/yr by 2055 (HVAC capex compounding) — expect insurance premiums to compound above CPI over the hold.
Questions for the listing agent
- What do current leases actually rent for vs. the listed asking? Can we see a recent rent roll and the last 12 months of T-12 income?
- Built in 1976 — when were the roof, HVAC, electrical panel, plumbing, and water heater last replaced?
- Is there a deadline driving the sale (1031 exchange, divorce, estate, relocation)? That informs how much negotiation room exists.
- Schools are D-rated, which usually means shorter tenancies and higher turnover. Who's the typical renter profile here, and what's been the actual vacancy rate?
- Crime grade is F in this area — have there been break-ins, vandalism, or insurance claims at this property in the last 3 years? What carrier currently insures it and at what premium?
- The area grade is low — what's the realistic commute time and amenity access for the typical tenant pool here? Any planned neighborhood developments (good or bad) we should know about?
- What's the average days-on-market for RENTAL listings here right now (not sales)? A rising rental-DOM trend means longer vacancies and softer asking-rent achievability than the comps imply.
- What's the recent tenant-quality profile in this submarket — average credit score on applications, eviction rate, late-payment / NSF rate, and stable-employment percentage? A property-management company in the area should have these aggregated.
- How much new apartment / multifamily construction is in the pipeline within 1–3 miles? Heavy new supply (>2% of stock underway) typically softens rents 12–24 months out; light construction supports rent growth.
Investment metrics
- 1% rule
- 0.72% ✗
- Cap rate
- 5.96%
- Cash-on-cash
- -1.18%
- DSCR
- 0.95
- GRM
- 11.5
CMA / ARV
No comps found within radius.
Projected returns pro-forma
1.33% appreciation · 0.0% rent growth · sell at horizon
- IRR
- -0.3%
- Equity multiple
- 0.99×
- Total profit
- $-6,136
- Equity at exit
- $538,341
- IRR
- 2.9%
- Equity multiple
- 1.35×
- Total profit
- $147,478
- Equity at exit
- $736,173
Cash invested: $420,000 (down + closing). Projections, not guarantees.
Landlord ↔ Tenant lean methodology
- Overall (CITY)
- 0 Strongly Tenant-Friendly
- State California
- 18 Strongly Tenant-Friendly · D+13
- County
- — inherits STATE
- City Los Angeles
- 0 Strongly Tenant-Friendly · D+22
ZIP-level market 91403
- Home prices YoY
- 0.3%
- Rents YoY
- -0.6%
- Active inventory
- 139
- Price-to-rent
- 11.5×
Monthly cashflow live
- Estimated rent
- $10,856 high interval (Pro) →
- Mortgage (P&I)
- −$7,866
- Tax from tax record
- −$499 /mo · $5,992/yr
- Insurance
- −$625
- HOA
- −$0
- Vacancy / Maint / Mgmt
- −$2,280
- Net cashflow
- $-414
Break-even live
Sensitivity live
| Price | -10% $435 | -5% $10 | +0% $-414 | +5% $-839 | +10% $-1,263 |
|---|---|---|---|---|---|
| Rent | -10% $-1,272 | -5% $-843 | +0% $-414 | +5% $15 | +10% $443 |
| Rate | -1.0pp $341 | -0.5pp $-33 | base $-414 | +0.5pp $-803 | +1.0pp $-1,198 |
UW: 25.0% down · 7.5% · 30yr · 1.5% tax · 5.0% vac · 8.0% maint · 8.0% mgmt
Financing live
Cash to close
- Down payment
- $375,000
- Closing costs
- $45,000
- Reserves months
- —
- Total cash needed
- —
Loan-product check · same deal, 3 products live
Conventional
25% down · 7.5% · 30yr
- Down + closing
- —
- Monthly P&I
- —
- Monthly cashflow
- —
- DSCR
- —
- Eligible?
- —
Personal DTI + credit; lowest rate.
DSCR
20% down · 8.5% · 30yr
- Down + closing
- —
- Monthly P&I
- —
- Monthly cashflow
- —
- DSCR
- —
- Eligible?
- —
No personal income docs; deal must DSCR.
Hard money
10% down · 12.0% · 12mo
- Down + closing
- —
- Monthly P&I
- —
- Monthly cashflow
- —
- DSCR
- —
- Eligible?
- —
Short-term bridge; refi at stabilization.
Rent comps 30 comps
| Address | Beds | Baths | Sqft | Rent | $/sqft | DOM | Units | Dist |
|---|---|---|---|---|---|---|---|---|
| 15233 Camarillo St Sherman Oaks, CA | 4.0 | 3.0 | 2000 | $5,500 | $2.75 | 45d | 1 | 0.28mi |
| 4724 Halbrent Ave Sherman Oaks, CA | 5.0 | 5.5 | 4002 | $24,000 | $6.00 | 45d | 1 | 0.31mi |
| 15216 Morrison St Sherman Oaks, CA | 4.0 | 4.0 | 2700 | $6,500 | $2.41 | 45d | 1 | 0.38mi |
| 15434 Sutton St Sherman Oaks, CA | 4.0 | 4.0 | 3477 | $11,999 | $3.45 | 45d | 1 | 0.46mi |
| 15122 Morrison St Sherman Oaks, CA | 4.0 | 3.5 | 2422 | $9,000 | $3.72 | 20d | 1 | 0.47mi |
| 4818 Norwich Ave Sherman Oaks, CA | 4.0 | 6.0 | 3459 | $16,995 | $4.91 | 45d | 1 | 0.55mi |
| 5155 Densmore Ave Encino, CA | 4.0 | 3.0 | 2115 | $6,875 | $3.25 | 45d | 1 | 0.63mi |
| 4703 Saloma Ave Sherman Oaks, CA | 5.0 | 4.0 | 3300 | $22,000 | $6.67 | 45d | 1 | 0.65mi |
| 5029 Lemona Ave Sherman Oaks, CA | 5.0 | 4.5 | 3517 | $7,499 | $2.13 | 9d | 1 | 0.67mi |
| 4186 Regal Oak Dr Encino, CA | 5.0 | 5.0 | 3986 | $14,000 | $3.51 | 26d | 1 | 0.73mi |
| 14944 Otsego St Sherman Oaks, CA | 5.0 | 5.5 | 3853 | $9,999 | $2.60 | 24d | 1 | 0.74mi |
| 4933 Collett Ave Encino, CA | 5.0 | 4.0 | 3400 | $12,000 | $3.53 | 26d | 1 | 0.75mi |
| 14828 Morrison St Sherman Oaks, CA | 4.0 | 3.0 | 2628 | $8,750 | $3.33 | 26d | 1 | 0.82mi |
| 5061 Woodley Ave Encino, CA | 5.0 | 4.5 | 3600 | $18,000 | $5.00 | 0d | 1 | 0.86mi |
| 14758 Morrison St Sherman Oaks, CA | 4.0 | 4.5 | 3663 | $22,000 | $6.01 | 45d | 1 | 0.88mi |
| 14717 Otsego St Sherman Oaks, CA | 4.0 | 4.0 | 2436 | $11,500 | $4.72 | 45d | 1 | 1.03mi |
| 4734 Tobias Ave Sherman Oaks, CA | 4.0 | 4.5 | 3000 | $15,500 | $5.17 | 45d | 1 | 1.05mi |
| 4544 Tobias Ave Sherman Oaks, CA | 5.0 | 5.0 | 3400 | $13,000 | $3.82 | 45d | 1 | 1.06mi |
| 14602 Morrison St Sherman Oaks, CA | 4.0 | 4.5 | 3052 | $16,000 | $5.24 | 26d | 1 | 1.10mi |
| 4166 Crisp Canyon Rd Sherman Oaks, CA | 5.0 | 4.0 | 3044 | $8,000 | $2.63 | 24d | 1 | 1.18mi |
| 14537 Hesby St Sherman Oaks, CA | 4.0 | 3.5 | 2550 | $12,500 | $4.90 | 17d | 1 | 1.20mi |
| 14624 McCormick St Sherman Oaks, CA | 5.0 | 6.0 | 3597 | $12,000 | $3.34 | 45d | 1 | 1.20mi |
| 3852 Sherview Dr Sherman Oaks, CA | 4.0 | 3.0 | 2080 | $10,000 | $4.81 | 26d | 1 | 1.29mi |
| 4450 Hayvenhurst Ave Encino, CA | 4.0 | 4.0 | 3058 | $12,000 | $3.92 | 45d | 1 | 1.34mi |
| 16379 Meadowridge Rd Encino, CA | 4.0 | 3.0 | 3014 | $9,250 | $3.07 | 7d | 1 | 1.37mi |
| 16379 Meadowridge Rd Encino, CA | 4.0 | 3.0 | 3014 | $9,250 | $3.07 | 46d | 1 | 1.37mi |
| 16544 Greenleaf St Encino, CA | 4.0 | 3.5 | 2421 | $9,500 | $3.92 | 45d | 1 | 1.37mi |
| 4711 Tyrone Ave Sherman Oaks, CA | 6.0 | 4.5 | 3600 | $11,900 | $3.31 | 26d | 1 | 1.44mi |
| 5750 Kester Ave Unit 1/2 Sherman Oaks, CA | 4.0 | 4.0 | 2000 | $3,978 | $1.99 | 45d | 1 | 1.46mi |
| 3637 Loadstone Dr Sherman Oaks, CA | 4.0 | 3.5 | 3052 | $13,995 | $4.59 | 45d | 1 | 1.47mi |
Listing history 3 events
-
2026-06-21days on market $1,500,000 Active 4 DOM
-
2026-06-18remarks 699-char remark
-
2026-06-18$1,500,000 Active 1 DOM
ⓘ Source: listings_history table (triggers on properties + properties_extension) + one-shot
backfill from property_details.listing_events for pre-trigger history.
Tax reassessment forecast CA · Resets to sale price
- Current annual tax
- $5,992 · $499/mo
- Projected year-2 tax
- $11,400 · $950/mo
- Expected delta
- +$5,408/yr (+$451/mo · 90.2%)
ⓘ Screening estimate from a state-policy table — verify with the county assessor before closing.
Climate risk First Street
- Flood 5/10 Major FEMA zone X (unshaded) · 51% chance over 30 yrs
- Wildfire 1/10 Low
- Heat 5/10 Major 8 d/yr ≥97°F today · 22 d/yr by 30 yrs out
- Wind 1/10 Low
- Air quality 5/10 Major 7 unhealthy d/yr today · 8 by 30 yrs out
Nearby sold comps map
Loading sold comps map…
Walkable amenities ~0.75 mi
Loading nearby amenities…
Taxation est. · year 1
- Rental income
- $130,273
- − Mortgage interest
- −$84,023
- − Property taxes
- −$5,992
- − Insurance
- −$7,500
- − Repairs & maintenance
- −$10,422
- − Management
- −$10,422
- − Depreciation
- −$43,636
- Taxable loss
- −$31,722
- Est. tax savings @ 24.0%
- +$7,613
- After-tax cash flow
- $2,643/yr
For passive investors: Depreciation is non-cash, so a rental often shows a tax loss while cash-flowing — sheltering income. Rental losses are passive: they offset passive income freely, and up to $25,000/yr can offset ordinary (W-2) income if you actively participate and your MAGI is under $100k (phasing out to $0 by $150k); unused losses carry forward. On sale, claimed depreciation is recaptured at up to 25%, and gains may owe capital-gains tax (a 1031 exchange can defer both). Figures are a year-1 estimate at your 24.0% rate — not tax advice; consult a CPA.
Schools (NCES district)
- District
- Los Angeles Unified
- NCES district ID
- 0622710
- Math proficiency
- 29% ▼ -4.00%
- Reading proficiency
- 54% ▲ 10.00%
- Median HH income
- $50,403
- Composite
- 35.67/100
- National rank
- #4875
- State rank
- #223 of 517 in CA
Livability — Los Angeles
- Score
- 68/100
- State rank
- #273
- US rank
- #9237
Category grades
Schools grade is shown separately in the Schools card above.
Census & demographics
- Census place
- Los Angeles, CA
- County
- Los Angeles County · 9,444,647 people
- City population
- 3,838,149
- Metro
- Los Angeles-Long Beach-Anaheim, CA
- Population (ZIP)
- 25,793
- Household income
- $116,170
- Rent vs Own
- Severe rent burden
- 1750.0
Population outlook (Los Angeles County) Hauer SSP2
- Today (2025)
- 10,940,515 people
- By 2030
- 11,256,481 · +2.9%
- By 2040
- 11,729,929 · +7.2%
- By 2050
- 11,948,407 · +9.2%
- By 2075
- 11,818,114 · +8.0%
- By 2100
- 10,842,928 · -0.9%
Race, ethnicity, and origin ACS 2023
- Neighborhood character
- Diverse neighborhood (Simpson 0.55)
- Race & ethnicity
- White 64% Hispanic / Latino 16% Two or more races 13% Asian 7% Black 6%
- Hispanic origin (detail)
- Mexican 8%
- Common ancestry
- Scotch-Irish 8% Romanian 4% Subsaharan African 3%
- Foreign-born
- 24% · Canada, South Korea, Dominican Republic
- Languages at home
- 67% English-only · Other Indo-European 10% Spanish 9% Russian/Polish/Slavic 5%
Political lean MEDSL · Los Angeles
- 2024 margin
- Solid D (+32.9) · D 64.8% · R 31.9% · Other 3.3%
- 2008→2024 swing
- -7.4pp toward R · 2008: 40.4pp · 2024: 32.9pp
- All cycles
- 2024: D+32.9 2020: D+44.2 2016: D+48.0 2012: D+40.0 2008: D+40.4
Not yet ingested
- Civics
- —
Market trends
- HPI YoY
- ▲ 1.33%
- Current HPI
- 441.2872
- Rent YoY
- ▼ -0.56%
- Metro
- Los Angeles-Long Beach-Anaheim, CA
- State GDP YoY
- ▲ 3.21%
- F500 in state
- 116
Industry mix (Fortune 500 HQ in CA)
| Industry | F500 HQs | Revenue |
|---|---|---|
| Technology | 27 | $1,492B |
|
||
| Financial Services | 3 | $174B |
|
||
| Retail | 3 | $44B |
|
||
| Insurance | 3 | $26B |
|
||
| Media / Entertainment | 2 | $115B |
|
||
| Pharmaceuticals / Biotech | 2 | $62B |
|
||
Price history
+581.8% since first listed3 events — show timeline
- 2026-06-17 Listed $1,500,000 TheMLS
- 2000-12-05 Sold (Public Records) $300,000 Public Records
- 1998-03-31 Sold (Public Records) $220,000 Public Records
Property tax history
+1.6%/yrLatest (2025): $5,992 · +2.1% YoY. Source: county tax records.
Cash-flow waterfall
monthlySold comps — $/sqft
last 12 mo · ≤1 miLoading sold comps…