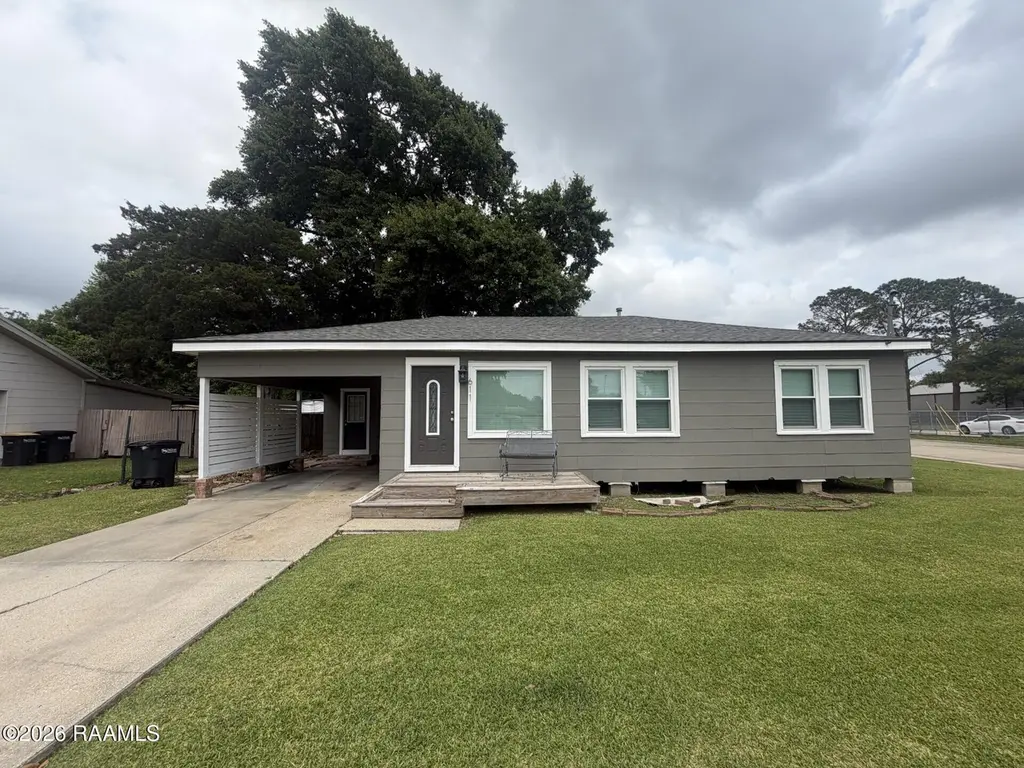
611 Angers St · New Iberia, LA
Flood risk 7/10 · Major
- FEMA flood zone
- X (unshaded)
- Chance of flooding over 30 yrs
- 0.99%
- Est. flood insurance / yr
- $507 – $1,088
Fire risk 1/10 · Minimal
- Est. fire insurance / yr
- $1,269 – $2,357
Heat risk 9/10 · Severe
- Hot days now (above 108°F)
- 7 days/yr
- Hot days in 30 yrs
- 22 days/yr
Wind risk 9/10 · Severe
- Chance of severe wind over 30 yrs
- 99.0%
Air-quality risk 2/10 · Minimal
- Unhealthy air days now
- 1 days/yr
- Unhealthy air days in 30 yrs
- 1 days/yr
Risk factors via First Street. Map © Google.
Why this score? — see what drove the C grade
The composite is a weighted blend of 9 inputs, each scored 0–100. Each bar is that input's sub-score; the figure is the points it added to the 100-point composite (weight × sub-score).
- Cash flow +25.4/30.0
- DSCR +8.4/10.0
- ARV discount +6.3/15.0
- 1% rule +5.4/10.0
- Livability +3.7/5.0
- Schools +3.2/10.0
- Rent growth +2.5/5.0
- Condition / age +2.5/5.0
- Appreciation +0.0/10.0
$159,000
🖨 Deal sheet (PDF) 📄 Offer letter ✓ Due diligence
Listing remarks
Welcome to this beautifully updated 3-bedroom, 2-bathroom home situated on a spacious corner lot ! This property features a 1-car carport, a 2-car garage with a built-in workbench and separate storage room, plus convenient backyard access. Step inside to a warm and inviting living room with real wood flooring that flows into the kitchen. The kitchen is equipped with granite countertops, a gas range, under-cabinet lighting, and all appliances remain! Down the hall, you'll find three bedrooms that share an updated bathroom. Just off the kitchen is a laundry/storage area that leads into a large second living room or flex space filled with possibilities! Whether you need a primary suite, home o
Key facts
- 9,583 sq ft lot
- 2 garage spots
- Listed 20 days
Property features AI
Exterior
- Parking: Attached garage; Detached carport; Open parking; 3 covered parking spaces; Total parking for 3 vehicles
- Utilities: Public sewer; Electric service with CLECO
- Home design: Single-family residence; City street frontage on a paved road
- Construction: Frame construction; Asbestos siding material; Composition and metal roof
- Exterior features: Open porch; Outdoor lighting; Chain link and wood fencing with gate
Interior
- Kitchen: Gas stove; Refrigerator
- Flooring: Tile flooring; Wood flooring
- Bathrooms: 2 full bathrooms
- Heating & cooling: Central heating (natural gas); Central air conditioning
- Interior features: Crown molding; Solid surface counters; Window treatments; Double-pane windows; Lighting
- Laundry & utility: Washer hookup; Washer included; Washer and dryer hookups for electric and gas; Dryer included
Neighborhood map
What this means for you Summary
Snapshot
- This is a 3-bed/2.0-bath single-family listed at $159k.
Deal economics
- At list price, monthly cash flow is $302 ($4k/yr) — positive.
- The deal already cash-flows at list — no discount required.
- Meets the 1% rule at list price ($2k rent vs $159k).
- Recommended offer: $157k (1.5% below list) — sets the bar for market timing.
- Cap rate 9.1% vs local median 5.8% in New Iberia — top-decile yield for the area; either an underpriced asset or a hidden risk that comps aren't pricing in. Stress-test before assuming the spread holds.
Location & tenants
- Location reads 73/100 on livability (#33 in LA) — a middle-class / working-renter tenant base. Strengths: cost of living A+, housing A+, health & safety A+; Watch: commute D+, crime F, employment F.
- Iberia Parish (other): math 32% / reading 43% proficiency, ranked #27 of 98 in LA (top 28%) — families likely to look elsewhere, expect single-tenant / working-renter base with shorter leases; 66% free/reduced lunch — lower-income household profile, screen leases tightly.
- Zoned schools: North Lewis Elementary School (math 43% / reading 57%, grade D+, #125 of 646 statewide, top 20%, 520 students, 54% FRL); Belle Place Middle School (math 31% / reading 54%, grade D-, #57 of 218 statewide, top 26%, 413 students, 65% FRL); New Iberia Senior High School (math 35% / reading 52%, grade F, #64 of 265 statewide, top 24%, 1,449 students, 62% FRL).
- Market conditions: 141 active listings in the ZIP; 2 comparable units currently listed for rent nearby; 94 units permitted in Iberia Parish in 2024 (0 in 5+ unit buildings).
Forward outlook
- Local home prices are declining (-3.0%/yr); year-one equity from $1k of loan paydown is wiped out by about $5k of value loss. Plan a longer hold.
- Iberia County population projected to shrink 4% by 2050 — rents likely to lag national; underwrite the cash flow, not the appreciation.
Negotiation context
- It's been on market 20 days — a 2% lower offer ($157k) is reasonable based on typical stale-listing flexibility.
- Current owner paid $37k; list at $159k implies a 330% gain — meaningful room to come down on a strong offer.
Risks & watch-outs
- Watch-outs: flood insurance adds $66/mo.
- Climate carrying-cost: major flood risk; severe wind risk, 99% chance of damaging wind over 30y; extreme-heat days projected 7→22/yr by 2055 (HVAC capex compounding) — expect insurance premiums to compound above CPI over the hold.
Questions for the listing agent
- What's the actual annual flood-insurance premium (NFIP or private), and is the property in a SFHA with mandatory coverage?
- Is there a deadline driving the sale (1031 exchange, divorce, estate, relocation)? That informs how much negotiation room exists.
- Schools are B-rated — typically a magnet for longer-tenancy family renters. What's the average tenant stay here, and is there a school-zone premium baked into asking?
- Crime grade is F in this area — have there been break-ins, vandalism, or insurance claims at this property in the last 3 years? What carrier currently insures it and at what premium?
- What's the average days-on-market for RENTAL listings here right now (not sales)? A rising rental-DOM trend means longer vacancies and softer asking-rent achievability than the comps imply.
- What's the recent tenant-quality profile in this submarket — average credit score on applications, eviction rate, late-payment / NSF rate, and stable-employment percentage? A property-management company in the area should have these aggregated.
- How much new for-sale + rental construction is in the pipeline within 1–3 miles? Heavy new supply typically softens prices + rents 12–24 months out; constrained supply supports both.
Investment metrics
- 1% rule
- 1.04% ✓
- Cap rate
- 9.07%
- Cash-on-cash
- 9.93%
- DSCR
- 1.44
- GRM
- 8.0
CMA / ARV
- ARV (median comp)
- $154,802
- List price
- $159,000
- Delta
- 2.71%
- Verdict
- FAIR
- Comps
- 20 within 1.0 mi
Show comp detail 12 sales within ~0.75 mi
| Address | Dist | Beds/Ba | Sqft | Sold | Price | $/sf | Match |
|---|---|---|---|---|---|---|---|
| 603 Missouri St | 0.10mi | 3/1.5 | 1,538 (-1%) | 0mo | $159,000 | $103 | 91 |
| 402 Azalea Dr | 0.34mi | 3/2.0 | 1,576 (+1%) | 1mo | $145,000 | $92 | 82 |
| 609 Missouri St | 0.12mi | 3/1.5 | 1,476 (-5%) | 8mo | $157,500 | $107 | 77 |
| 425 Missouri St | 0.12mi | 3/1.5 | 1,446 (-7%) | 7mo | $154,500 | $107 | 74 |
| 631 Everette St | 0.12mi | 3/2.0 | 1,730 (+11%) | 2mo | $155,000 | $90 | 74 |
| 414 Ashton St | 0.34mi | 3/1.5 | 1,496 (-4%) | 5mo | $165,000 | $110 | 71 |
| 501 Ernest St | 0.26mi | 3/1.5 | 1,431 (-8%) | 5mo | $143,000 | $100 | 68 |
| 307 Dodson St | 0.49mi | 3/2.0 | 1,641 (+5%) | 6mo | $150,000 | $91 | 63 |
| 405 S Jacqueline Dr | 0.65mi | 2/2.0 (-1) | 1,600 (+3%) | 2mo | $190,000 | $119 | 59 |
| 227 Pollard Ave | 0.68mi | 3/2.0 | 1,650 (+6%) | 4mo | $219,500 | $133 | 56 |
| 311 Live Oak Ln | 0.63mi | 3/2.0 | 1,700 (+9%) | 9mo | $201,000 | $118 | 48 |
| 1002 Rue De Pierre | 0.59mi | 2/2.0 (-1) | 1,337 (-14%) | 9mo | $142,000 | $106 | 36 |
Match score weights: distance 35% · size 25% · config 20% · recency 20%. Top-matched comps best support the ARV.
Projected returns pro-forma
-3.0% appreciation · 3.0% rent growth · sell at horizon
- IRR
- -3.9%
- Equity multiple
- 0.85×
- Total profit
- $-6,563
- Equity at exit
- $23,707
- IRR
- 5.7%
- Equity multiple
- 1.43×
- Total profit
- $18,923
- Equity at exit
- $13,747
Cash invested: $44,520 (down + closing). Projections, not guarantees.
Landlord ↔ Tenant lean methodology
- Overall (STATE)
- 90 Strongly Landlord-Friendly
- State Louisiana
- 90 Strongly Landlord-Friendly · R+12
- County
- — inherits STATE
- City
- — inherits STATE
ZIP-level market 70563
- Home prices YoY
- -35.0%
- Active inventory
- 141
- Price-to-rent
- 8.0×
Monthly cashflow live
- Estimated rent
- $1,657 medium interval (Pro) →
- Mortgage (P&I)
- −$834
- Tax from tax record
- −$41 /mo · $486/yr
- Insurance
- −$66
- Flood insurance flood zone
- −$66 /mo · $798/yr
- HOA
- −$0
- Vacancy / Maint / Mgmt
- −$348
- Net cashflow
- $302
Break-even live
Sensitivity live
| Price | -10% $392 | -5% $347 | +0% $302 | +5% $257 | +10% $212 |
|---|---|---|---|---|---|
| Rent | -10% $171 | -5% $237 | +0% $302 | +5% $367 | +10% $433 |
| Rate | -1.0pp $382 | -0.5pp $342 | base $302 | +0.5pp $261 | +1.0pp $219 |
UW: 25.0% down · 7.5% · 30yr · 1.5% tax · 5.0% vac · 8.0% maint · 8.0% mgmt
Financing live
Cash to close
- Down payment
- $39,750
- Closing costs
- $4,770
- Reserves months
- —
- Total cash needed
- —
Loan-product check · same deal, 3 products live
Conventional
25% down · 7.5% · 30yr
- Down + closing
- —
- Monthly P&I
- —
- Monthly cashflow
- —
- DSCR
- —
- Eligible?
- —
Personal DTI + credit; lowest rate.
DSCR
20% down · 8.5% · 30yr
- Down + closing
- —
- Monthly P&I
- —
- Monthly cashflow
- —
- DSCR
- —
- Eligible?
- —
No personal income docs; deal must DSCR.
Hard money
10% down · 12.0% · 12mo
- Down + closing
- —
- Monthly P&I
- —
- Monthly cashflow
- —
- DSCR
- —
- Eligible?
- —
Short-term bridge; refi at stabilization.
Rent comps 2 comps
| Address | Beds | Baths | Sqft | Rent | $/sqft | DOM | Units | Dist |
|---|---|---|---|---|---|---|---|---|
| 309 Springfield St New Iberia, LA | 3.0 | 2.0 | 1192 | $1,500 | $1.26 | 15d | 1 | 1.23mi |
| 919 Russo St New Iberia, LA | 3.0 | 2.0 | 1520 | $1,800 | $1.18 | 22d | 1 | 1.43mi |
Listing history 19 events
-
2026-06-18days on market $159,000 Active 20 DOM
-
2026-06-17days on market $159,000 Active 19 DOM
-
2026-06-16remarks 699-char remark
-
2026-06-16days on market $159,000 Active 18 DOM
-
2026-06-15days on market $159,000 Active 17 DOM
-
2026-06-14days on market $159,000 Active 15 DOM
-
2026-06-13days on market $159,000 Active 14 DOM
-
2026-06-10days on market $159,000 Active 12 DOM
-
2026-06-09days on market $159,000 Active 11 DOM
-
2026-06-08days on market $159,000 Active 10 DOM
-
2026-06-07days on market $159,000 Active 9 DOM
-
2026-06-05days on market $159,000 Active 6 DOM
-
2026-06-03days on market $159,000 Active 5 DOM
-
2026-06-02days on market $159,000 Active 4 DOM
-
2026-06-01days on market $159,000 Active 3 DOM
-
2026-05-31days on market $159,000 Active 2 DOM
-
2026-05-30pricestatusdays on market $159,000 Active 1 DOM
-
2006-04-21soldstatus
-
1996-08-02soldstatus $37,000
ⓘ Source: listings_history table (triggers on properties + properties_extension) + one-shot
backfill from property_details.listing_events for pre-trigger history.
Tax reassessment forecast LA · Resets to sale price
- Current annual tax
- $486 · $41/mo
- Projected year-2 tax
- $874 · $73/mo
- Expected delta
- +$388/yr (+$32/mo · 79.8%)
ⓘ Screening estimate from a state-policy table — verify with the county assessor before closing.
Climate risk First Street
- Flood 7/10 Severe FEMA zone X (unshaded) · 99% chance over 30 yrs
- Wildfire 1/10 Low
- Heat 9/10 Extreme 7 d/yr ≥108°F today · 22 d/yr by 30 yrs out
- Wind 9/10 Extreme 99% chance of damaging wind over 30 yrs
- Air quality 2/10 Low 1 unhealthy d/yr today · 1 by 30 yrs out
Nearby sold comps map
Loading sold comps map…
Walkable amenities ~0.75 mi
Loading nearby amenities…
Taxation est. · year 1
- Rental income
- $19,884
- − Mortgage interest
- −$8,906
- − Property taxes
- −$486
- − Insurance
- −$1,592
- − Repairs & maintenance
- −$1,591
- − Management
- −$1,591
- − Depreciation
- −$4,625
- Taxable income
- $1,092
- Est. tax owed @ 24.0%
- −$262
- After-tax cash flow
- $3,362/yr
For passive investors: Depreciation is non-cash, so a rental often shows a tax loss while cash-flowing — sheltering income. Rental losses are passive: they offset passive income freely, and up to $25,000/yr can offset ordinary (W-2) income if you actively participate and your MAGI is under $100k (phasing out to $0 by $150k); unused losses carry forward. On sale, claimed depreciation is recaptured at up to 25%, and gains may owe capital-gains tax (a 1031 exchange can defer both). Figures are a year-1 estimate at your 24.0% rate — not tax advice; consult a CPA.
Schools (NCES district)
- District
- Iberia Parish
- NCES district ID
- 2200720
- Math proficiency
- 32% ▼ -43.00%
- Reading proficiency
- 43% ▼ -35.00%
- Median HH income
- $43,289
- Composite
- 31.74/100
- National rank
- #5904
- State rank
- #27 of 98 in LA
Livability — New Iberia
- Score
- 73/100
- State rank
- #33
- US rank
- #5376
Category grades
Schools grade is shown separately in the Schools card above.
Census & demographics
- Census place
- New Iberia, LA
- Population (ZIP)
- 19,947
Population outlook (Iberia County) Hauer SSP2
- Today (2025)
- 74,632 people
- By 2030
- 74,368 · -0.4%
- By 2040
- 73,223 · -1.9%
- By 2050
- 71,728 · -3.9%
- By 2075
- 69,028 · -7.5%
- By 2100
- 65,018 · -12.9%
Race, ethnicity, and origin ACS 2023
- Neighborhood character
- Predominantly White (74%)
- Race & ethnicity
- White 74% Black 16% Two or more races 5% Hispanic / Latino 5% Asian 2%
- Common ancestry
- Lithuanian 19% Slovak 1% Romanian 1%
- Foreign-born
- 2% · Canada, China
- Languages at home
- 91% English-only · French/Haitian/Cajun 4% Spanish 2% Other Indo-European 1%
Political lean MEDSL · Iberia
- 2024 margin
- Solid R (+34.1) · D 32.4% · R 66.5% · Other 1.1%
- 2008→2024 swing
- -11.1pp toward R · 2008: -23.0pp · 2024: -34.1pp
- All cycles
- 2024: R+34.1 2020: R+31.2 2016: R+31.4 2012: R+26.2 2008: R+23.0
Not yet ingested
- Civics
- —
Market trends
- HPI YoY
- ▼ -78.52%
- Current HPI
- 146.1556
- Rent YoY
- —
- Metro
- —
- State GDP YoY
- ▲ 3.29%
- F500 in state
- 10
Industry mix (Fortune 500 HQ in LA)
| Industry | F500 HQs | Revenue |
|---|---|---|
| Telecommunications | 2 | $23B |
|
||
| Utilities | 1 | $12B |
|
||
| Wholesale / Distribution | 1 | $5B |
|
||
| Advertising | 1 | $2B |
|
||
Price history
+329.7% since first listed4 events — show timeline
- 2026-05-29 Listed $159,000 AcadianaMLS
- 2026-05-29 Price Changed $159,000 AcadianaMLS
- 2006-04-21 Sold (Public Records) — Public Records
- 1996-08-02 Sold (Public Records) $37,000 Public Records
Property tax history
-4.2%/yrLatest (2025): $486 · +2.0% YoY. Source: county tax records.
Cash-flow waterfall
monthlySold comps — $/sqft
last 12 mo · ≤1 miLoading sold comps…