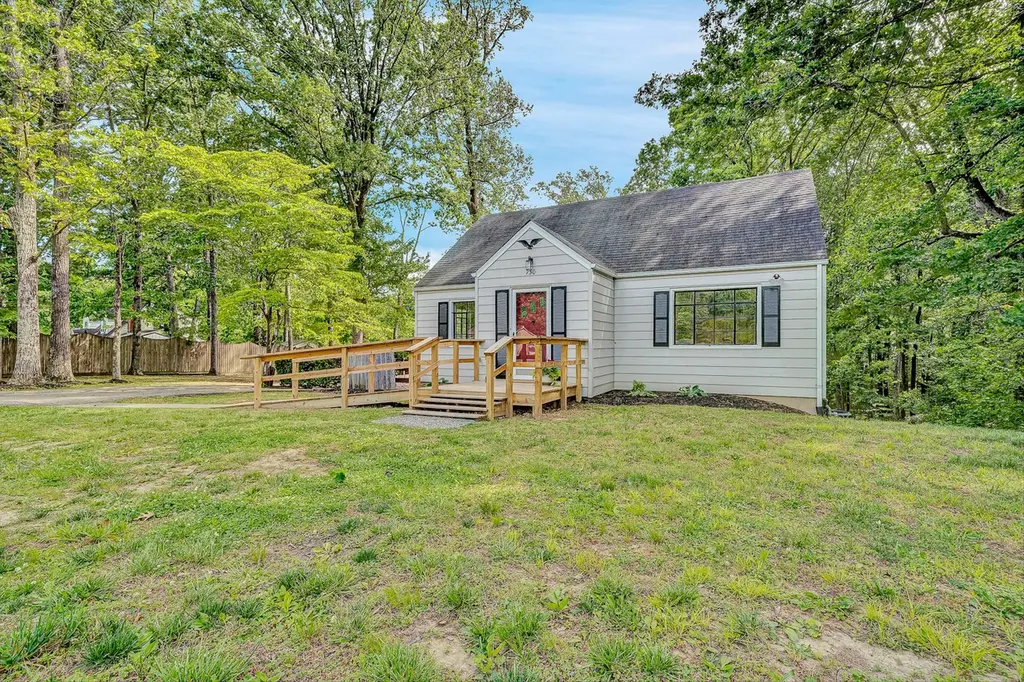
730 Texas Hollow Rd · Salem, VA
Flood risk 1/10 · Minimal
- FEMA flood zone
- X (unshaded)
- Chance of flooding over 30 yrs
- 0.0%
- Est. flood insurance / yr
- $473 – $860
Fire risk 5/10 · Moderate
- Est. fire insurance / yr
- $666 – $1,236
Heat risk 4/10 · Minor
- Hot days now (above 100°F)
- 7 days/yr
- Hot days in 30 yrs
- 20 days/yr
Wind risk 2/10 · Minimal
- Chance of severe wind over 30 yrs
- 1.0%
Air-quality risk 1/10 · Minimal
- Unhealthy air days now
- 0 days/yr
- Unhealthy air days in 30 yrs
- 0 days/yr
Risk factors via First Street. Map © Google.
Why this score? — see what drove the D grade
The composite is a weighted blend of 9 inputs, each scored 0–100. Each bar is that input's sub-score; the figure is the points it added to the 100-point composite (weight × sub-score).
- ARV discount +12.5/15.0
- Cash flow +7.9/30.0
- Schools +6.4/10.0
- Rent growth +4.0/5.0
- Livability +3.9/5.0
- Condition / age +2.5/5.0
- DSCR +1.9/10.0
- 1% rule +1.6/10.0
- Appreciation +0.0/10.0
$289,900
🖨 Deal sheet (PDF) 📄 Offer letter ✓ Due diligence
Listing remarks MLS
This 4 bedroom and 2 bath home is located West of Salem in the Glenvar School district. It features Vinyl siding, some replacement windows, hardwood floors, a wooded lot with nearly 2 acres, a garage, large paved driveway, and a peaceful neighborhood. This home is move in ready but could use some TLC and updates.
Key facts
- Updated countertops
- Modern lighting
- 1.25 acre lot
Tags
Property features AI
Exterior
- Parking: 1 covered parking space; Off-street parking available
- Home design: Residential property; Built in 1947
- Construction: Year built 1947
- Exterior features: 1.25-acre lot; Off-street parking
Interior
- Bedrooms: 4 bedrooms total (2 on the main level)
- Flooring: Wood flooring
- Bathrooms: 2 full bathrooms (1 on the main level)
- Heating & cooling: Forced air gas heating; Has heating; Has cooling
- Interior features: Insulated storm doors; Clad, insulated windows; Wood flooring; 10 total rooms; One fireplace
Neighborhood map
What this means for you Summary
Snapshot
- This is a 3-bed/2.0-bath single-family listed at $290k.
Deal economics
- At list price, monthly cash flow is $-315 ($-4k/yr) — negative.
- To cash-flow at today's rent, offer at most $234k (19.2% below list).
- To meet the 1% rule (rent ≥ 1% of price), the offer needs to be $190k (34.5% below list).
- Recommended offer: $190k (34.5% below list) — sets the bar for 1% rule.
- Cap rate 5.0% vs local median 2.9% in Salem — top-decile yield for the area; either an underpriced asset or a hidden risk that comps aren't pricing in. Stress-test before assuming the spread holds.
Location & tenants
- Location reads 77/100 on livability (#104 in VA, #3,257 nationally) — a middle-class / working-renter tenant base. Strengths: housing A+, health & safety A+, cost of living A; Watch: amenities F, commute F.
- Roanoke County Public School District (suburban): math 71% / reading 78% proficiency, ranked #9 of 131 in VA (top 7%) — strong family-tenant draw, lease renewals of 3-5y typical.
- Zoned schools: Glenvar Elementary (math 47% / reading 67%, grade C+, #597 of 1,108 statewide, top 57%, 347 students, 41% FRL); Glenvar Middle (math 70% / reading 76%, grade A, #58 of 342 statewide, top 17%, 430 students, 35% FRL); Glenvar High (math 87% / reading 92%, grade A+, #8 of 319 statewide, top 3%, 627 students, 32% FRL).
- Market conditions: Rents rising fast (+6.0%/yr); 274 active listings in the ZIP; 1 comparable units currently listed for rent nearby; 360 units permitted in Roanoke County in 2024 (228 in 5+ unit buildings).
- This rent runs 31% of the median local income ($74k/yr) — at the standard rent-burdened threshold; future hikes will face affordability resistance.
Forward outlook
- Local home prices are declining (-3.0%/yr); year-one equity from $2k of loan paydown is wiped out by about $9k of value loss. Plan a longer hold.
- Roanoke County population projected at +5% by 2050 — modest demand growth; plan on rents tracking national, not racing it.
Negotiation context
- Only 2 days on market — expect competitive offers; lowballing is unlikely to land.
- 2 sale attempts since 4y ago with the ask held roughly flat each time — persistent listings suggest the price (not the market) is what's stuck; bring a comps-based counter.
- Current owner paid $192k; list at $290k implies a 51% gain — meaningful room to come down on a strong offer.
Risks & watch-outs
- Watch-outs: built in 1947 — expect roof / HVAC / electrical / plumbing capex.
- Climate carrying-cost: moderate wildfire risk — expect insurance premiums to compound above CPI over the hold.
Questions for the listing agent
- What do current leases actually rent for vs. the listed asking? Can we see a recent rent roll and the last 12 months of T-12 income?
- Built in 1947 — when were the roof, HVAC, electrical panel, plumbing, and water heater last replaced?
- Is there a deadline driving the sale (1031 exchange, divorce, estate, relocation)? That informs how much negotiation room exists.
- Schools are A-rated — typically a magnet for longer-tenancy family renters. What's the average tenant stay here, and is there a school-zone premium baked into asking?
- The area grade is low — what's the realistic commute time and amenity access for the typical tenant pool here? Any planned neighborhood developments (good or bad) we should know about?
- What's the average days-on-market for RENTAL listings here right now (not sales)? A rising rental-DOM trend means longer vacancies and softer asking-rent achievability than the comps imply.
- What's the recent tenant-quality profile in this submarket — average credit score on applications, eviction rate, late-payment / NSF rate, and stable-employment percentage? A property-management company in the area should have these aggregated.
- How much new for-sale + rental construction is in the pipeline within 1–3 miles? Heavy new supply typically softens prices + rents 12–24 months out; constrained supply supports both.
Investment metrics
- 1% rule
- 0.66% ✗
- Cap rate
- 4.99%
- Cash-on-cash
- -4.66%
- DSCR
- 0.79
- GRM
- 12.7
CMA / ARV
- ARV (median comp)
- $326,068
- List price
- $289,900
- Delta
- -11.09%
- Verdict
- UNDERPRICED
- Comps
- 20 within 1.0 mi
Show comp detail 12 sales within ~0.75 mi
| Address | Dist | Beds/Ba | Sqft | Sold | Price | $/sf | Match |
|---|---|---|---|---|---|---|---|
| 2808 Creekwood Dr | 0.36mi | 3/2.0 | 1,750 (-1%) | 3mo | $285,000 | $163 | 79 |
| 3025 Creekwood Dr | 0.31mi | 4/2.0 (+1) | 1,750 (-1%) | 19mo | $285,000 | $163 | 62 |
| 2718 Fletcher St | 0.65mi | 4/2.0 (+1) | 1,750 (-1%) | 4mo | $311,710 | $178 | 59 |
| 4530 Lomond Cir | 0.66mi | 3/2.0 | 1,835 (+4%) | 7mo | $348,000 | $190 | 57 |
| 366 Howard Dr | 0.54mi | 2/2.0 (-1) | 1,719 (-3%) | 9mo | $279,500 | $163 | 57 |
| 2657 Creekwood Dr | 0.31mi | 3/2.0 | 2,000 (+13%) | 16mo | $255,000 | $128 | 50 |
| 2871 Silver Leaf Dr | 0.34mi | 3/2.0 | 2,000 (+13%) | 16mo | $279,900 | $140 | 50 |
| 4503 Alleghany Dr | 0.54mi | 3/2.0 | 1,508 (-15%) | 2mo | $325,000 | $216 | 48 |
| 513 Fort Lewis Blvd | 0.54mi | 4/3.0 (+1) | 1,818 (+3%) | 18mo | $280,000 | $154 | 46 |
| 2829 Creekwood Dr | 0.36mi | 3/1.0 | 2,000 (+13%) | 15mo | $255,000 | $128 | 45 |
| 2617 Beaver Brook Rd | 0.35mi | 3/1.0 | 2,000 (+13%) | 20mo | $247,000 | $124 | 42 |
| 335 Fort Lewis Blvd | 0.72mi | 4/3.0 (+1) | 1,982 (+12%) | 2mo | $370,000 | $187 | 36 |
Match score weights: distance 35% · size 25% · config 20% · recency 20%. Top-matched comps best support the ARV.
Projected returns pro-forma
-3.0% appreciation · 5.98% rent growth · sell at horizon
- IRR
- -21.3%
- Equity multiple
- 0.25×
- Total profit
- $-61,269
- Equity at exit
- $43,225
- IRR
- -9.7%
- Equity multiple
- 0.34×
- Total profit
- $-53,963
- Equity at exit
- $25,065
Cash invested: $81,172 (down + closing). Projections, not guarantees.
Landlord ↔ Tenant lean methodology
- Overall (STATE)
- 55 Moderately Landlord-Leaning
- State Virginia
- 55 Moderately Landlord-Leaning · D+2
- County
- — inherits STATE
- City
- — inherits STATE
ZIP-level market 24153
- Rents YoY
- 6.0%
- Active inventory
- 274
- Price-to-rent
- 12.7×
Monthly cashflow live
- Estimated rent
- $1,899 medium interval (Pro) →
- Mortgage (P&I)
- −$1,520
- Tax from tax record
- −$175 /mo · $2,096/yr
- Insurance
- −$121
- HOA
- −$0
- Vacancy / Maint / Mgmt
- −$399
- Net cashflow
- $-315
Break-even live
Sensitivity live
| Price | -10% $-151 | -5% $-233 | +0% $-315 | +5% $-397 | +10% $-479 |
|---|---|---|---|---|---|
| Rent | -10% $-465 | -5% $-390 | +0% $-315 | +5% $-240 | +10% $-165 |
| Rate | -1.0pp $-169 | -0.5pp $-241 | base $-315 | +0.5pp $-390 | +1.0pp $-467 |
UW: 25.0% down · 7.5% · 30yr · 1.5% tax · 5.0% vac · 8.0% maint · 8.0% mgmt
Financing live
Cash to close
- Down payment
- $72,475
- Closing costs
- $8,697
- Reserves months
- —
- Total cash needed
- —
Loan-product check · same deal, 3 products live
Conventional
25% down · 7.5% · 30yr
- Down + closing
- —
- Monthly P&I
- —
- Monthly cashflow
- —
- DSCR
- —
- Eligible?
- —
Personal DTI + credit; lowest rate.
DSCR
20% down · 8.5% · 30yr
- Down + closing
- —
- Monthly P&I
- —
- Monthly cashflow
- —
- DSCR
- —
- Eligible?
- —
No personal income docs; deal must DSCR.
Hard money
10% down · 12.0% · 12mo
- Down + closing
- —
- Monthly P&I
- —
- Monthly cashflow
- —
- DSCR
- —
- Eligible?
- —
Short-term bridge; refi at stabilization.
Rent comps 1 comps
| Address | Beds | Baths | Sqft | Rent | $/sqft | DOM | Units | Dist |
|---|---|---|---|---|---|---|---|---|
| 2868 Silver Leaf Dr Salem, VA | 4.0 | 2.0 | 1710 | $2,220 | $1.30 | 15d | 1 | 0.33mi |
Listing history 6 events
-
2026-05-08status Pending 705-char remark
-
2026-05-06$289,900 Active 705-char remark
-
2022-06-03soldstatus $192,000
-
2022-06-02soldstatus $192,000 Closed 316-char remark
Show marketing remark (316 chars)
This 4 bedroom and 2 bath home is located West of Salem in the Glenvar School district. It features Vinyl siding, some replacement windows, hardwood floors, a wooded lot with nearly 2 acres, a garage, large paved driveway, and a peaceful neighborhood. This home is move in ready but could use some TLC and updates.
-
2022-04-29$190,000 316-char remark
Show marketing remark (316 chars)
This 4 bedroom and 2 bath home is located West of Salem in the Glenvar School district. It features Vinyl siding, some replacement windows, hardwood floors, a wooded lot with nearly 2 acres, a garage, large paved driveway, and a peaceful neighborhood. This home is move in ready but could use some TLC and updates.
-
2022-04-29historical 316-char remark
Show marketing remark (316 chars)
This 4 bedroom and 2 bath home is located West of Salem in the Glenvar School district. It features Vinyl siding, some replacement windows, hardwood floors, a wooded lot with nearly 2 acres, a garage, large paved driveway, and a peaceful neighborhood. This home is move in ready but could use some TLC and updates.
ⓘ Source: listings_history table (triggers on properties + properties_extension) + one-shot
backfill from property_details.listing_events for pre-trigger history.
Tax reassessment forecast VA · Resets to sale price
- Current annual tax
- $2,096 · $175/mo
- Projected year-2 tax
- $2,377 · $198/mo
- Expected delta
- +$281/yr (+$23/mo · 13.4%)
ⓘ Screening estimate from a state-policy table — verify with the county assessor before closing.
Climate risk First Street
- Flood 1/10 Low FEMA zone X (unshaded) · 0% chance over 30 yrs
- Wildfire 5/10 Major
- Heat 4/10 Moderate 7 d/yr ≥100°F today · 20 d/yr by 30 yrs out
- Wind 2/10 Low 100% chance of damaging wind over 30 yrs
- Air quality 1/10 Low 0 unhealthy d/yr today · 0 by 30 yrs out
Nearby sold comps map
Loading sold comps map…
Walkable amenities ~0.75 mi
Loading nearby amenities…
Taxation est. · year 1
- Rental income
- $22,794
- − Mortgage interest
- −$16,239
- − Property taxes
- −$2,096
- − Insurance
- −$1,450
- − Repairs & maintenance
- −$1,824
- − Management
- −$1,824
- − Depreciation
- −$8,433
- Taxable loss
- −$9,071
- Est. tax savings @ 24.0%
- +$2,177
- After-tax cash flow
- $-1,605/yr
For passive investors: Depreciation is non-cash, so a rental often shows a tax loss while cash-flowing — sheltering income. Rental losses are passive: they offset passive income freely, and up to $25,000/yr can offset ordinary (W-2) income if you actively participate and your MAGI is under $100k (phasing out to $0 by $150k); unused losses carry forward. On sale, claimed depreciation is recaptured at up to 25%, and gains may owe capital-gains tax (a 1031 exchange can defer both). Figures are a year-1 estimate at your 24.0% rate — not tax advice; consult a CPA.
Schools (NCES district)
- District
- Roanoke County Public School District
- NCES district ID
- 5103330
- Math proficiency
- 71% ▼ -19.00%
- Reading proficiency
- 78% ▼ -6.00%
- Median HH income
- $60,526
- Composite
- 64.08/100
- National rank
- #578
- State rank
- #9 of 131 in VA
Livability — Salem
- Score
- 77/100
- State rank
- #104
- US rank
- #3257
Category grades
Schools grade is shown separately in the Schools card above.
Census & demographics
- County
- Salem City · 38,914 people
- City population
- 38,914
- Metro
- Roanoke, VA
- Population (ZIP)
- 38,914
- Household income
- $74,260
- Rent vs Own
- Severe rent burden
- 1115.0
Population outlook (Roanoke County) Hauer SSP2
- Today (2025)
- 98,162 people
- By 2030
- 99,793 · +1.7%
- By 2040
- 101,965 · +3.9%
- By 2050
- 103,328 · +5.3%
- By 2075
- 108,641 · +10.7%
- By 2100
- 104,845 · +6.8%
Race, ethnicity, and origin ACS 2023
- Neighborhood character
- Predominantly White (84%)
- Race & ethnicity
- White 84% Black 6% Hispanic / Latino 4% Two or more races 4% Asian 2%
- Common ancestry
- Serbian 2% Slovak 2% Romanian 1%
- Foreign-born
- 4% · Canada, China
- Languages at home
- 96% English-only · Spanish 2% Other Indo-European 1%
Political lean MEDSL · Roanoke
- 2024 margin
- Strong R (+22.5) · D 38.2% · R 60.7% · Other 1.1%
- 2008→2024 swing
- -1.4pp toward R · 2008: -21.1pp · 2024: -22.5pp
- All cycles
- 2024: R+22.5 2020: R+21.8 2016: R+28.1 2012: R+25.6 2008: R+21.1
Not yet ingested
- Civics
- —
Market trends
- HPI YoY
- ▼ -259.46%
- Current HPI
- 170.8986
- Rent YoY
- ▲ 5.98%
- Metro
- Roanoke, VA
- State GDP YoY
- ▲ 2.40%
- F500 in state
- 50
Industry mix (Fortune 500 HQ in VA)
| Industry | F500 HQs | Revenue |
|---|---|---|
| Aerospace / Defense | 4 | $236B |
|
||
| Technology / Defense | 3 | $32B |
|
||
| Financial Services | 2 | $176B |
|
||
| Utilities | 2 | $27B |
|
||
| Insurance | 2 | $25B |
|
||
| Technology | 2 | $15B |
|
||
Price history
+52.6% since first listed6 events — show timeline
- 2026-05-08 Pending — MLSRV
- 2026-05-06 Listed $289,900 MLSRV
- 2022-06-03 Sold (Public Records) $192,000 Public Records
- 2022-06-02 Sold (MLS) $192,000 MLSRV
- 2022-04-29 Listing Removed — MLSRV
- 2022-04-29 Listed $190,000 MLSRV
Property tax history
+3.5%/yrLatest (2025): $2,096 · +5.5% YoY. Source: county tax records.
Cash-flow waterfall
monthlySold comps — $/sqft
last 12 mo · ≤1 miLoading sold comps…