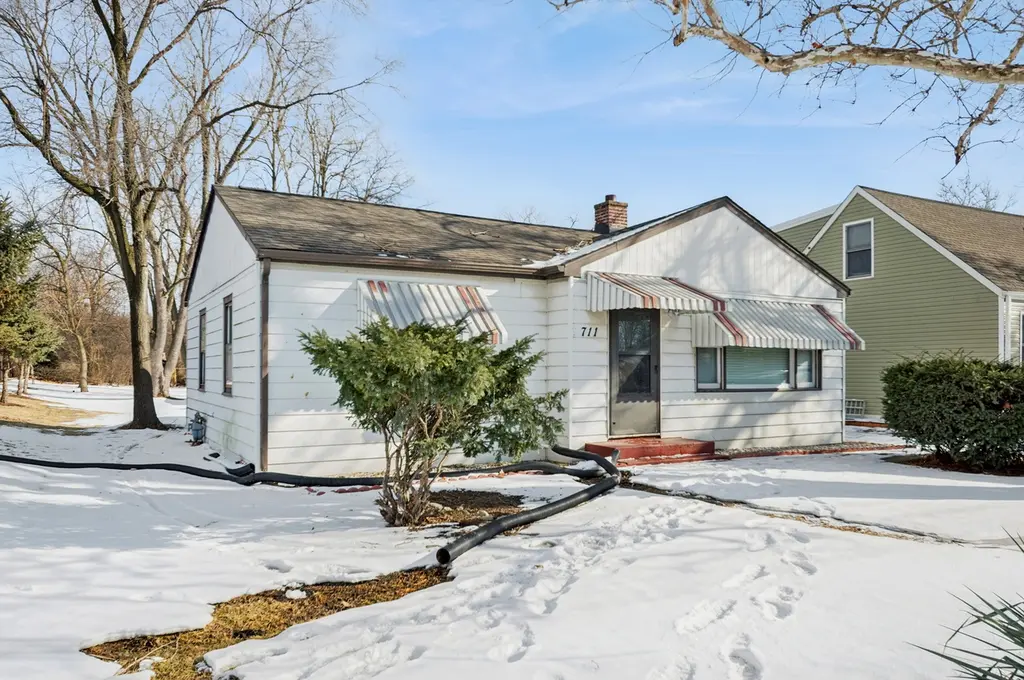
711 N Columbine Ave · Lombard, IL
Flood risk 1/10 · Minimal
- FEMA flood zone
- X (unshaded)
- Chance of flooding over 30 yrs
- 0.0%
- Est. flood insurance / yr
- $473 – $860
Fire risk 1/10 · Minimal
- Est. fire insurance / yr
- $804 – $1,492
Heat risk 2/10 · Minimal
- Hot days now (above 102°F)
- 7 days/yr
- Hot days in 30 yrs
- 13 days/yr
Wind risk 2/10 · Minimal
- Chance of severe wind over 30 yrs
- —
Air-quality risk 4/10 · Minor
- Unhealthy air days now
- 4 days/yr
- Unhealthy air days in 30 yrs
- 5 days/yr
Risk factors via First Street. Map © Google.
Why this score? — see what drove the F grade
The composite is a weighted blend of 9 inputs, each scored 0–100. Each bar is that input's sub-score; the figure is the points it added to the 100-point composite (weight × sub-score).
- ARV discount +11.0/15.0
- Cash flow +7.0/30.0
- Schools +3.6/10.0
- Livability +3.6/5.0
- 1% rule +2.8/10.0
- Rent growth +2.7/5.0
- Condition / age +2.5/5.0
- DSCR +1.2/10.0
- Appreciation +0.0/10.0
$255,000
🖨 Deal sheet 📄 Offer letter ✓ Due diligence
Listing remarks MLS
Three bedroom ranch home with deep (267 ft) lot in Lombard! Eat in kitchen with Maple cabinetry, luxury vinyl plank flooring, and freshly painted in today's modern grey color scheme, all in a great open floor plan. Upgrades include Newer Furnace and windows, & Brand New Luxury Vinyl Plank Flooring, Hot Water Heater, & Roof in last 12 months. 2 car garage! Yard backs to 20 acre nature area and Forest Preserve District lands. Easy access to North Ave and I 355. (Note - Columbine is a busy street!)
Key facts
- Open floor plan
- Newer furnace
- Deep lot
Tags
Property features AI
Finance
- Other: Built before 1978
- Financial info: Special service area: No
- HOA & community: No master association fee required
Exterior
- Parking: Detached garage (owned), 2 garage spaces, 2 total parking spaces
- Utilities: Well water; Septic tank sewer
- Home design: Detached single-family home; One-story; Fee simple ownership; Estimated living area
- Construction: Built 71–80 years ago; Cedar and frame construction
- Exterior features: Lot approximately 50 x 267; Lot size roughly 0.25–0.49 acre; Directions: St Charles Road to Columbine (Rt. 53) north to home
Interior
- Kitchen: Kitchen on main level, approximately 17 x 10
- Bedrooms: 3 bedrooms (all on main level); Master bedroom on main level, approximately 14 x 10; Second bedroom on main level, approximately 11 x 10; Third bedroom on main level, approximately 10 x 10
- Bathrooms: 1 full bathroom
- Heating & cooling: Forced air heating; Central air conditioning
- Interior features: 6 total rooms; Full unfinished basement
- Laundry & utility: Laundry room
Neighborhood map
What this means for you Summary
Snapshot
- This is a 2-bed/1.0-bath single-family listed at $255k.
Deal economics
- At list price, monthly cash flow is $-380 ($-5k/yr) — negative.
- To cash-flow at today's rent, offer at most $188k (26.3% below list).
- To meet the 1% rule (rent ≥ 1% of price), the offer needs to be $199k (21.9% below list).
- Recommended offer: $188k (26.3% below list) — sets the bar for cash-flow.
Location & tenants
- Location reads 72/100 on livability (#314 in IL) — a middle-class / working-renter tenant base. Strengths: employment A+, housing A+, crime A-; Watch: cost of living C-, health & safety D+, amenities F.
- Glenbard Twp Hsd 87 (suburban): math 38% / reading 40% proficiency, ranked #126 of 620 in IL (top 20%) — families likely to look elsewhere, expect single-tenant / working-renter base with shorter leases.
- Market conditions: Rents flat; 136 active listings in the ZIP; 6 comparable units currently listed for rent nearby; rentals at typical pace (median 24d on market — plan ~3-4 weeks tenant-placement turnaround); solid renter incomes; 1,378 units permitted in DuPage County in 2024 (594 in 5+ unit buildings).
Forward outlook
- Local home prices are declining (-3.0%/yr); year-one equity from $2k of loan paydown is wiped out by about $8k of value loss. Plan a longer hold.
Negotiation context
- Only 7 days on market — expect competitive offers; lowballing is unlikely to land.
- 4 sale attempts since 12y ago; this cycle's ask has dropped $30k (11%) from the opening price — seller is motivated, your offer sets the floor, not the list.
Risks & watch-outs
- Watch-outs: built in 1953 — expect roof / HVAC / electrical / plumbing capex.
Questions for the listing agent
- What do current leases actually rent for vs. the listed asking? Can we see a recent rent roll and the last 12 months of T-12 income?
- Built in 1953 — when were the roof, HVAC, electrical panel, plumbing, and water heater last replaced?
- Is there a deadline driving the sale (1031 exchange, divorce, estate, relocation)? That informs how much negotiation room exists.
- Schools are B-rated — typically a magnet for longer-tenancy family renters. What's the average tenant stay here, and is there a school-zone premium baked into asking?
- The area grade is low — what's the realistic commute time and amenity access for the typical tenant pool here? Any planned neighborhood developments (good or bad) we should know about?
- What's the average days-on-market for RENTAL listings here right now (not sales)? A rising rental-DOM trend means longer vacancies and softer asking-rent achievability than the comps imply.
- What's the recent tenant-quality profile in this submarket — average credit score on applications, eviction rate, late-payment / NSF rate, and stable-employment percentage? A property-management company in the area should have these aggregated.
- How much new for-sale + rental construction is in the pipeline within 1–3 miles? Heavy new supply typically softens prices + rents 12–24 months out; constrained supply supports both.
Investment metrics
- 1% rule
- 0.78% ✗
- Cap rate
- 4.51%
- Cash-on-cash
- -6.38%
- DSCR
- 0.72
- GRM
- 10.7
CMA / ARV
- ARV (on-the-fly)
- $276,276
- Comps found
- 8
Show comp detail 8 sales within ~0.75 mi
| Address | Dist | Beds/Ba | Sqft | Sold | Price | $/sf | Match |
|---|---|---|---|---|---|---|---|
| 344 N Elizabeth St | 0.64mi | 2/1.0 | 834 (-3%) | 3mo | $365,000 | $438 | 63 |
| 125 W North Ave | 0.56mi | 2/1.0 | 884 (+3%) | 9mo | $280,000 | $317 | 62 |
| 518 W Meadow Ave | 0.54mi | 2/1.0 | 922 (+8%) | 12mo | $297,000 | $322 | 52 |
| 115 W North Ave | 0.58mi | 2/1.0 | 900 (+5%) | 16mo | $285,000 | $317 | 52 |
| 212 W Crystal Ave | 0.57mi | 2/1.0 | 900 (+5%) | 20mo | $310,000 | $344 | 48 |
| 200 W Crystal Ave | 0.59mi | 2/2.0 | 900 (+5%) | 17mo | $302,000 | $336 | 46 |
| 124 W Sunset Ave | 0.56mi | 2/1.0 | 982 (+14%) | 7mo | $315,000 | $321 | 44 |
| 532 N Main St | 0.74mi | 2/1.0 | 900 (+5%) | 23mo | $279,000 | $310 | 38 |
Match score weights: distance 35% · size 25% · config 20% · recency 20%. Top-matched comps best support the ARV.
Projected returns pro-forma
-3.0% appreciation · 0.94% rent growth · sell at horizon
- IRR
- -29.8%
- Equity multiple
- 0.03×
- Total profit
- $-69,395
- Equity at exit
- $38,021
- IRR
- -44.4%
- Equity multiple
- -0.50×
- Total profit
- $-106,891
- Equity at exit
- $22,048
Cash invested: $71,400 (down + closing). Projections, not guarantees.
Landlord ↔ Tenant lean methodology
- Overall (STATE)
- 43 Moderately Tenant-Leaning
- State Illinois
- 43 Moderately Tenant-Leaning · D+7
- County
- — inherits STATE
- City
- — inherits STATE
ZIP-level market 60148
- Rents YoY
- 0.9%
- Active inventory
- 136
- Price-to-rent
- 10.7×
Monthly cashflow live
- Estimated rent
- $1,992 high interval (Pro) →
- Mortgage (P&I)
- −$1,337
- Tax from tax record
- −$510 /mo · $6,122/yr
- Insurance
- −$106
- HOA
- −$0
- Vacancy / Maint / Mgmt
- −$418
- Net cashflow
- $-380
Break-even live
UW: 25.0% down · 7.5% · 30yr · 1.5% tax · 5.0% vac · 8.0% maint · 8.0% mgmt
Financing live
Cash to close
- Down payment
- $63,750
- Closing costs
- $7,650
- Reserves months
- —
- Total cash needed
- —
Loan-product check · same deal, 3 products live
Conventional
25% down · 7.5% · 30yr
- Down + closing
- —
- Monthly P&I
- —
- Monthly cashflow
- —
- DSCR
- —
- Eligible?
- —
Personal DTI + credit; lowest rate.
DSCR
20% down · 8.5% · 30yr
- Down + closing
- —
- Monthly P&I
- —
- Monthly cashflow
- —
- DSCR
- —
- Eligible?
- —
No personal income docs; deal must DSCR.
Hard money
10% down · 12.0% · 12mo
- Down + closing
- —
- Monthly P&I
- —
- Monthly cashflow
- —
- DSCR
- —
- Eligible?
- —
Short-term bridge; refi at stabilization.
Rent comps 6 comps
| Address | Beds | Baths | Sqft | Rent | $/sqft | DOM | Units | Dist |
|---|---|---|---|---|---|---|---|---|
| 21W581 North Ave #36 Lombard, IL | 1.0 | 1.0 | 727 | $1,800 | $2.48 | 14d | 1 | 0.76mi |
| 10 Woodland Ct Lombard, IL | 1.0–2.0 | 1.0–1.5 | 950 | $1,685 | $1.77 | 24d | 1 | 0.80mi |
| 105 E Grove St Unit 2 Lombard, IL | 1.0 | 1.0 | 565 | $1,575 | $2.79 | 24d | 1 | 1.28mi |
| 1 S Lincoln Ave #208 Lombard, IL | 1.0 | 1.0 | 1071 | $2,150 | $2.01 | 16d | 1 | 1.28mi |
| 1 S Lincoln Ave #208 Lombard, IL | 1.0 | 1.0 | 1071 | $2,300 | $2.15 | 24d | 1 | 1.28mi |
| 101 S Main St Lombard, IL | 1.0 | 1.0 | 749 | $2,446 | $3.26 | 1d | 2 | 1.36mi |
Listing history 32 events
-
2026-06-18days on market $255,000 Active 7 DOM
-
2026-06-17days on market $255,000 Active 6 DOM
-
2026-06-16days on market $255,000 Active 5 DOM
-
2026-06-15days on market $255,000 Active 4 DOM
-
2026-06-13days on market $255,000 Active 2 DOM
-
2026-06-13pricestatusdays on market $255,000 Active 1 DOM
-
2026-06-09days on market $284,999 Contingent - Continue to Show 85 DOM
-
2026-06-08days on market $284,999 Contingent - Continue to Show 84 DOM
-
2026-06-07days on market $284,999 Contingent - Continue to Show 83 DOM
-
2026-06-04days on market $284,999 Contingent - Continue to Show 80 DOM
-
2026-06-03days on market $284,999 Contingent - Continue to Show 79 DOM
-
2026-06-02days on market $284,999 Contingent - Continue to Show 78 DOM
-
2026-06-01days on market $284,999 Contingent - Continue to Show 77 DOM
-
2026-05-31days on market $284,999 Contingent - Continue to Show 76 DOM
-
2026-05-11historical Contingent - Continue to Show
-
2026-03-16$284,999 Active
-
2026-03-16historical
-
2026-02-11Active
-
2022-12-14soldstatus $240,000
-
2022-11-29soldstatus $240,000 Closed 526-char remark
Show marketing remark (526 chars)
Three bedroom ranch home with deep (267 ft) lot in Lombard! Eat in kitchen with Maple cabinetry, luxury vinyl plank flooring, and freshly painted in today's modern grey color scheme, all in a great open floor plan. Upgrades include Newer Furnace and windows, & Brand New Luxury Vinyl Plank Flooring, Hot Water Heater, & Roof in last 12 months. 2 car garage! Yard backs to 20 acre nature area and Forest Preserve District lands. Easy access to North Ave and I 355. (Note - Columbine is a busy street!)
-
2022-11-04historical Contingent - Continue to Show 526-char remark
Show marketing remark (526 chars)
Three bedroom ranch home with deep (267 ft) lot in Lombard! Eat in kitchen with Maple cabinetry, luxury vinyl plank flooring, and freshly painted in today's modern grey color scheme, all in a great open floor plan. Upgrades include Newer Furnace and windows, & Brand New Luxury Vinyl Plank Flooring, Hot Water Heater, & Roof in last 12 months. 2 car garage! Yard backs to 20 acre nature area and Forest Preserve District lands. Easy access to North Ave and I 355. (Note - Columbine is a busy street!)
-
2022-09-01$239,900 Active 526-char remark
Show marketing remark (526 chars)
Three bedroom ranch home with deep (267 ft) lot in Lombard! Eat in kitchen with Maple cabinetry, luxury vinyl plank flooring, and freshly painted in today's modern grey color scheme, all in a great open floor plan. Upgrades include Newer Furnace and windows, & Brand New Luxury Vinyl Plank Flooring, Hot Water Heater, & Roof in last 12 months. 2 car garage! Yard backs to 20 acre nature area and Forest Preserve District lands. Easy access to North Ave and I 355. (Note - Columbine is a busy street!)
-
2015-02-27soldstatus $85,000 Closed Sale
-
2015-02-03historical Contingent
-
2014-12-23price $109,900
-
2014-11-21price $129,900
-
2014-10-23price $139,900
-
2014-09-25price $144,900
-
2014-08-26price $152,900 Price Change
-
2014-07-26$164,900 New
-
2000-09-01soldstatus $120,000
-
1993-05-24soldstatus $58,000
ⓘ Source: listings_history table (triggers on properties + properties_extension) + one-shot
backfill from property_details.listing_events for pre-trigger history.
Tax reassessment forecast IL · Partial reset (capped growth)
- Current annual tax
- $6,122 · $510/mo
- Projected year-2 tax
- $6,122 · $510/mo
- Expected delta
- $0/yr ($0/mo · 0.0%)
ⓘ Screening estimate from a state-policy table — verify with the county assessor before closing.
Climate risk First Street
- Flood 1/10 Low FEMA zone X (unshaded) · 0% chance over 30 yrs
- Wildfire 1/10 Low
- Heat 2/10 Low 7 d/yr ≥102°F today · 13 d/yr by 30 yrs out
- Wind 2/10 Low
- Air quality 4/10 Moderate 4 unhealthy d/yr today · 5 by 30 yrs out
Nearby sold comps map
Loading sold comps map…
Walkable amenities ~0.75 mi
Loading nearby amenities…
Taxation est. · year 1
- Rental income
- $23,910
- − Mortgage interest
- −$14,284
- − Property taxes
- −$6,122
- − Insurance
- −$1,275
- − Repairs & maintenance
- −$1,913
- − Management
- −$1,913
- − Depreciation
- −$7,418
- Taxable loss
- −$9,015
- Est. tax savings @ 24.0%
- +$2,163
- After-tax cash flow
- $-2,391/yr
For passive investors: Depreciation is non-cash, so a rental often shows a tax loss while cash-flowing — sheltering income. Rental losses are passive: they offset passive income freely, and up to $25,000/yr can offset ordinary (W-2) income if you actively participate and your MAGI is under $100k (phasing out to $0 by $150k); unused losses carry forward. On sale, claimed depreciation is recaptured at up to 25%, and gains may owe capital-gains tax (a 1031 exchange can defer both). Figures are a year-1 estimate at your 24.0% rate — not tax advice; consult a CPA.
Schools (NCES district)
- District
- Glenbard Twp Hsd 87
- NCES district ID
- 1716830
- Math proficiency
- 38% ▼ -5.00%
- Reading proficiency
- 40% ▼ -4.00%
- Median HH income
- $79,535
- Composite
- 36.49/100
- National rank
- #4651
- State rank
- #126 of 620 in IL
Livability — Lombard
- Score
- 72/100
- State rank
- #314
- US rank
- #6205
Category grades
Schools grade is shown separately in the Schools card above.
Census & demographics
- Census place
- Lombard, IL
- County
- DuPage County · 904,569 people
- City population
- 52,596
- Metro
- Chicago-Naperville-Elgin, IL-IN-WI
- Population (ZIP)
- 52,596
- Household income
- $100,616
- Rent vs Own
- Severe rent burden
- 1539.0
Population outlook (DuPage County) Hauer SSP2
- Today (2025)
- 960,187 people
- By 2030
- 965,850 · +0.6%
- By 2040
- 965,812 · +0.6%
- By 2050
- 954,890 · -0.6%
- By 2075
- 910,185 · -5.2%
- By 2100
- 816,255 · -15.0%
Race, ethnicity, and origin ACS 2023
- Neighborhood character
- Predominantly White (66%)
- Race & ethnicity
- White 66% Hispanic / Latino 13% Asian 11% Two or more races 9% Black 6%
- Hispanic origin (detail)
- Mexican 9%
- Common ancestry
- Romanian 11% Italian 4% Iranian 2%
- Foreign-born
- 17% · Canada, China, South Korea
- Languages at home
- 75% English-only · Other Indo-European 9% Spanish 9% Russian/Polish/Slavic 3%
Political lean MEDSL · DuPage
- 2024 margin
- D (+13.3) · D 55.9% · R 42.5% · Other 1.6%
- 2008→2024 swing
- +2.5pp toward D · 2008: 10.8pp · 2024: 13.3pp
- All cycles
- 2024: D+13.3 2020: D+18.1 2016: D+14.1 2012: D+1.0 2008: D+10.8
Not yet ingested
- Civics
- —
Market trends
- HPI YoY
- ▼ -282.93%
- Current HPI
- 210.0801
- Rent YoY
- ▲ 0.94%
- Metro
- Chicago-Naperville-Elgin, IL-IN-WI
- State GDP YoY
- ▲ 1.59%
- F500 in state
- 60
Industry mix (Fortune 500 HQ in IL)
| Industry | F500 HQs | Revenue |
|---|---|---|
| Insurance | 4 | $201B |
|
||
| Consumer Goods | 4 | $87B |
|
||
| Industrial Machinery | 3 | $64B |
|
||
| Healthcare | 2 | $55B |
|
||
| Retail / Pharmacy | 1 | $148B |
|
||
| Agriculture / Food | 1 | $86B |
|
||
Price history
+391.4% since first listed18 events — show timeline
- 2026-05-11 Contingent — MRED as Distributed by MLS Grid
- 2026-03-16 Listing Removed — MRED as Distributed by MLS Grid
- 2026-03-16 Listed $284,999 MRED as Distributed by MLS Grid
- 2026-02-11 Listed — MRED as Distributed by MLS Grid
- 2022-12-14 Sold (Public Records) $240,000 Public Records
- 2022-11-29 Sold (MLS) $240,000 MRED as Distributed by MLS Grid
- 2022-11-04 Contingent — MRED as Distributed by MLS Grid
- 2022-09-01 Listed $239,900 MRED as Distributed by MLS Grid
- 2015-02-27 Sold (MLS) $85,000 MRED as Distributed by MLS Grid
- 2015-02-03 Contingent — MRED as Distributed by MLS Grid
- 2014-12-23 Price Changed $109,900 MRED as Distributed by MLS Grid
- 2014-11-21 Price Changed $129,900 MRED as Distributed by MLS Grid
- 2014-10-23 Price Changed $139,900 MRED as Distributed by MLS Grid
- 2014-09-25 Price Changed $144,900 MRED as Distributed by MLS Grid
- 2014-08-26 Price Changed $152,900 MRED as Distributed by MLS Grid
- 2014-07-26 Listed $164,900 MRED as Distributed by MLS Grid
- 2000-09-01 Sold (Public Records) $120,000 Public Records
- 1993-05-24 Sold (Public Records) $58,000 Public Records
Property tax history
+3.5%/yrLatest (2024): $6,122 · +4.5% YoY. Source: county tax records.
Cash-flow waterfall
monthlySold comps — $/sqft
last 12 mo · ≤1 miLoading sold comps…