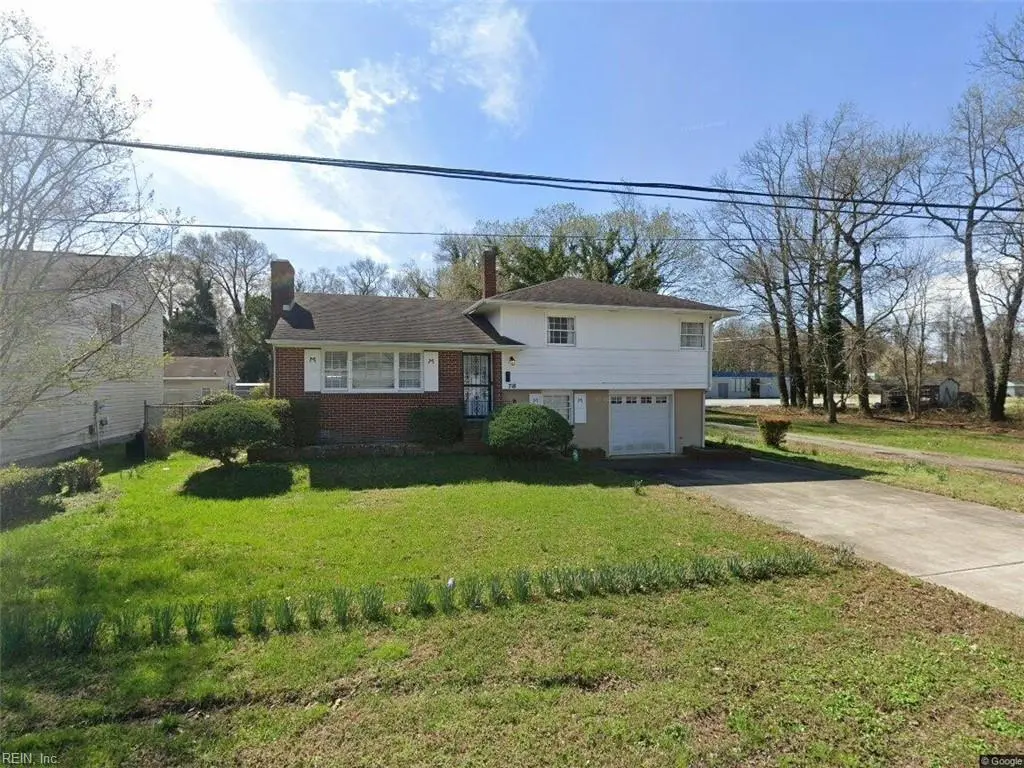
718 Halifax Ave · Hampton, VA
Flood risk 4/10 · Minor
- FEMA flood zone
- X (unshaded)
- Chance of flooding over 30 yrs
- 0.2%
- Est. flood insurance / yr
- $473 – $860
Fire risk 1/10 · Minimal
- Est. fire insurance / yr
- $666 – $1,236
Heat risk 9/10 · Severe
- Hot days now (above 104°F)
- 7 days/yr
- Hot days in 30 yrs
- 16 days/yr
Wind risk 8/10 · Major
- Chance of severe wind over 30 yrs
- 80.0%
Air-quality risk 2/10 · Minimal
- Unhealthy air days now
- 2 days/yr
- Unhealthy air days in 30 yrs
- 2 days/yr
Risk factors via First Street. Map © Google.
Why this score? — see what drove the B- grade
The composite is a weighted blend of 9 inputs, each scored 0–100. Each bar is that input's sub-score; the figure is the points it added to the 100-point composite (weight × sub-score).
- Cash flow +23.5/30.0
- ARV discount +15.0/15.0
- DSCR +7.5/10.0
- 1% rule +6.1/10.0
- Schools +5.5/10.0
- Rent growth +4.7/5.0
- Livability +3.8/5.0
- Condition / age +2.5/5.0
- Appreciation +0.0/10.0
$179,900
🖨 Deal sheet 📄 Offer letter ✓ Due diligence
Listing remarks
This home is the first on the street to be built and was custom built by the original owner and has been in the family since it was constructed. This tri-level home has original hardwood floors and kitchen cabinets, 3 bedrooms, 1.5 baths with a fenced back yard and a fishpond. This home is being sold AS-IS. Buyer is responsible for all closing costs. With a little sweat equity, you can make this one shine once more. Garage door was recently replaced, the exterior of the home has recently been painted and the driveway was recently poured. The seller has tagged items in the property that will not convey with the sale of the house. CASH ONLY.
Key facts
- Fishpond
- Fenced back yard
- Garage door replaced
Tags
Property features AI
Finance
- HOA & community: No HOA or POA fees indicated
Exterior
- Parking: Attached 1-car garage; Two parking spaces (total garage spaces indicated); Garage approximately 342 sq. ft.
- Utilities: City/County water; City/County sewer; Electric water heater
- Home design: Detached property; Tri-level style; Two stories; Crawl foundation
- Construction: Stucco exterior; Wood exterior; Crawlspace foundation; Asphalt shingle roof
- Exterior features: Stucco and wood siding; Back fenced yard; Asphalt shingle roof
Interior
- Kitchen: Dishwasher; Microwave; Electric range; Refrigerator
- Bedrooms: No bedroom with a full bathroom on the first floor
- Flooring: Vinyl flooring; Wood flooring
- Bathrooms: One full bathroom; One half bathroom
- Heating & cooling: Baseboard heating
- Interior features: One fireplace; Vinyl and wood flooring; Six total rooms
- Laundry & utility: Washer hookup; Dryer hookup
Neighborhood map
What this means for you Summary
Snapshot
- This is a 3-bed/1.5-bath single-family listed at $180k.
Deal economics
- At list price, monthly cash flow is $334 ($4k/yr) — positive.
- The deal already cash-flows at list — no discount required.
- Meets the 1% rule at list price ($2k rent vs $180k).
- Cap rate 8.5% vs local median 4.5% in Hampton — top-decile yield for the area; either an underpriced asset or a hidden risk that comps aren't pricing in. Stress-test before assuming the spread holds.
Location & tenants
- Location reads 75/100 on livability (#133 in VA, #4,302 nationally) — a middle-class / working-renter tenant base. Strengths: housing A+, health & safety A+, cost of living A; Watch: crime C-, amenities D+, commute F.
- Hampton City Public School District (urban): math 60% / reading 70% proficiency, ranked #40 of 131 in VA (top 30%) — acceptable for families but not a draw, mixed tenant base, ~2y average lease.
- Zoned schools: Captain John Smith Elementary (math 42% / reading 57%, grade D, #742 of 1,108 statewide, top 70%, 393 students, 82% FRL); Phoebus High (math 57% / reading 76%, grade B, #195 of 319 statewide, top 62%, 1,365 students, 86% FRL) — zoned schools average 84% FRL vs 49% district-wide (35 pts higher); higher-poverty schools than district average — tighter screening recommended.
- Market conditions: Rents rising fast (+8.9%/yr); 42 active listings in the ZIP; 17 comparable units currently listed for rent nearby; rentals lingering (median 44d on market — plan ~5-8 weeks vacancy on turnover, expect pricing pressure); 53% of comp listings sitting > 30 days — soft ceiling on asking rent; 68 units permitted in Hampton city in 2024 (0 in 5+ unit buildings).
- This rent runs 44% of the median local income ($54k/yr) — at the standard rent-burdened threshold; future hikes will face affordability resistance.
Forward outlook
- Local home prices are declining (-3.0%/yr); year-one equity from $1k of loan paydown is wiped out by about $5k of value loss. Plan a longer hold.
- Hampton County population projected at -13% by 2050 — secular population decline; favor cash flow + early exit over multi-decade hold.
- At projected returns (-3.0% appreciation + 8.0% rent growth), your $50k cash investment doubles in ~8 years — after that, you're playing with house money.
Negotiation context
- Only 2 days on market — expect competitive offers; lowballing is unlikely to land.
- 3 sale attempts since 4y ago with the ask held roughly flat each time — persistent listings suggest the price (not the market) is what's stuck; bring a comps-based counter.
- Current owner paid $50k; list at $180k implies a 260% gain — meaningful room to come down on a strong offer.
Risks & watch-outs
- Climate carrying-cost: severe wind risk, 80% chance of damaging wind over 30y; extreme-heat days projected 7→16/yr by 2055 (HVAC capex compounding) — expect insurance premiums to compound above CPI over the hold.
Questions for the listing agent
- Built in 1964 — when were the roof, HVAC, electrical panel, plumbing, and water heater last replaced?
- Is there a deadline driving the sale (1031 exchange, divorce, estate, relocation)? That informs how much negotiation room exists.
- Schools are B-rated — typically a magnet for longer-tenancy family renters. What's the average tenant stay here, and is there a school-zone premium baked into asking?
- What's the average days-on-market for RENTAL listings here right now (not sales)? A rising rental-DOM trend means longer vacancies and softer asking-rent achievability than the comps imply.
- What's the recent tenant-quality profile in this submarket — average credit score on applications, eviction rate, late-payment / NSF rate, and stable-employment percentage? A property-management company in the area should have these aggregated.
- How much new for-sale + rental construction is in the pipeline within 1–3 miles? Heavy new supply typically softens prices + rents 12–24 months out; constrained supply supports both.
Investment metrics
- 1% rule
- 1.11% ✓
- Cap rate
- 8.52%
- Cash-on-cash
- 7.97%
- DSCR
- 1.35
- GRM
- 7.5
CMA / ARV
- ARV (on-the-fly)
- $310,472
- Comps found
- 12
Show comp detail 12 sales within ~0.75 mi
| Address | Dist | Beds/Ba | Sqft | Sold | Price | $/sf | Match |
|---|---|---|---|---|---|---|---|
| 718 Halifax Ave | 0.00mi | 3/1.5 | 1,576 (0%) | 0mo | $186,100 | $118 | 100 |
| 20 Scotland Rd | 0.21mi | 3/2.5 | 1,568 (-0%) | 1mo | $308,500 | $197 | 85 |
| 1314 Saxton Dr | 0.53mi | 4/1.5 (+1) | 1,550 (-2%) | 2mo | $280,000 | $181 | 66 |
| 72 Ireland St | 0.39mi | 3/1.5 | 1,402 (-11%) | 0mo | $310,000 | $221 | 63 |
| 196 E Mercury Blvd | 0.55mi | 3/2.5 | 1,511 (-4%) | 1mo | $325,000 | $215 | 62 |
| 816 Old Point Ave | 0.24mi | 4/2.5 (+1) | 1,748 (+11%) | 2mo | $294,000 | $168 | 60 |
| 1504 E Pembroke Ave | 0.58mi | 3/2.0 | 1,453 (-8%) | 1mo | $180,000 | $124 | 57 |
| 26 Booker St | 0.64mi | 3/2.5 | 1,700 (+8%) | 1mo | $357,700 | $210 | 52 |
| 801 E Mercury Blvd | 0.71mi | 3/1.0 | 1,690 (+7%) | 2mo | $150,000 | $89 | 52 |
| 22 Booker St | 0.65mi | 3/2.5 | 1,700 (+8%) | 2mo | $360,000 | $212 | 51 |
| 146 Cambridge Pl | 0.58mi | 3/1.0 | 1,360 (-14%) | 1mo | $200,000 | $147 | 48 |
| 932 Wilson Ln | 0.65mi | 3/2.0 | 1,400 (-11%) | 2mo | $289,900 | $207 | 47 |
Match score weights: distance 35% · size 25% · config 20% · recency 20%. Top-matched comps best support the ARV.
Projected returns pro-forma
-3.0% appreciation · 8.0% rent growth · sell at horizon
- IRR
- 1.3%
- Equity multiple
- 1.05×
- Total profit
- $2,718
- Equity at exit
- $26,824
- IRR
- 15.4%
- Equity multiple
- 2.55×
- Total profit
- $77,900
- Equity at exit
- $15,554
Cash invested: $50,372 (down + closing). Projections, not guarantees.
Landlord ↔ Tenant lean methodology
- Overall (STATE)
- 55 Moderately Landlord-Leaning
- State Virginia
- 55 Moderately Landlord-Leaning · D+2
- County
- — inherits STATE
- City
- — inherits STATE
ZIP-level market 23605
- Home prices YoY
- -7.6%
- Rents YoY
- 8.9%
- Active inventory
- 42
- Price-to-rent
- 7.5×
Monthly cashflow live
- Estimated rent
- $1,995 high interval (Pro) →
- Mortgage (P&I)
- −$943
- Tax from tax record
- −$224 /mo · $2,682/yr
- Insurance
- −$75
- HOA
- −$0
- Vacancy / Maint / Mgmt
- −$419
- Net cashflow
- $334
Break-even live
UW: 25.0% down · 7.5% · 30yr · 1.5% tax · 5.0% vac · 8.0% maint · 8.0% mgmt
Financing live
Cash to close
- Down payment
- $44,975
- Closing costs
- $5,397
- Reserves months
- —
- Total cash needed
- —
Loan-product check · same deal, 3 products live
Conventional
25% down · 7.5% · 30yr
- Down + closing
- —
- Monthly P&I
- —
- Monthly cashflow
- —
- DSCR
- —
- Eligible?
- —
Personal DTI + credit; lowest rate.
DSCR
20% down · 8.5% · 30yr
- Down + closing
- —
- Monthly P&I
- —
- Monthly cashflow
- —
- DSCR
- —
- Eligible?
- —
No personal income docs; deal must DSCR.
Hard money
10% down · 12.0% · 12mo
- Down + closing
- —
- Monthly P&I
- —
- Monthly cashflow
- —
- DSCR
- —
- Eligible?
- —
Short-term bridge; refi at stabilization.
Rent comps 17 comps
| Address | Beds | Baths | Sqft | Rent | $/sqft | DOM | Units | Dist |
|---|---|---|---|---|---|---|---|---|
| 5 Lacrosse St Hampton, VA | 3.0 | 2.5 | 1612 | $2,500 | $1.55 | 44d | 1 | 0.22mi |
| 221 W Kelly Ave Hampton, VA | 3.0 | 1.0 | 1200 | $2,350 | $1.96 | 44d | 1 | 0.32mi |
| 10 Whipple Dr Hampton, VA | 4.0 | 2.5 | 1564 | $2,300 | $1.47 | 44d | 1 | 0.47mi |
| 305 Old Point Ave Hampton, VA | 3.0 | 1.0 | 1186 | $1,750 | $1.48 | 44d | 1 | 0.52mi |
| 949 N Mallory St Hampton, VA | 2.0 | 1.5 | 1054 | $1,250 | $1.19 | 1d | 1 | 0.55mi |
| 4 Bainbridge Ave Unit B Hampton, VA | 2.0 | 1.5 | 1050 | $1,550 | $1.48 | 44d | 1 | 0.56mi |
| 25 Bainbridge Ave Hampton, VA | 2.0 | 1.5 | 1306 | $1,600 | $1.23 | 1d | 1 | 0.62mi |
| 709 E Pembroke Ave Unit B Hampton, VA | 2.0 | 1.5 | 1664 | $1,349 | $0.81 | 23d | 1 | 0.62mi |
| 19 Magnolia Pl Hampton, VA | 3.0 | 1.5 | 1405 | $2,100 | $1.49 | 14d | 1 | 0.66mi |
| 1210 Pansy St Hampton, VA | 2.0 | 2.0 | 1409 | $2,000 | $1.42 | 44d | 1 | 0.77mi |
| 234 Washington St Hampton, VA | 2.0 | 1.0 | 1111 | $2,000 | $1.80 | 10d | 1 | 1.01mi |
| 212 Dockside Dr Unit B Hampton, VA | 2.0 | 2.0 | 1253 | $1,795 | $1.43 | 44d | 1 | 1.02mi |
| 100 Spanish Trl Hampton, VA | 1.0–2.0 | 1.0–1.5 | 812 | $1,450 | $1.79 | 1d | 12 | 1.29mi |
| 27 Capps Qtrs #1 Hampton, VA | 3.0 | 2.5 | 1734 | $2,200 | $1.27 | 44d | 1 | 1.40mi |
| 2001 Grimes Rd Hampton, VA | 4.0 | 2.0 | 1430 | $2,100 | $1.47 | 3d | 1 | 1.43mi |
| 2000 Neville Cir Hampton, VA | 3.0 | 1.0 | 1100 | $1,750 | $1.59 | 44d | 1 | 1.45mi |
| 17 S Gawain Way Hampton, VA | 3.0 | 1.5 | 1460 | $1,895 | $1.30 | 3d | 1 | 1.47mi |
Listing history 4 events
-
2026-06-07status $179,900 Under Contract 2 DOM
-
2026-06-03days on market $179,900 Active 2 DOM
-
2026-06-02remarks 647-char remark
-
2026-06-02$179,900 Active 1 DOM
ⓘ Source: listings_history table (triggers on properties + properties_extension) + one-shot
backfill from property_details.listing_events for pre-trigger history.
Tax reassessment forecast VA · Resets to sale price
- Current annual tax
- $2,682 · $224/mo
- Projected year-2 tax
- $2,682 · $224/mo
- Expected delta
- $0/yr ($0/mo · 0.0%)
ⓘ Screening estimate from a state-policy table — verify with the county assessor before closing.
Climate risk First Street
- Flood 4/10 Moderate FEMA zone X (unshaded) · 20% chance over 30 yrs
- Wildfire 1/10 Low
- Heat 9/10 Extreme 7 d/yr ≥104°F today · 16 d/yr by 30 yrs out
- Wind 8/10 Severe 80% chance of damaging wind over 30 yrs
- Air quality 2/10 Low 2 unhealthy d/yr today · 2 by 30 yrs out
Nearby sold comps map
Loading sold comps map…
Walkable amenities ~0.75 mi
Loading nearby amenities…
Taxation est. · year 1
- Rental income
- $23,943
- − Mortgage interest
- −$10,077
- − Property taxes
- −$2,682
- − Insurance
- −$900
- − Repairs & maintenance
- −$1,915
- − Management
- −$1,915
- − Depreciation
- −$5,233
- Taxable income
- $1,220
- Est. tax owed @ 24.0%
- −$293
- After-tax cash flow
- $3,720/yr
For passive investors: Depreciation is non-cash, so a rental often shows a tax loss while cash-flowing — sheltering income. Rental losses are passive: they offset passive income freely, and up to $25,000/yr can offset ordinary (W-2) income if you actively participate and your MAGI is under $100k (phasing out to $0 by $150k); unused losses carry forward. On sale, claimed depreciation is recaptured at up to 25%, and gains may owe capital-gains tax (a 1031 exchange can defer both). Figures are a year-1 estimate at your 24.0% rate — not tax advice; consult a CPA.
Schools (NCES district)
- District
- Hampton City Public School District
- NCES district ID
- 5101800
- Math proficiency
- 60% ▼ -21.00%
- Reading proficiency
- 70% ▼ -4.00%
- Median HH income
- $50,089
- Composite
- 55.19/100
- National rank
- #1272
- State rank
- #40 of 131 in VA
Livability — Hampton
- Score
- 75/100
- State rank
- #133
- US rank
- #4302
Category grades
Schools grade is shown separately in the Schools card above.
Census & demographics
- Census place
- Hampton, VA
- County
- Newport News City · 178,950 people
- City population
- 132,421
- Metro
- Virginia Beach-Norfolk-Newport News, VA-NC
- Population (ZIP)
- 13,332
- Household income
- $53,815
- Rent vs Own
- Severe rent burden
- 1119.0
Population outlook (Hampton County) Hauer SSP2
- Today (2025)
- 134,055 people
- By 2030
- 131,753 · -1.7%
- By 2040
- 125,017 · -6.7%
- By 2050
- 116,825 · -12.9%
- By 2075
- 97,033 · -27.6%
- By 2100
- 76,188 · -43.2%
Race, ethnicity, and origin ACS 2023
- Neighborhood character
- Diverse neighborhood (Simpson 0.58)
- Race & ethnicity
- Black 59% White 25% Two or more races 9% Hispanic / Latino 8%
- Hispanic origin (detail)
- Mexican 3% Puerto Rican 3%
- Common ancestry
- Romanian 2% Lithuanian 1% Italian 1%
- Foreign-born
- 5% · Canada, Jamaica
- Languages at home
- 94% English-only · Spanish 5%
Political lean MEDSL · Hampton
- 2024 margin
- Solid D (+39.9) · D 69.2% · R 29.4% · Other 1.4%
- 2008→2024 swing
- +1.0pp no change · 2008: 38.9pp · 2024: 39.9pp
- All cycles
- 2024: D+39.9 2020: D+42.2 2016: D+37.8 2012: D+45.4 2008: D+38.9
Not yet ingested
- Civics
- —
Market trends
- HPI YoY
- ▼ -24.94%
- Current HPI
- 305.0997
- Rent YoY
- ▲ 8.87%
- Metro
- Virginia Beach-Norfolk-Newport News, VA-NC
- State GDP YoY
- ▲ 2.40%
- F500 in state
- 50
Industry mix (Fortune 500 HQ in VA)
| Industry | F500 HQs | Revenue |
|---|---|---|
| Aerospace / Defense | 4 | $236B |
|
||
| Technology / Defense | 3 | $32B |
|
||
| Financial Services | 2 | $176B |
|
||
| Utilities | 2 | $27B |
|
||
| Insurance | 2 | $25B |
|
||
| Technology | 2 | $15B |
|
||
Price history
+259.8% since first listed7 events — show timeline
- 2026-06-01 Listed $179,900 REINMLS
- 2022-06-21 Listing Removed — REINMLS
- 2022-06-04 Relisted — REINMLS
- 2022-05-25 Contingent — REINMLS
- 2022-05-10 Price Changed $200,000 REINMLS
- 2022-04-29 Listed $215,000 REINMLS
- 2005-08-19 Sold (Public Records) $50,000 Public Records
Property tax history
+41.4%/yrLatest (2025): $2,682 · -0.5% YoY. Source: county tax records.
Cash-flow waterfall
monthlySold comps — $/sqft
last 12 mo · ≤1 miLoading sold comps…