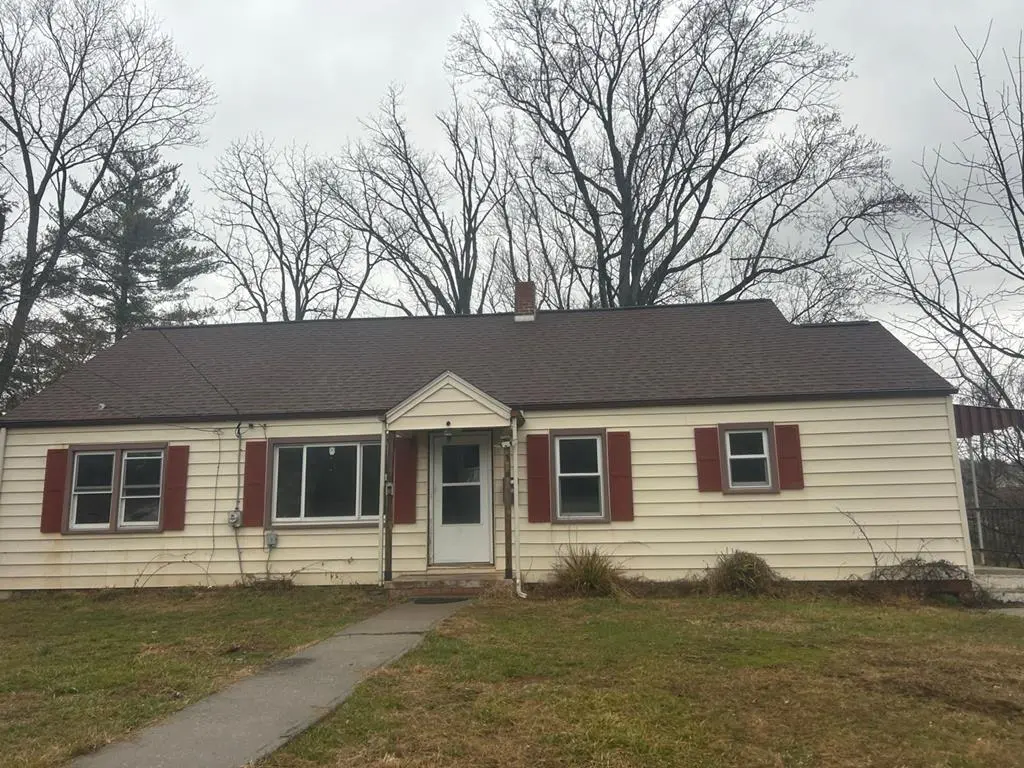
316 Sunset Dr · Pearisburg, VA
Flood risk 1/10 · Minimal
- FEMA flood zone
- X (unshaded)
- Chance of flooding over 30 yrs
- 0.0%
- Est. flood insurance / yr
- $473 – $860
Fire risk 3/10 · Minor
- Est. fire insurance / yr
- $666 – $1,236
Heat risk 4/10 · Minor
- Hot days now (above 95°F)
- 9 days/yr
- Hot days in 30 yrs
- 27 days/yr
Wind risk 2/10 · Minimal
- Chance of severe wind over 30 yrs
- —
Air-quality risk 1/10 · Minimal
- Unhealthy air days now
- 0 days/yr
- Unhealthy air days in 30 yrs
- 0 days/yr
Risk factors via First Street. Map © Google.
Why this score? — see what drove the B grade
The composite is a weighted blend of 9 inputs, each scored 0–100. Each bar is that input's sub-score; the figure is the points it added to the 100-point composite (weight × sub-score).
- Cash flow +30.0/30.0
- 1% rule +10.0/10.0
- DSCR +10.0/10.0
- ARV discount +7.5/15.0
- Schools +5.2/10.0
- Livability +3.7/5.0
- Rent growth +2.5/5.0
- Condition / age +2.5/5.0
- Appreciation +0.0/10.0
$91,000
🖨 Deal sheet 📄 Offer letter ✓ Due diligence
Listing remarks MLS
4 BEDROOM RANCH WITH CONVENIENT IN TOWN LOCATION WITH FULL BASEMENT. WITH A LITTLE TLC, THIS HOME COULD BE A GEM! ESTIMATE USED FOR ACREAGE. BUYER/BUYER'S AGENT TO VERIFY ALL INFORMATION.
Key facts
- 8,712 sq ft lot
- Built 1947
- Listed 102 days
Neighborhood map
What this means for you Summary
Snapshot
- This is a 4-bed/1.0-bath single-family listed at $91k.
Deal economics
- At list price, monthly cash flow is $516 ($6k/yr) — positive.
- The deal already cash-flows at list — no discount required.
- Meets the 1% rule at list price ($1k rent vs $91k).
- Recommended offer: $83k (9.0% below list) — sets the bar for market timing.
Location & tenants
- Location reads 74/100 on livability (#154 in VA, #4,875 nationally) — a middle-class / working-renter tenant base. Strengths: cost of living A+, housing A+, schools A-; Watch: amenities F, commute F.
- Giles County Public School District (rural): math 56% / reading 68% proficiency, ranked #54 of 131 in VA (top 41%) — acceptable for families but not a draw, mixed tenant base, ~2y average lease.
- Market conditions: 37 active listings in the ZIP; 25 units permitted in Giles County in 2024 (0 in 5+ unit buildings).
Forward outlook
- Local home prices are declining (-3.0%/yr); year-one equity from $629 of loan paydown is wiped out by about $3k of value loss. Plan a longer hold.
- Giles County population projected at -18% by 2050 — secular population decline; favor cash flow + early exit over multi-decade hold.
- At projected returns (-3.0% appreciation + 3.0% rent growth), your $25k cash investment doubles in ~5 years — after that, you're playing with house money.
Negotiation context
- It's been on market 103 days — a 9% lower offer ($83k) is reasonable based on typical stale-listing flexibility.
- 2 sale attempts since 8y ago; this cycle's ask has dropped $14k (13%) from the opening price — seller is motivated, your offer sets the floor, not the list.
Risks & watch-outs
- Watch-outs: built in 1947 — expect roof / HVAC / electrical / plumbing capex.
Questions for the listing agent
- It's been on market 103 days. Have you received any prior offers? Is the seller open to a 9% concession, seller financing, or rate buy-down credit?
- Built in 1947 — when were the roof, HVAC, electrical panel, plumbing, and water heater last replaced?
- Why hasn't it sold? Are there any deal-killer items the seller is aware of (foundation, flood, title, zoning, code violations)?
- Is there a deadline driving the sale (1031 exchange, divorce, estate, relocation)? That informs how much negotiation room exists.
- Schools are A-rated — typically a magnet for longer-tenancy family renters. What's the average tenant stay here, and is there a school-zone premium baked into asking?
- What's the average days-on-market for RENTAL listings here right now (not sales)? A rising rental-DOM trend means longer vacancies and softer asking-rent achievability than the comps imply.
- What's the recent tenant-quality profile in this submarket — average credit score on applications, eviction rate, late-payment / NSF rate, and stable-employment percentage? A property-management company in the area should have these aggregated.
- How much new for-sale + rental construction is in the pipeline within 1–3 miles? Heavy new supply typically softens prices + rents 12–24 months out; constrained supply supports both.
Investment metrics
- 1% rule
- 1.50% ✓
- Cap rate
- 13.10%
- Cash-on-cash
- 24.30%
- DSCR
- 2.08
- GRM
- 5.6
CMA / ARV
- ARV (median comp)
- $191,320
- List price
- $91,000
- Delta
- -52.44%
- Verdict
- UNDERPRICED
- Comps
- 20 within 1.0 mi
Show comp detail 1 sale within ~0.75 mi
| Address | Dist | Beds/Ba | Sqft | Sold | Price | $/sf | Match |
|---|---|---|---|---|---|---|---|
| 506 Tyler Ave | 0.49mi | 3/1.0 (-1) | 1,350 (+1%) | 8mo | $189,000 | $140 | 63 |
Match score weights: distance 35% · size 25% · config 20% · recency 20%. Top-matched comps best support the ARV.
Projected returns pro-forma
-3.0% appreciation · 3.0% rent growth · sell at horizon
- IRR
- 17.6%
- Equity multiple
- 1.71×
- Total profit
- $18,088
- Equity at exit
- $13,568
- IRR
- 26.0%
- Equity multiple
- 3.28×
- Total profit
- $57,970
- Equity at exit
- $7,868
Cash invested: $25,480 (down + closing). Projections, not guarantees.
Landlord ↔ Tenant lean methodology
- Overall (STATE)
- 55 Moderately Landlord-Leaning
- State Virginia
- 55 Moderately Landlord-Leaning · D+2
- County
- — inherits STATE
- City
- — inherits STATE
ZIP-level market 24134
- Home prices YoY
- -22.0%
- Active inventory
- 37
- Price-to-rent
- 5.6×
Monthly cashflow live
- Estimated rent
- $1,362 medium interval (Pro) →
- Mortgage (P&I)
- −$477
- Tax from tax record
- −$45 /mo · $539/yr
- Insurance
- −$38
- HOA
- −$0
- Vacancy / Maint / Mgmt
- −$286
- Net cashflow
- $516
Break-even live
UW: 25.0% down · 7.5% · 30yr · 1.5% tax · 5.0% vac · 8.0% maint · 8.0% mgmt
Financing live
Cash to close
- Down payment
- $22,750
- Closing costs
- $2,730
- Reserves months
- —
- Total cash needed
- —
Loan-product check · same deal, 3 products live
Conventional
25% down · 7.5% · 30yr
- Down + closing
- —
- Monthly P&I
- —
- Monthly cashflow
- —
- DSCR
- —
- Eligible?
- —
Personal DTI + credit; lowest rate.
DSCR
20% down · 8.5% · 30yr
- Down + closing
- —
- Monthly P&I
- —
- Monthly cashflow
- —
- DSCR
- —
- Eligible?
- —
No personal income docs; deal must DSCR.
Hard money
10% down · 12.0% · 12mo
- Down + closing
- —
- Monthly P&I
- —
- Monthly cashflow
- —
- DSCR
- —
- Eligible?
- —
Short-term bridge; refi at stabilization.
Listing history 22 events
-
2026-06-19days on market $91,000 Active 103 DOM
-
2026-06-18days on market $91,000 Active 102 DOM
-
2026-06-17days on market $91,000 Active 101 DOM
-
2026-06-16days on market $91,000 Active 100 DOM
-
2026-06-15price $91,000 Active 99 DOM
-
2026-06-15days on market $95,000 Active 99 DOM
-
2026-06-14days on market $95,000 Active 97 DOM
-
2026-06-13days on market $95,000 Active 96 DOM
-
2026-06-10days on market $95,000 Active 94 DOM
-
2026-06-03days on market $95,000 Active 90 DOM
-
2026-06-02days on market $95,000 Active 89 DOM
-
2026-06-01days on market $95,000 Active 88 DOM
-
2026-05-31days on market $95,000 Active 87 DOM
-
2026-05-30days on market $95,000 Active 86 DOM
-
2026-05-15price $95,000 188-char remark
Show marketing remark (188 chars)
4 BEDROOM RANCH WITH CONVENIENT IN TOWN LOCATION WITH FULL BASEMENT. WITH A LITTLE TLC, THIS HOME COULD BE A GEM! ESTIMATE USED FOR ACREAGE. BUYER/BUYER'S AGENT TO VERIFY ALL INFORMATION.
-
2026-04-09price $99,900 188-char remark
Show marketing remark (188 chars)
4 BEDROOM RANCH WITH CONVENIENT IN TOWN LOCATION WITH FULL BASEMENT. WITH A LITTLE TLC, THIS HOME COULD BE A GEM! ESTIMATE USED FOR ACREAGE. BUYER/BUYER'S AGENT TO VERIFY ALL INFORMATION.
-
2026-03-05$104,900 Active 188-char remark
Show marketing remark (188 chars)
4 BEDROOM RANCH WITH CONVENIENT IN TOWN LOCATION WITH FULL BASEMENT. WITH A LITTLE TLC, THIS HOME COULD BE A GEM! ESTIMATE USED FOR ACREAGE. BUYER/BUYER'S AGENT TO VERIFY ALL INFORMATION.
-
2025-10-10soldstatus $108,527
-
2019-06-20soldstatus $97,500
-
2019-06-19soldstatus $97,500 222-char remark
Show marketing remark (222 chars)
New Heat Pump & gas furnace! Beautifully remodeled Ranch w/ private back yard & 4 BDRMS! New carpeting. Fresh interior paint. Updated Bath w/ new tile. Great back deck. Insulated tilt-in windows. Move In Ready!
-
2018-07-11$95,000 222-char remark
Show marketing remark (222 chars)
New Heat Pump & gas furnace! Beautifully remodeled Ranch w/ private back yard & 4 BDRMS! New carpeting. Fresh interior paint. Updated Bath w/ new tile. Great back deck. Insulated tilt-in windows. Move In Ready!
-
2003-11-26soldstatus $64,000
ⓘ Source: listings_history table (triggers on properties + properties_extension) + one-shot
backfill from property_details.listing_events for pre-trigger history.
Tax reassessment forecast VA · Resets to sale price
- Current annual tax
- $539 · $45/mo
- Projected year-2 tax
- $746 · $62/mo
- Expected delta
- +$208/yr (+$17/mo · 38.6%)
ⓘ Screening estimate from a state-policy table — verify with the county assessor before closing.
Climate risk First Street
- Flood 1/10 Low FEMA zone X (unshaded) · 0% chance over 30 yrs
- Wildfire 3/10 Moderate
- Heat 4/10 Moderate 9 d/yr ≥95°F today · 27 d/yr by 30 yrs out
- Wind 2/10 Low
- Air quality 1/10 Low 0 unhealthy d/yr today · 0 by 30 yrs out
Nearby sold comps map
Loading sold comps map…
Walkable amenities ~0.75 mi
Loading nearby amenities…
Taxation est. · year 1
- Rental income
- $16,342
- − Mortgage interest
- −$5,097
- − Property taxes
- −$539
- − Insurance
- −$455
- − Repairs & maintenance
- −$1,307
- − Management
- −$1,307
- − Depreciation
- −$2,647
- Taxable income
- $4,989
- Est. tax owed @ 24.0%
- −$1,197
- After-tax cash flow
- $4,993/yr
For passive investors: Depreciation is non-cash, so a rental often shows a tax loss while cash-flowing — sheltering income. Rental losses are passive: they offset passive income freely, and up to $25,000/yr can offset ordinary (W-2) income if you actively participate and your MAGI is under $100k (phasing out to $0 by $150k); unused losses carry forward. On sale, claimed depreciation is recaptured at up to 25%, and gains may owe capital-gains tax (a 1031 exchange can defer both). Figures are a year-1 estimate at your 24.0% rate — not tax advice; consult a CPA.
Schools (NCES district)
- District
- Giles County Public School District
- NCES district ID
- 5101590
- Math proficiency
- 56% ▼ -26.00%
- Reading proficiency
- 68% ▼ -8.00%
- Median HH income
- $45,394
- Composite
- 52.25/100
- National rank
- #1600
- State rank
- #54 of 131 in VA
Livability — Pearisburg
- Score
- 74/100
- State rank
- #154
- US rank
- #4875
Category grades
Schools grade is shown separately in the Schools card above.
Census & demographics
- Census place
- Pearisburg, VA
- Population (ZIP)
- 5,296
Population outlook (Giles County) Hauer SSP2
- Today (2025)
- 15,868 people
- By 2030
- 15,306 · -3.5%
- By 2040
- 14,149 · -10.8%
- By 2050
- 13,059 · -17.7%
- By 2075
- 10,837 · -31.7%
- By 2100
- 8,648 · -45.5%
Race, ethnicity, and origin ACS 2023
- Neighborhood character
- Predominantly White (93%)
- Race & ethnicity
- White 93% Black 5% Asian 1%
- Common ancestry
- Lithuanian 1% Italian 1%
- Foreign-born
- 3% · Canada
- Languages at home
- 96% English-only · German/W. Germanic 2% Tagalog/Filipino 1%
Political lean MEDSL · Giles
- 2024 margin
- Solid R (+54.5) · D 22.4% · R 76.9%
- 2008→2024 swing
- -38.2pp toward R · 2008: -16.3pp · 2024: -54.5pp
- All cycles
- 2024: R+54.5 2020: R+51.4 2016: R+48.6 2012: R+25.6 2008: R+16.3
Not yet ingested
- Civics
- —
Market trends
- HPI YoY
- ▼ -58.90%
- Current HPI
- 208.9095
- Rent YoY
- —
- Metro
- —
- State GDP YoY
- ▲ 2.40%
- F500 in state
- 50
Industry mix (Fortune 500 HQ in VA)
| Industry | F500 HQs | Revenue |
|---|---|---|
| Aerospace / Defense | 4 | $236B |
|
||
| Technology / Defense | 3 | $32B |
|
||
| Financial Services | 2 | $176B |
|
||
| Utilities | 2 | $27B |
|
||
| Insurance | 2 | $25B |
|
||
| Technology | 2 | $15B |
|
||
Price history
+48.4% since first listed8 events — show timeline
- 2026-05-15 Price Changed $95,000 SWVAR
- 2026-04-09 Price Changed $99,900 SWVAR
- 2026-03-05 Listed $104,900 SWVAR
- 2025-10-10 Sold (Public Records) $108,527 Public Records
- 2019-06-20 Sold (Public Records) $97,500 Public Records
- 2019-06-19 Sold (MLS) $97,500 NRVMLS
- 2018-07-11 Listed $95,000 NRVMLS
- 2003-11-26 Sold (Public Records) $64,000 Public Records
Property tax history
+1.1%/yrLatest (2025): $539 · +0.0% YoY. Source: county tax records.
Cash-flow waterfall
monthlySold comps — $/sqft
last 12 mo · ≤1 miLoading sold comps…