 Multi-family
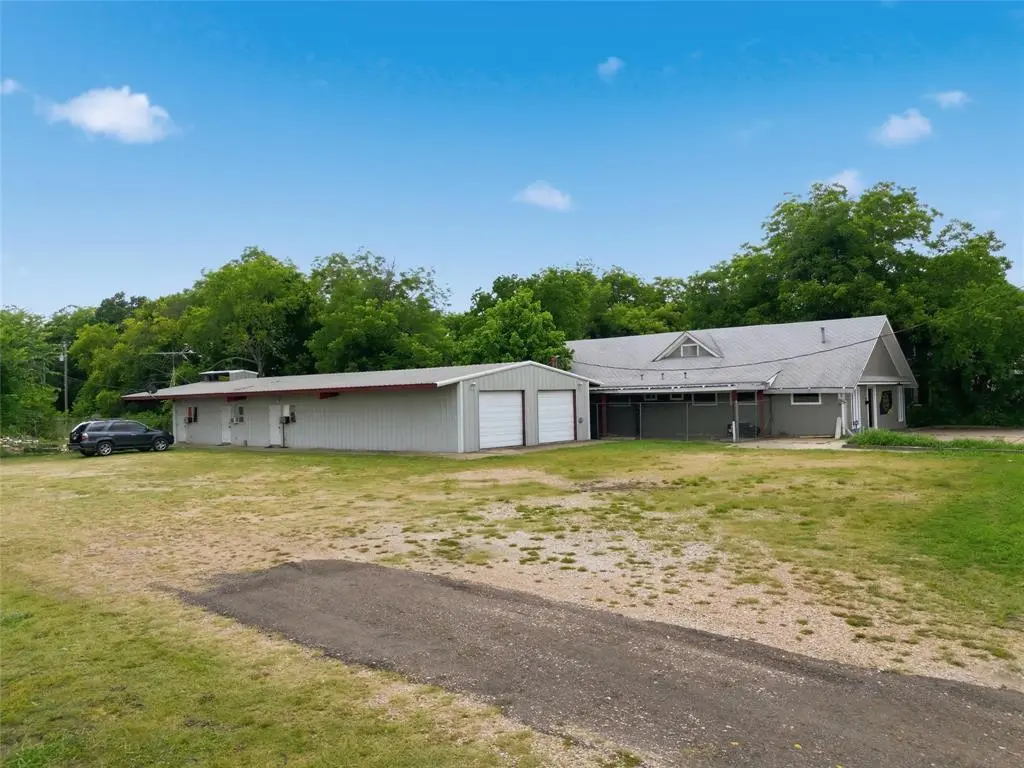
408 Live Oak St St · Marlin, TX
Flood risk No data
- FEMA flood zone
- —
- Chance of flooding over 30 yrs
- —
- Est. flood insurance / yr
- —
Fire risk No data
- Est. fire insurance / yr
- —
Heat risk No data
- Hot days now (above threshold)
- —
- Hot days in 30 yrs
- —
Wind risk No data
- Chance of severe wind over 30 yrs
- —
Air-quality risk No data
- Unhealthy air days now
- —
- Unhealthy air days in 30 yrs
- —
Risk factors via First Street. Map © Google.
Why this score? — see what drove the B- grade
The composite is a weighted blend of 9 inputs, each scored 0–100. Each bar is that input's sub-score; the figure is the points it added to the 100-point composite (weight × sub-score).
- Cash flow +27.2/30.0
- DSCR +9.5/10.0
- ARV discount +7.5/15.0
- 1% rule +7.4/10.0
- Appreciation +7.1/10.0
- Livability +3.0/5.0
- Rent growth +2.5/5.0
- Condition / age +2.2/5.0
- Schools +1.7/10.0
$219,900
🖨 Deal sheet (PDF) 📄 Offer letter ✓ Due diligence
Multi-family units
County records classify this as Multi-Family (2-4 Unit). Listing-text estimate: 1 unit. estimate disagrees with records
Listing remarks
Don’t miss this income producing commercial property featuring three garage apartment units (approximately 420 SF each), currently leased and generating rental income. Situated on a generous 0.43-acre tract, this property offers significant upside with the ability to add two additional units and ample space for future development, including additional rental units or a commercial building. Whether you’re looking to expand your rental portfolio or capitalize on future development opportunities, this property delivers both immediate cash flow and long-term growth potential. Even better, it can be purchased individually, packaged with five additional investment properties, or combi
Key facts
- Commercial building
- 0.46 acre lot
- 5 parking spots
Tags
Property features AI
Finance
- Other: Property marketed as residential income with 3 total units in 1 building; Multi-parcel property
- Financial info: Listed for cash or conventional financing; Capitalization rate not provided; Gross annual income/expenses and net operating income reported as zero
- HOA & community: No association
Exterior
- Parking: 5 parking spaces; On-site open unpaved parking; No garage
- Utilities: City water; City sewer; No municipal utility district
- Home design: Residential income property; Multi-family; One-level
- Construction: Metal roof; Aluminum siding; Metal siding; Slab foundation; Building area approximately 2800; Year built listed as preowned
- Exterior features: Lot less than 0.5 acre; Subdivision: Oakes; Directions: From Hwy 6, exit toward Live Oak St; continue on Live Oak about 1/2 mile — 408 Live Oak on right
Interior
- Flooring: Carpet; Ceramic tile
- Heating & cooling: Central heating; Electric heating; Central air conditioning; Electric cooling; Window unit(s)
- Interior features: Open floorplan; Other interior features
Neighborhood map
What this means for you Summary
Snapshot
- This is a multifamily listed at $220k. Condition is rated fair.
Deal economics
- At list price, monthly cash flow is $629 ($8k/yr) — positive.
- The deal already cash-flows at list — no discount required.
- Meets the 1% rule at list price ($3k rent vs $220k).
- Cap rate 9.7% vs local median 5.7% in Marlin — top-decile yield for the area; either an underpriced asset or a hidden risk that comps aren't pricing in. Stress-test before assuming the spread holds.
Location & tenants
- Location reads 59/100 on livability (#1,146 in TX) — a working-class tenant base; expect higher turnover. Strengths: cost of living A+, crime B+, housing B+; Watch: amenities F, commute F, employment F.
- Marlin ISD (town): math 21% / reading 22% proficiency, ranked #779 of 826 in TX (top 94%) — low school quality limits family demand, transient renter base, plan for 1-2y turnover; 84% free/reduced lunch — lower-income household profile, screen leases tightly.
- Zoned schools: Marlin El (math 22% / reading 27%, grade F, #3,052 of 4,322 statewide, top 74%, 474 students, 99% FRL); Marlin Middle (math 22% / reading 27%, grade F, #1,279 of 1,662 statewide, top 78%, 201 students, 100% FRL); Marlin High (math 2% / reading 12%, grade F, #1,612 of 1,632 statewide, top 99%, 243 students, 99% FRL) — zoned schools average 99% FRL vs 84% district-wide (16 pts higher); higher-poverty schools than district average — tighter screening recommended.
- Market conditions: 121 active listings in the ZIP; 4 units permitted in Falls County in 2024 (0 in 5+ unit buildings).
Forward outlook
- In year one you build about $11k of equity ($2k loan paydown + $9k appreciation (4.2% local appreciation)).
- Falls County population projected at -14% by 2050 — secular population decline; favor cash flow + early exit over multi-decade hold.
- At projected returns (4.2% appreciation + 3.0% rent growth), your $62k cash investment doubles in ~4 years — after that, you're playing with house money.
- By year 4, paydown + projected appreciation supports a ~$36k cash-out refi (75% LTV) — recoverable capital for the next deal without selling this one.
Negotiation context
- Only 13 days on market — expect competitive offers; lowballing is unlikely to land.
Questions for the listing agent
- Have any recent inspections been done? Can we get a copy of the seller's disclosures and any deferred-maintenance estimates?
- Is there a deadline driving the sale (1031 exchange, divorce, estate, relocation)? That informs how much negotiation room exists.
- Schools are F-rated, which usually means shorter tenancies and higher turnover. Who's the typical renter profile here, and what's been the actual vacancy rate?
- What's the average days-on-market for RENTAL listings here right now (not sales)? A rising rental-DOM trend means longer vacancies and softer asking-rent achievability than the comps imply.
- What's the recent tenant-quality profile in this submarket — average credit score on applications, eviction rate, late-payment / NSF rate, and stable-employment percentage? A property-management company in the area should have these aggregated.
- How much new apartment / multifamily construction is in the pipeline within 1–3 miles? Heavy new supply (>2% of stock underway) typically softens rents 12–24 months out; light construction supports rent growth.
Investment metrics
- 1% rule
- 1.24% ✓
- Cap rate
- 9.73%
- Cash-on-cash
- 12.26%
- DSCR
- 1.55
- GRM
- 6.7
CMA / ARV
No comps found within radius.
Projected returns pro-forma
4.17% appreciation · 3.0% rent growth · sell at horizon
- IRR
- 21.6%
- Equity multiple
- 2.31×
- Total profit
- $80,525
- Equity at exit
- $113,691
- IRR
- 21.8%
- Equity multiple
- 4.48×
- Total profit
- $214,250
- Equity at exit
- $187,726
Cash invested: $61,572 (down + closing). Projections, not guarantees.
Landlord ↔ Tenant lean methodology
- Overall (STATE)
- 87 Strongly Landlord-Friendly
- State Texas
- 87 Strongly Landlord-Friendly · R+5
- County
- — inherits STATE
- City
- — inherits STATE
ZIP-level market 76661
- Home prices YoY
- 3.4%
- Active inventory
- 121
- Price-to-rent
- 20.2×
Monthly cashflow live
- Estimated rent
- $2,720 medium interval (Pro) →
- Mortgage (P&I)
- −$1,153
- Tax est. 1.5%
- −$275 /mo · $3,298/yr
- Insurance
- −$92
- HOA
- −$0
- Vacancy / Maint / Mgmt
- −$571
- Net cashflow
- $629
Break-even live
Sensitivity live
| Price | -10% $781 | -5% $705 | +0% $629 | +5% $553 | +10% $477 |
|---|---|---|---|---|---|
| Rent | -10% $414 | -5% $522 | +0% $629 | +5% $737 | +10% $844 |
| Rate | -1.0pp $740 | -0.5pp $685 | base $629 | +0.5pp $572 | +1.0pp $514 |
3-unit breakdown (identical units grouped — click to expand)
| Units | Beds | Baths | Est. rent |
|---|---|---|---|
| 3× units | 2 | 1.5 | $2,721 |
| #1 | 2 | 1.5 | $907 |
| #2 | 2 | 1.5 | $907 |
| #3 | 2 | 1.5 | $907 |
| Total (3 units) | $2,720 | ||
UW: 25.0% down · 7.5% · 30yr · 1.5% tax · 5.0% vac · 8.0% maint · 8.0% mgmt
Financing live
Cash to close
- Down payment
- $54,975
- Closing costs
- $6,597
- Reserves months
- —
- Total cash needed
- —
Loan-product check · same deal, 3 products live
Conventional
25% down · 7.5% · 30yr
- Down + closing
- —
- Monthly P&I
- —
- Monthly cashflow
- —
- DSCR
- —
- Eligible?
- —
Personal DTI + credit; lowest rate.
DSCR
20% down · 8.5% · 30yr
- Down + closing
- —
- Monthly P&I
- —
- Monthly cashflow
- —
- DSCR
- —
- Eligible?
- —
No personal income docs; deal must DSCR.
Hard money
10% down · 12.0% · 12mo
- Down + closing
- —
- Monthly P&I
- —
- Monthly cashflow
- —
- DSCR
- —
- Eligible?
- —
Short-term bridge; refi at stabilization.
Listing history 11 events
-
2026-06-21days on market $219,900 Active 13 DOM
-
2026-06-18days on market $219,900 Active 10 DOM
-
2026-06-17days on market $219,900 Active 9 DOM
-
2026-06-16days on market $219,900 Active 8 DOM
-
2026-06-15price $219,900 Active 7 DOM
-
2026-06-15days on market $225,000 Active 7 DOM
-
2026-06-14days on market $225,000 Active 5 DOM
-
2026-06-13days on market $225,000 Active 4 DOM
-
2026-06-10days on market $225,000 Active 2 DOM
-
2026-06-09remarks 687-char remark
-
2026-06-09$225,000 Active 1 DOM
ⓘ Source: listings_history table (triggers on properties + properties_extension) + one-shot
backfill from property_details.listing_events for pre-trigger history.
Nearby sold comps map
Loading sold comps map…
Walkable amenities ~0.75 mi
Loading nearby amenities…
Taxation est. · year 1
- Rental income
- $32,640
- − Mortgage interest
- −$12,318
- − Property taxes
- −$3,298
- − Insurance
- −$1,100
- − Repairs & maintenance
- −$2,611
- − Management
- −$2,611
- − Depreciation
- −$6,397
- Taxable income
- $4,305
- Est. tax owed @ 24.0%
- −$1,033
- After-tax cash flow
- $6,516/yr
For passive investors: Depreciation is non-cash, so a rental often shows a tax loss while cash-flowing — sheltering income. Rental losses are passive: they offset passive income freely, and up to $25,000/yr can offset ordinary (W-2) income if you actively participate and your MAGI is under $100k (phasing out to $0 by $150k); unused losses carry forward. On sale, claimed depreciation is recaptured at up to 25%, and gains may owe capital-gains tax (a 1031 exchange can defer both). Figures are a year-1 estimate at your 24.0% rate — not tax advice; consult a CPA.
Condition & rehab AI · 12 photos
This multi-family property requires moderate rehabilitation to address structural and aesthetic issues, significantly impacting its value.
Repairs flagged
- Major roof — Signs of significant wear
- Major exterior siding — Weathered and rusted
- Major concrete foundation — Uneven and potentially unstable
Value-add opportunities
- Both repair and paint exterior — Enhances curb appeal and rental value
- Both repair foundation — Stabilizes structure and improves resale value
Renovation cost estimate screening
| Repair item | Severity | Est. cost |
|---|---|---|
| roof · Signs of significant wear | Major | $15,000–50,000 |
| exterior siding · Weathered and rusted | Major | $15,000–50,000 |
| concrete foundation · Uneven and potentially unstable | Major | $15,000–50,000 |
| Total estimated repair cost · 3 items | $45,000–150,000 |
Value-add ROI direction
- Both repair and paint exterior — Enhances curb appeal and rental value ↑
- Both repair foundation — Stabilizes structure and improves resale value ↑
ⓘ Cost ranges are severity-bucket heuristics (US national rule-of-thumb). Get contractor quotes + a written scope before underwriting a rehab budget.
Schools (NCES district)
- District
- Marlin ISD
- NCES district ID
- 4829130
- Math proficiency
- 21% ▲ 2.00%
- Reading proficiency
- 22% ▲ 6.00%
- Median HH income
- $29,255
- Composite
- 17.18/100
- National rank
- #9106
- State rank
- #779 of 826 in TX
Livability — Marlin
- Score
- 59/100
- State rank
- #1146
- US rank
- #20161
Category grades
Schools grade is shown separately in the Schools card above.
Census & demographics
- Census place
- Marlin, TX
- Population (ZIP)
- 7,266
Population outlook (Falls County) Hauer SSP2
- Today (2025)
- 15,782 people
- By 2030
- 15,209 · -3.6%
- By 2040
- 14,276 · -9.5%
- By 2050
- 13,645 · -13.5%
- By 2075
- 13,724 · -13.0%
- By 2100
- 13,005 · -17.6%
Race, ethnicity, and origin ACS 2023
- Neighborhood character
- Highly diverse neighborhood (Simpson 0.70)
- Race & ethnicity
- Black 35% Hispanic / Latino 30% White 30% Two or more races 13% Asian 3%
- Hispanic origin (detail)
- Mexican 29%
- Common ancestry
- Romanian 2% Lithuanian 1% Italian 1%
- Foreign-born
- 7% · Canada
- Languages at home
- 84% English-only · Spanish 15%
Political lean MEDSL · Falls
- 2024 margin
- Solid R (+44.7) · D 27.3% · R 72.0%
- 2008→2024 swing
- -25.0pp toward R · 2008: -19.7pp · 2024: -44.7pp
- All cycles
- 2024: R+44.7 2020: R+37.1 2016: R+33.6 2012: R+24.4 2008: R+19.7
Not yet ingested
- Civics
- —
Market trends
- HPI YoY
- ▲ 4.17%
- Current HPI
- 126.9217
- Rent YoY
- —
- Metro
- —
- State GDP YoY
- ▲ 3.95%
- F500 in state
- 110
Industry mix (Fortune 500 HQ in TX)
| Industry | F500 HQs | Revenue |
|---|---|---|
| Energy | 16 | $1,198B |
|
||
| Technology | 5 | $198B |
|
||
| Engineering / Construction | 4 | $72B |
|
||
| Energy Services | 3 | $60B |
|
||
| Utilities | 3 | $41B |
|
||
| Healthcare | 2 | $330B |
|
||
Price history
1 event — show timeline
- 2026-06-08 Listed $225,000 NTREIS
Cash-flow waterfall
monthlySold comps — $/sqft
last 12 mo · ≤1 miLoading sold comps…