1115 W Belknap · Jacksboro, TX
Flood risk 1/10 · Minimal
- FEMA flood zone
- X (unshaded)
- Chance of flooding over 30 yrs
- 0.0%
- Est. flood insurance / yr
- $507 – $1,088
Fire risk 8/10 · Major
- Est. fire insurance / yr
- $1,222 – $2,270
Heat risk 7/10 · Major
- Hot days now (above 108°F)
- 7 days/yr
- Hot days in 30 yrs
- 21 days/yr
Wind risk 4/10 · Minor
- Chance of severe wind over 30 yrs
- 14.0%
Air-quality risk 2/10 · Minimal
- Unhealthy air days now
- 0 days/yr
- Unhealthy air days in 30 yrs
- 1 days/yr
Risk factors via First Street. Map © Google.
Why this score? — see what drove the D grade
The composite is a weighted blend of 9 inputs, each scored 0–100. Each bar is that input's sub-score; the figure is the points it added to the 100-point composite (weight × sub-score).
- ARV discount +15.0/15.0
- Cash flow +7.6/30.0
- Appreciation +4.3/10.0
- Schools +3.6/10.0
- Livability +3.2/5.0
- Rent growth +2.5/5.0
- Condition / age +2.5/5.0
- DSCR +1.7/10.0
- 1% rule +1.1/10.0
$299,900
🖨 Deal sheet (PDF) 📄 Offer letter ✓ Due diligence
Listing remarks MLS
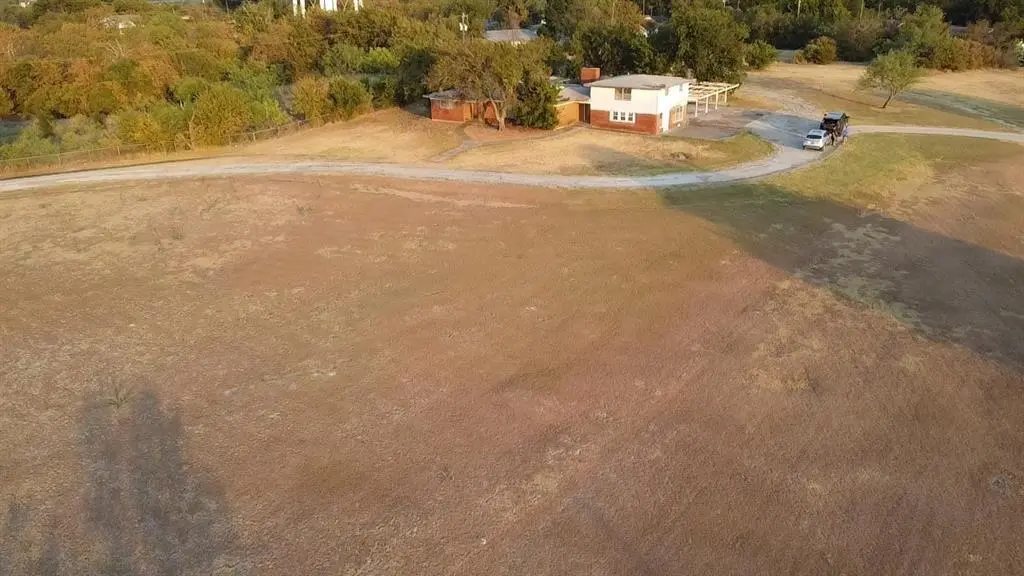
Are you looking for acreage in the city limits to build your dream home or an investment opportunity? This 4.45 acre tract is the perfect plot for country living in town. The house on site is most likely a total tear down which gives you the opportunity to make the place yours. City sewer, and water well. Survey is available. Buyer will be responsible for fencing lot. Deed restrictions to include no mobile homes.
Key facts
- Water well
- Deed restrictions
- Survey available
Tags
Neighborhood map
What this means for you Summary
Snapshot
- This is a 3-bed/2.0-bath single-family listed at $300k.
Deal economics
- At list price, monthly cash flow is $-363 ($-4k/yr) — negative.
- To cash-flow at today's rent, offer at most $236k (21.4% below list).
- To meet the 1% rule (rent ≥ 1% of price), the offer needs to be $182k (39.4% below list).
- Recommended offer: $182k (39.4% below list) — sets the bar for 1% rule.
- Cap rate 4.8% vs local median 3.8% in Jacksboro — meaningfully above typical; check what's discounted (condition, days-on-market, listing class) to confirm the premium yield is real.
Location & tenants
- Location reads 64/100 on livability (#753 in TX) — a middle-class / working-renter tenant base. Strengths: cost of living A+, housing A+, crime A; Watch: health & safety C-, amenities F, commute F.
- Jacksboro ISD (town): math 42% / reading 42% proficiency, ranked #337 of 826 in TX (top 41%) — families likely to look elsewhere, expect single-tenant / working-renter base with shorter leases.
- Zoned schools: Jacksboro El (math 39% / reading 36%, grade F, #1,744 of 4,322 statewide, top 41%, 497 students, 68% FRL); Jacksboro Middle (math 44% / reading 40%, grade D-, #572 of 1,662 statewide, top 36%, 251 students, 68% FRL); Jacksboro H S (math 47% / reading 57%, grade D+, #447 of 1,632 statewide, top 29%, 335 students, 68% FRL) — zoned schools average 68% FRL vs 44% district-wide (24 pts higher); higher-poverty schools than district average — tighter screening recommended.
- Market conditions: 125 active listings in the ZIP; 10 units permitted in Jack County in 2024 (0 in 5+ unit buildings).
Forward outlook
- Local home prices are declining (-1.3%/yr); year-one equity from $2k of loan paydown is wiped out by about $4k of value loss. Plan a longer hold.
Negotiation context
- It's been on market 215 days — a 12% lower offer ($264k) is reasonable based on typical stale-listing flexibility.
- 3 sale attempts since 2y ago; this cycle's ask has dropped $100k (25%) from the opening price — seller is motivated, your offer sets the floor, not the list.
Risks & watch-outs
- Watch-outs: built in 1950 — expect roof / HVAC / electrical / plumbing capex.
- Climate carrying-cost: severe wildfire risk; extreme-heat days projected 7→21/yr by 2055 (HVAC capex compounding) — expect insurance premiums to compound above CPI over the hold.
Questions for the listing agent
- What do current leases actually rent for vs. the listed asking? Can we see a recent rent roll and the last 12 months of T-12 income?
- It's been on market 215 days. Have you received any prior offers? Is the seller open to a 39% concession, seller financing, or rate buy-down credit?
- Built in 1950 — when were the roof, HVAC, electrical panel, plumbing, and water heater last replaced?
- Why hasn't it sold? Are there any deal-killer items the seller is aware of (foundation, flood, title, zoning, code violations)?
- Is there a deadline driving the sale (1031 exchange, divorce, estate, relocation)? That informs how much negotiation room exists.
- Schools are F-rated, which usually means shorter tenancies and higher turnover. Who's the typical renter profile here, and what's been the actual vacancy rate?
- The area grade is low — what's the realistic commute time and amenity access for the typical tenant pool here? Any planned neighborhood developments (good or bad) we should know about?
- What's the average days-on-market for RENTAL listings here right now (not sales)? A rising rental-DOM trend means longer vacancies and softer asking-rent achievability than the comps imply.
- What's the recent tenant-quality profile in this submarket — average credit score on applications, eviction rate, late-payment / NSF rate, and stable-employment percentage? A property-management company in the area should have these aggregated.
- How much new for-sale + rental construction is in the pipeline within 1–3 miles? Heavy new supply typically softens prices + rents 12–24 months out; constrained supply supports both.
Investment metrics
- 1% rule
- 0.61% ✗
- Cap rate
- 4.84%
- Cash-on-cash
- -5.18%
- DSCR
- 0.77
- GRM
- 13.8
CMA / ARV
- ARV (median comp)
- $375,000
- List price
- $299,900
- Delta
- -20.03%
- Verdict
- UNDERPRICED
- Comps
- 11 within 1.0 mi
Projected returns pro-forma
-1.32% appreciation · 3.0% rent growth · sell at horizon
- IRR
- -14.4%
- Equity multiple
- 0.40×
- Total profit
- $-50,199
- Equity at exit
- $67,741
- IRR
- -7.5%
- Equity multiple
- 0.36×
- Total profit
- $-54,050
- Equity at exit
- $67,243
Cash invested: $83,972 (down + closing). Projections, not guarantees.
Landlord ↔ Tenant lean methodology
- Overall (STATE)
- 87 Strongly Landlord-Friendly
- State Texas
- 87 Strongly Landlord-Friendly · R+5
- County
- — inherits STATE
- City
- — inherits STATE
ZIP-level market 76458
- Home prices YoY
- -0.7%
- Active inventory
- 125
- Price-to-rent
- 13.8×
Monthly cashflow live
- Estimated rent
- $1,817 medium interval (Pro) →
- Mortgage (P&I)
- −$1,573
- Tax from tax record
- −$101 /mo · $1,209/yr
- Insurance
- −$125
- HOA
- −$0
- Vacancy / Maint / Mgmt
- −$382
- Net cashflow
- $-363
Break-even live
Sensitivity live
| Price | -10% $-193 | -5% $-278 | +0% $-363 | +5% $-448 | +10% $-533 |
|---|---|---|---|---|---|
| Rent | -10% $-506 | -5% $-435 | +0% $-363 | +5% $-291 | +10% $-219 |
| Rate | -1.0pp $-212 | -0.5pp $-287 | base $-363 | +0.5pp $-440 | +1.0pp $-520 |
UW: 25.0% down · 7.5% · 30yr · 1.5% tax · 5.0% vac · 8.0% maint · 8.0% mgmt
Financing live
Cash to close
- Down payment
- $74,975
- Closing costs
- $8,997
- Reserves months
- —
- Total cash needed
- —
Loan-product check · same deal, 3 products live
Conventional
25% down · 7.5% · 30yr
- Down + closing
- —
- Monthly P&I
- —
- Monthly cashflow
- —
- DSCR
- —
- Eligible?
- —
Personal DTI + credit; lowest rate.
DSCR
20% down · 8.5% · 30yr
- Down + closing
- —
- Monthly P&I
- —
- Monthly cashflow
- —
- DSCR
- —
- Eligible?
- —
No personal income docs; deal must DSCR.
Hard money
10% down · 12.0% · 12mo
- Down + closing
- —
- Monthly P&I
- —
- Monthly cashflow
- —
- DSCR
- —
- Eligible?
- —
Short-term bridge; refi at stabilization.
Listing history 24 events
-
2026-06-21days on market $299,900 Active 215 DOM
-
2026-06-18days on market $299,900 Active 212 DOM
-
2026-06-17days on market $299,900 Active 211 DOM
-
2026-06-16days on market $299,900 Active 210 DOM
-
2026-06-15days on market $299,900 Active 209 DOM
-
2026-06-13days on market $299,900 Active 207 DOM
-
2026-06-13days on market $299,900 Active 206 DOM
-
2026-06-09days on market $299,900 Active 203 DOM
-
2026-06-08days on market $299,900 Active 202 DOM
-
2026-06-07days on market $299,900 Active 201 DOM
-
2026-06-04days on market $299,900 Active 198 DOM
-
2026-06-03days on market $299,900 Active 197 DOM
-
2026-06-02days on market $299,900 Active 196 DOM
-
2026-06-01days on market $299,900 Active 195 DOM
-
2026-05-31days on market $299,900 Active 194 DOM
-
2026-01-17price $299,900 419-char remark
Show marketing remark (419 chars)
Are you looking for acreage in the city limits to build your dream home or an investment opportunity? This 4.45 acre tract is the perfect plot for country living in town. The house on site is most likely a total tear down which gives you the opportunity to make the place yours. City sewer, and water well. Survey is available. Buyer will be responsible for fencing lot. Deed restrictions to include no mobile homes.
-
2025-11-18$399,900 Active 419-char remark
Show marketing remark (419 chars)
Are you looking for acreage in the city limits to build your dream home or an investment opportunity? This 4.45 acre tract is the perfect plot for country living in town. The house on site is most likely a total tear down which gives you the opportunity to make the place yours. City sewer, and water well. Survey is available. Buyer will be responsible for fencing lot. Deed restrictions to include no mobile homes.
-
2025-07-25historical
-
2025-05-23price $399,900
-
2025-05-07status Active
-
2025-01-18historical
-
2024-10-17price $415,000
-
2024-07-18$435,000 Active
-
2006-04-24soldstatus
ⓘ Source: listings_history table (triggers on properties + properties_extension) + one-shot
backfill from property_details.listing_events for pre-trigger history.
Tax reassessment forecast TX · Resets to sale price
- Current annual tax
- $1,209 · $101/mo
- Projected year-2 tax
- $5,488 · $457/mo
- Expected delta
- +$4,279/yr (+$357/mo · 353.9%)
ⓘ Screening estimate from a state-policy table — verify with the county assessor before closing.
Climate risk First Street
- Flood 1/10 Low FEMA zone X (unshaded) · 0% chance over 30 yrs
- Wildfire 8/10 Severe
- Heat 7/10 Severe 7 d/yr ≥108°F today · 21 d/yr by 30 yrs out
- Wind 4/10 Moderate 14% chance of damaging wind over 30 yrs
- Air quality 2/10 Low 0 unhealthy d/yr today · 1 by 30 yrs out
Nearby sold comps map
Loading sold comps map…
Walkable amenities ~0.75 mi
Loading nearby amenities…
Taxation est. · year 1
- Rental income
- $21,807
- − Mortgage interest
- −$16,799
- − Property taxes
- −$1,209
- − Insurance
- −$1,500
- − Repairs & maintenance
- −$1,745
- − Management
- −$1,745
- − Depreciation
- −$8,724
- Taxable loss
- −$9,914
- Est. tax savings @ 24.0%
- +$2,379
- After-tax cash flow
- $-1,974/yr
For passive investors: Depreciation is non-cash, so a rental often shows a tax loss while cash-flowing — sheltering income. Rental losses are passive: they offset passive income freely, and up to $25,000/yr can offset ordinary (W-2) income if you actively participate and your MAGI is under $100k (phasing out to $0 by $150k); unused losses carry forward. On sale, claimed depreciation is recaptured at up to 25%, and gains may owe capital-gains tax (a 1031 exchange can defer both). Figures are a year-1 estimate at your 24.0% rate — not tax advice; consult a CPA.
Schools (NCES district)
- District
- Jacksboro ISD
- NCES district ID
- 4824530
- Math proficiency
- 42% ▼ -3.00%
- Reading proficiency
- 42% ▬ 0.00%
- Median HH income
- $47,739
- Composite
- 35.94/100
- National rank
- #4802
- State rank
- #337 of 826 in TX
Livability — Jacksboro
- Score
- 64/100
- State rank
- #753
- US rank
- #13881
Category grades
Schools grade is shown separately in the Schools card above.
Census & demographics
- Census place
- Jacksboro, TX
- Population (ZIP)
- 6,103
Population outlook (Jack County) Hauer SSP2
- Today (2025)
- 8,560 people
- By 2030
- 8,423 · -1.6%
- By 2040
- 8,433 · -1.5%
- By 2050
- 8,605 · +0.5%
- By 2075
- 9,047 · +5.7%
- By 2100
- 8,844 · +3.3%
Race, ethnicity, and origin ACS 2023
- Neighborhood character
- Predominantly White (70%)
- Race & ethnicity
- White 70% Hispanic / Latino 23% Two or more races 7% Black 5%
- Hispanic origin (detail)
- Mexican 20%
- Common ancestry
- Italian 2% Lithuanian 2% Slovak 1%
- Foreign-born
- 6% · Canada
- Languages at home
- 83% English-only · Spanish 16%
Political lean MEDSL · Jack
- 2024 margin
- Solid R (+82.3) · D 8.6% · R 90.9%
- 2008→2024 swing
- -14.2pp toward R · 2008: -68.1pp · 2024: -82.3pp
- All cycles
- 2024: R+82.3 2020: R+81.6 2016: R+79.6 2012: R+78.3 2008: R+68.1
Not yet ingested
- Civics
- —
Market trends
- HPI YoY
- ▼ -1.32%
- Current HPI
- 202.1533
- Rent YoY
- —
- Metro
- —
- State GDP YoY
- ▲ 3.95%
- F500 in state
- 110
Industry mix (Fortune 500 HQ in TX)
| Industry | F500 HQs | Revenue |
|---|---|---|
| Energy | 16 | $1,198B |
|
||
| Technology | 5 | $198B |
|
||
| Engineering / Construction | 4 | $72B |
|
||
| Energy Services | 3 | $60B |
|
||
| Utilities | 3 | $41B |
|
||
| Healthcare | 2 | $330B |
|
||
Price history
-31.1% since first listed9 events — show timeline
- 2026-01-17 Price Changed $299,900 NTREIS
- 2025-11-18 Listed $399,900 NTREIS
- 2025-07-25 Listing Removed — NTREIS
- 2025-05-23 Price Changed $399,900 NTREIS
- 2025-05-07 Relisted — NTREIS
- 2025-01-18 Listing Removed — NTREIS
- 2024-10-17 Price Changed $415,000 NTREIS
- 2024-07-18 Listed $435,000 NTREIS
- 2006-04-24 Sold (Public Records) — Public Records
Property tax history
-2.7%/yrLatest (2025): $1,209 · +6.2% YoY. Source: county tax records.
Cash-flow waterfall
monthlySold comps — $/sqft
last 12 mo · ≤1 miLoading sold comps…