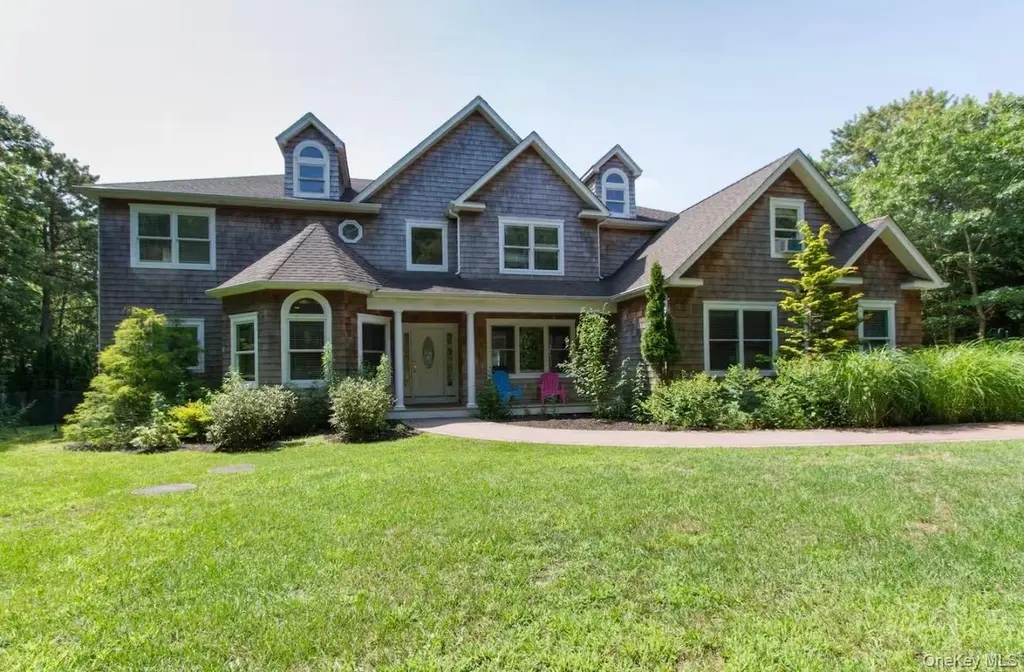
155 Chardonnay Dr · East Quogue, NY
Flood risk 1/10 · Minimal
- FEMA flood zone
- X (unshaded)
- Chance of flooding over 30 yrs
- 0.0%
- Est. flood insurance / yr
- $473 – $860
Fire risk 3/10 · Minor
- Est. fire insurance / yr
- $691 – $1,283
Heat risk 4/10 · Minor
- Hot days now (above 90°F)
- 7 days/yr
- Hot days in 30 yrs
- 20 days/yr
Wind risk 8/10 · Major
- Chance of severe wind over 30 yrs
- 80.0%
Air-quality risk 3/10 · Minor
- Unhealthy air days now
- 2 days/yr
- Unhealthy air days in 30 yrs
- 3 days/yr
Risk factors via First Street. Map © Google.
Why this score? — see what drove the B+ grade
The composite is a weighted blend of 9 inputs, each scored 0–100. Each bar is that input's sub-score; the figure is the points it added to the 100-point composite (weight × sub-score).
- Cash flow +30.0/30.0
- ARV discount +15.0/15.0
- DSCR +10.0/10.0
- 1% rule +8.2/10.0
- Schools +5.0/10.0
- Livability +3.1/5.0
- Rent growth +2.5/5.0
- Condition / age +2.5/5.0
- Appreciation +0.0/10.0
$1,900,000
🖨 Deal sheet 📄 Offer letter ✓ Due diligence
Listing remarks
HANDYMAN SPECIAL!! Southampton Pines Subdivision Large Hamptons-style post-modern single family home. Designed for luxury suburban living with resort-style features. Approximately 4000 square feet with multiple ensuite bedrooms {6 bedrooms and 7 bathrooms}, The home has an open-concept living and dining areas with a fireplace and high ceilings, Outside features Gunite in ground pool, attached 3 car garages with a large private yard on . 96 of an acre lot
Key facts
- Large private yard
- 1 acre lot
- 3 garage spots
Tags
Property features AI
Finance
- HOA & community: Has association with annual fee; Association fee covers common area maintenance; Community playground
Exterior
- Parking: Attached garage; 3 total parking spaces; 3-car garage
- Utilities: Electricity available; PSEG electric service; Septic (above ground)
- Home design: Single-family residence; Two levels; Non-waterfront; Property marked as fixer
- Construction: Frame construction; Concrete perimeter foundation
- Exterior features: Tennis court(s); Private, secluded and cleared lot
Interior
- Kitchen: Refrigerator included; Eat-in kitchen with breakfast bar
- Bedrooms: Two levels (multi-level bedroom layout possible)
- Bathrooms: 5 full bathrooms; 2 half bathrooms
- Heating & cooling: Forced air heating; Zoned cooling
- Interior features: First-floor full bathroom; Breakfast bar; Cathedral ceilings; Eat-in kitchen; Loft; Full basement
- Laundry & utility: Laundry located in basement
Neighborhood map
What this means for you Summary
Snapshot
- This is a 6-bed/6.0-bath single-family listed at $1.90M.
Deal economics
- At list price, monthly cash flow is $7k ($86k/yr) — positive.
- The deal already cash-flows at list — no discount required.
- Meets the 1% rule at list price ($25k rent vs $1.90M).
- Recommended offer: $1.84M (3.0% below list) — sets the bar for market timing.
Location & tenants
- Location reads 61/100 on livability (#943 in NY) — a middle-class / working-renter tenant base. Strengths: crime A+, employment A+; Watch: amenities F, commute F, cost of living F.
- East Quogue Union Free School District (suburban): math 55% / reading 50% proficiency, ranked #342 of 755 in NY (top 45%) — acceptable for families but not a draw, mixed tenant base, ~2y average lease; only 15% free/reduced lunch — higher-income household profile.
- Zoned schools: East Quogue School (math 57% / reading 62%, grade B-, #745 of 2,108 statewide, top 39%, 355 students, 31% FRL) — zoned schools average 31% FRL vs 15% district-wide (16 pts higher); higher-poverty schools than district average — tighter screening recommended.
- Market conditions: 75 active listings in the ZIP; 1 comparable units currently listed for rent nearby; 1,366 units permitted in Suffolk County in 2024 (216 in 5+ unit buildings).
Forward outlook
- Local home prices are declining (-3.0%/yr); year-one equity from $13k of loan paydown is wiped out by about $57k of value loss. Plan a longer hold.
- Suffolk County population projected to shrink 5% by 2050 — rents likely to lag national; underwrite the cash flow, not the appreciation.
- At projected returns (-3.0% appreciation + 3.0% rent growth), your $532k cash investment doubles in ~8 years — after that, you're playing with house money.
Negotiation context
- It's been on market 37 days — a 3% lower offer ($1.84M) is reasonable based on typical stale-listing flexibility.
- 2 sale attempts since 13y ago with the ask held roughly flat each time — persistent listings suggest the price (not the market) is what's stuck; bring a comps-based counter.
Risks & watch-outs
- Climate carrying-cost: severe wind risk, 80% chance of damaging wind over 30y — expect insurance premiums to compound above CPI over the hold.
Questions for the listing agent
- It's been on market 37 days. Have you received any prior offers? Is the seller open to a 3% concession, seller financing, or rate buy-down credit?
- Is there a deadline driving the sale (1031 exchange, divorce, estate, relocation)? That informs how much negotiation room exists.
- Schools are B-rated — typically a magnet for longer-tenancy family renters. What's the average tenant stay here, and is there a school-zone premium baked into asking?
- What's the average days-on-market for RENTAL listings here right now (not sales)? A rising rental-DOM trend means longer vacancies and softer asking-rent achievability than the comps imply.
- What's the recent tenant-quality profile in this submarket — average credit score on applications, eviction rate, late-payment / NSF rate, and stable-employment percentage? A property-management company in the area should have these aggregated.
- How much new for-sale + rental construction is in the pipeline within 1–3 miles? Heavy new supply typically softens prices + rents 12–24 months out; constrained supply supports both.
Investment metrics
- 1% rule
- 1.32% ✓
- Cap rate
- 10.80%
- Cash-on-cash
- 16.09%
- DSCR
- 1.72
- GRM
- 6.3
CMA / ARV
- ARV (median comp)
- $2,473,481
- List price
- $1,900,000
- Delta
- -23.19%
- Verdict
- UNDERPRICED
- Comps
- 9 within 1.0 mi
Projected returns pro-forma
-3.0% appreciation · 3.0% rent growth · sell at horizon
- IRR
- 7.0%
- Equity multiple
- 1.28×
- Total profit
- $146,401
- Equity at exit
- $283,296
- IRR
- 16.4%
- Equity multiple
- 2.34×
- Total profit
- $712,619
- Equity at exit
- $164,277
Cash invested: $532,000 (down + closing). Projections, not guarantees.
Landlord ↔ Tenant lean methodology
- Overall (STATE)
- 15 Strongly Tenant-Friendly
- State New York
- 15 Strongly Tenant-Friendly · D+10
- County
- — inherits STATE
- City
- — inherits STATE
ZIP-level market 11942
- Home prices YoY
- -25.0%
- Active inventory
- 75
- Price-to-rent
- 6.3×
Monthly cashflow live
- Estimated rent
- $25,000 medium interval (Pro) →
- Mortgage (P&I)
- −$9,964
- Tax from tax record
- −$1,863 /mo · $22,354/yr
- Insurance
- −$792
- HOA
- −$0
- Vacancy / Maint / Mgmt
- −$5,250
- Net cashflow
- $7,132
Break-even live
UW: 25.0% down · 7.5% · 30yr · 1.5% tax · 5.0% vac · 8.0% maint · 8.0% mgmt
Financing live
Cash to close
- Down payment
- $475,000
- Closing costs
- $57,000
- Reserves months
- —
- Total cash needed
- —
Loan-product check · same deal, 3 products live
Conventional
25% down · 7.5% · 30yr
- Down + closing
- —
- Monthly P&I
- —
- Monthly cashflow
- —
- DSCR
- —
- Eligible?
- —
Personal DTI + credit; lowest rate.
DSCR
20% down · 8.5% · 30yr
- Down + closing
- —
- Monthly P&I
- —
- Monthly cashflow
- —
- DSCR
- —
- Eligible?
- —
No personal income docs; deal must DSCR.
Hard money
10% down · 12.0% · 12mo
- Down + closing
- —
- Monthly P&I
- —
- Monthly cashflow
- —
- DSCR
- —
- Eligible?
- —
Short-term bridge; refi at stabilization.
Rent comps 1 comps
| Address | Beds | Baths | Sqft | Rent | $/sqft | DOM | Units | Dist |
|---|---|---|---|---|---|---|---|---|
| 151 Chardonnay Dr East Quogue, NY | 5.0 | 4.5 | 4136 | $25,000 | $6.04 | 2d | 1 | 0.07mi |
Listing history 21 events
-
2026-06-18days on market $1,900,000 Active 37 DOM
-
2026-06-17days on market $1,900,000 Active 36 DOM
-
2026-06-16days on market $1,900,000 Active 35 DOM
-
2026-06-15days on market $1,900,000 Active 34 DOM
-
2026-06-13days on market $1,900,000 Active 32 DOM
-
2026-06-13days on market $1,900,000 Active 31 DOM
-
2026-06-09days on market $1,900,000 Active 28 DOM
-
2026-06-08days on market $1,900,000 Active 27 DOM
-
2026-06-07days on market $1,900,000 Active 26 DOM
-
2026-06-04days on market $1,900,000 Active 23 DOM
-
2026-06-03days on market $1,900,000 Active 22 DOM
-
2026-06-02days on market $1,900,000 Active 21 DOM
-
2026-06-01days on market $1,900,000 Active 20 DOM
-
2026-05-31days on market $1,900,000 Active 19 DOM
-
2026-05-12$1,900,000 Active 459-char remark
-
2014-02-10historical
-
2013-05-22$1,090,000
-
2007-05-02soldstatus $2,500,000
-
2004-11-15soldstatus $435,000
-
2000-10-03soldstatus $155,000
-
2000-09-25soldstatus $125,000
ⓘ Source: listings_history table (triggers on properties + properties_extension) + one-shot
backfill from property_details.listing_events for pre-trigger history.
Tax reassessment forecast NY · Partial reset (capped growth)
- Current annual tax
- $22,354 · $1,863/mo
- Projected year-2 tax
- $27,232 · $2,269/mo
- Expected delta
- +$4,878/yr (+$406/mo · 21.8%)
ⓘ Screening estimate from a state-policy table — verify with the county assessor before closing.
Climate risk First Street
- Flood 1/10 Low FEMA zone X (unshaded) · 0% chance over 30 yrs
- Wildfire 3/10 Moderate
- Heat 4/10 Moderate 7 d/yr ≥90°F today · 20 d/yr by 30 yrs out
- Wind 8/10 Severe 80% chance of damaging wind over 30 yrs
- Air quality 3/10 Moderate 2 unhealthy d/yr today · 3 by 30 yrs out
Nearby sold comps map
Loading sold comps map…
Walkable amenities ~0.75 mi
Loading nearby amenities…
Taxation est. · year 1
- Rental income
- $300,000
- − Mortgage interest
- −$106,430
- − Property taxes
- −$22,354
- − Insurance
- −$9,500
- − Repairs & maintenance
- −$24,000
- − Management
- −$24,000
- − Depreciation
- −$55,273
- Taxable income
- $58,444
- Est. tax owed @ 24.0%
- −$14,026
- After-tax cash flow
- $71,554/yr
For passive investors: Depreciation is non-cash, so a rental often shows a tax loss while cash-flowing — sheltering income. Rental losses are passive: they offset passive income freely, and up to $25,000/yr can offset ordinary (W-2) income if you actively participate and your MAGI is under $100k (phasing out to $0 by $150k); unused losses carry forward. On sale, claimed depreciation is recaptured at up to 25%, and gains may owe capital-gains tax (a 1031 exchange can defer both). Figures are a year-1 estimate at your 24.0% rate — not tax advice; consult a CPA.
Schools (NCES district)
- District
- East Quogue Union Free School District
- NCES district ID
- 3609900
- Math proficiency
- 55% ▬ 0.00%
- Reading proficiency
- 50% ▲ 5.00%
- Median HH income
- $81,457
- Composite
- 49.79/100
- National rank
- #4207
- State rank
- #342 of 755 in NY
Livability — East Quogue
- Score
- 61/100
- State rank
- #943
- US rank
- #18348
Category grades
Schools grade is shown separately in the Schools card above.
Census & demographics
- Census place
- East Quogue, NY
- City population
- 5,871
- Population (ZIP)
- 5,871
Population outlook (Suffolk County) Hauer SSP2
- Today (2025)
- 1,505,262 people
- By 2030
- 1,498,318 · -0.5%
- By 2040
- 1,471,101 · -2.3%
- By 2050
- 1,424,848 · -5.3%
- By 2075
- 1,337,157 · -11.2%
- By 2100
- 1,217,720 · -19.1%
Race, ethnicity, and origin ACS 2023
- Neighborhood character
- Predominantly White (80%)
- Race & ethnicity
- White 80% Hispanic / Latino 16% Asian 2% Two or more races 2%
- Hispanic origin (detail)
- Mexican 3%
- Common ancestry
- Romanian 6% Scotch-Irish 3% Lithuanian 3%
- Foreign-born
- 13% · Canada, Jamaica, Guatemala
- Languages at home
- 80% English-only · Spanish 12% Other Indo-European 2% Russian/Polish/Slavic 2%
Political lean MEDSL · Suffolk
- 2024 margin
- Lean R (+10.0) · D 45.0% · R 55.0%
- 2008→2024 swing
- -16.0pp toward R · 2008: 6.0pp · 2024: -10.0pp
- All cycles
- 2024: R+10.0 2020: R+0.0 2016: R+8.2 2012: D+2.9 2008: D+6.0
Not yet ingested
- Civics
- —
Market trends
- HPI YoY
- ▼ -145.33%
- Current HPI
- 435.8017
- Rent YoY
- —
- Metro
- —
- State GDP YoY
- ▲ 2.60%
- F500 in state
- 92
Industry mix (Fortune 500 HQ in NY)
| Industry | F500 HQs | Revenue |
|---|---|---|
| Financial Services | 10 | $950B |
|
||
| Consumer Goods | 9 | $162B |
|
||
| Insurance | 4 | $225B |
|
||
| Telecommunications | 2 | $144B |
|
||
| Pharmaceuticals | 2 | $112B |
|
||
| Media / Entertainment | 2 | $69B |
|
||
Price history
+1420.0% since first listed7 events — show timeline
- 2026-05-12 Listed $1,900,000 OneKey® MLS as Distributed by MLS Grid
- 2014-02-10 Listing Removed — OneKey® MLS as Distributed by MLS Grid
- 2013-05-22 Listed $1,090,000 OneKey® MLS as Distributed by MLS Grid
- 2007-05-02 Sold (Public Records) $2,500,000 Public Records
- 2004-11-15 Sold (Public Records) $435,000 Public Records
- 2000-10-03 Sold (Public Records) $155,000 Public Records
- 2000-09-25 Sold (Public Records) $125,000 Public Records
Property tax history
-0.2%/yrLatest (2024): $22,354 · +0.0% YoY. Source: county tax records.
Cash-flow waterfall
monthlySold comps — $/sqft
last 12 mo · ≤1 miLoading sold comps…