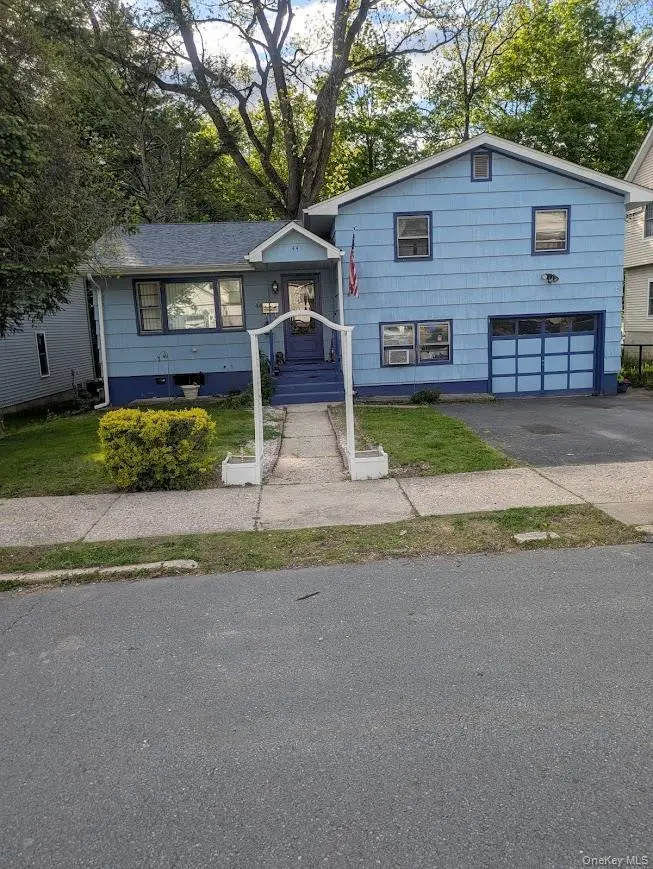
44 Commonwealth Ave · Middletown, NY
Flood risk 1/10 · Minimal
- FEMA flood zone
- X (unshaded)
- Chance of flooding over 30 yrs
- 0.0%
- Est. flood insurance / yr
- $473 – $860
Fire risk 2/10 · Minimal
- Est. fire insurance / yr
- $691 – $1,283
Heat risk 4/10 · Minor
- Hot days now (above 100°F)
- 7 days/yr
- Hot days in 30 yrs
- 15 days/yr
Wind risk 4/10 · Minor
- Chance of severe wind over 30 yrs
- 10.0%
Air-quality risk 2/10 · Minimal
- Unhealthy air days now
- 1 days/yr
- Unhealthy air days in 30 yrs
- 2 days/yr
Risk factors via First Street. Map © Google.
Why this score? — see what drove the D grade
The composite is a weighted blend of 9 inputs, each scored 0–100. Each bar is that input's sub-score; the figure is the points it added to the 100-point composite (weight × sub-score).
- ARV discount +14.5/15.0
- Cash flow +7.6/30.0
- Rent growth +4.6/5.0
- Schools +4.2/10.0
- Livability +4.1/5.0
- 1% rule +3.4/10.0
- Condition / age +2.5/5.0
- DSCR +1.7/10.0
- Appreciation +0.0/10.0
$298,900
🖨 Deal sheet (PDF) 📄 Offer letter ✓ Due diligence
Listing remarks MLS
EXCELLENT LOCATION!
Key facts
- New furnace
- New hot water heater
- Hardwood throughout
Tags
Property features AI
Exterior
- Parking: Driveway parking; Garage; Total parking for 3 vehicles; 1 garage space
- Utilities: Natural gas connected; Water connected; Sewer connected (public sewer); Phone connected; Electric service by Orange & Rockland
- Home design: Single family residence; Two stories; Fixer condition
- Construction: Frame construction
- Exterior features: Back yard; Front yard; City lot; Cleared; Level lot; Partially wooded; Near golf course; Near public transit; Near shops; Near schools; Paved; Private; Back yard fencing
Interior
- Kitchen: Oven; Range; Refrigerator
- Bedrooms: Two levels (rooms total: 6)
- Flooring: Ceramic tile; Wood
- Bathrooms: 1 full bathroom
- Heating & cooling: Ducted heating; No central cooling
- Interior features: Open kitchen; Full basement; Full attic
- Laundry & utility: Washer hookup; Laundry in basement
Neighborhood map
What this means for you Summary
Snapshot
- This is a 3-bed/1.0-bath single-family listed at $299k.
Deal economics
- At list price, monthly cash flow is $-356 ($-4k/yr) — negative.
- To cash-flow at today's rent, offer at most $236k (21.0% below list).
- To meet the 1% rule (rent ≥ 1% of price), the offer needs to be $250k (16.3% below list).
- Recommended offer: $236k (21.0% below list) — sets the bar for cash-flow.
- Cap rate 4.9% vs local median 3.3% in Middletown — top-decile yield for the area; either an underpriced asset or a hidden risk that comps aren't pricing in. Stress-test before assuming the spread holds.
Location & tenants
- Location reads 82/100 on livability (#79 in NY, #1,219 nationally) — a professional / high-income tenant draw. Strengths: amenities A+, housing A+, health & safety A+; Watch: commute C-.
- Middletown City School District (suburban): math 41% / reading 55% proficiency, ranked #411 of 590 in NY (top 70%) — families likely to look elsewhere, expect single-tenant / working-renter base with shorter leases; 61% free/reduced lunch — lower-income household profile, screen leases tightly.
- Zoned schools: Presidential Park Elementary School (math 19% / reading 37%, grade F, #1,774 of 2,108 statewide, top 84%, 1,300 students, 76% FRL); Monhagen Middle School (math 16% / reading 39%, grade F, #576 of 729 statewide, top 79%, 817 students, 75% FRL); Middletown High School (math 90% / reading 92%, grade A+, #203 of 1,100 statewide, top 20%, 2,523 students, 71% FRL).
- Market conditions: Rents rising fast (+8.2%/yr); 279 active listings in the ZIP; 29 comparable units currently listed for rent nearby; rentals lingering (median 46d on market — plan ~5-8 weeks vacancy on turnover, expect pricing pressure); 52% of comp listings sitting > 30 days — soft ceiling on asking rent; solid renter incomes; 1,746 units permitted in Orange County in 2024 (1,265 in 5+ unit buildings).
- This rent runs 34% of the median local income ($87k/yr) — at the standard rent-burdened threshold; future hikes will face affordability resistance.
Forward outlook
- Local home prices are declining (-3.0%/yr); year-one equity from $2k of loan paydown is wiped out by about $9k of value loss. Plan a longer hold.
Negotiation context
- It's been on market 39 days — a 3% lower offer ($290k) is reasonable based on typical stale-listing flexibility.
- 2 sale attempts since 28y ago with the ask held roughly flat each time — persistent listings suggest the price (not the market) is what's stuck; bring a comps-based counter.
- Current owner paid $107k; list at $299k implies a 179% gain — meaningful room to come down on a strong offer.
Risks & watch-outs
- Watch-outs: property tax is 2.6% of price.
Questions for the listing agent
- What do current leases actually rent for vs. the listed asking? Can we see a recent rent roll and the last 12 months of T-12 income?
- It's been on market 39 days. Have you received any prior offers? Is the seller open to a 21% concession, seller financing, or rate buy-down credit?
- Built in 1960 — when were the roof, HVAC, electrical panel, plumbing, and water heater last replaced?
- Property tax is high relative to price — has the assessment been appealed recently, and will the sale trigger a re-assessment?
- Is there a deadline driving the sale (1031 exchange, divorce, estate, relocation)? That informs how much negotiation room exists.
- Schools are D-rated, which usually means shorter tenancies and higher turnover. Who's the typical renter profile here, and what's been the actual vacancy rate?
- The area grade is low — what's the realistic commute time and amenity access for the typical tenant pool here? Any planned neighborhood developments (good or bad) we should know about?
- What's the average days-on-market for RENTAL listings here right now (not sales)? A rising rental-DOM trend means longer vacancies and softer asking-rent achievability than the comps imply.
- What's the recent tenant-quality profile in this submarket — average credit score on applications, eviction rate, late-payment / NSF rate, and stable-employment percentage? A property-management company in the area should have these aggregated.
- How much new for-sale + rental construction is in the pipeline within 1–3 miles? Heavy new supply typically softens prices + rents 12–24 months out; constrained supply supports both.
Investment metrics
- 1% rule
- 0.84% ✗
- Cap rate
- 4.87%
- Cash-on-cash
- -5.10%
- DSCR
- 0.77
- GRM
- 10.0
CMA / ARV
- ARV (median comp)
- $353,968
- List price
- $298,900
- Delta
- -15.56%
- Verdict
- UNDERPRICED
- Comps
- 20 within 1.0 mi
Show comp detail 12 sales within ~0.75 mi
| Address | Dist | Beds/Ba | Sqft | Sold | Price | $/sf | Match |
|---|---|---|---|---|---|---|---|
| 15 Commonwealth Ave | 0.14mi | 3/1.0 | 1,092 (-8%) | 5mo | $300,000 | $275 | 77 |
| 197 Highland Ave | 0.26mi | 3/1.5 | 1,131 (-4%) | 10mo | $268,000 | $237 | 71 |
| 12 Eisenhower Dr | 0.39mi | 3/1.0 | 1,150 (-2%) | 9mo | $375,000 | $326 | 70 |
| 143 N Beacon St | 0.36mi | 3/1.0 | 1,264 (+7%) | 2mo | $305,000 | $241 | 69 |
| 127 Watkins Ave | 0.42mi | 3/1.0 | 1,136 (-4%) | 7mo | $280,000 | $246 | 69 |
| 71 Commonwealth Ave | 0.14mi | 3/1.0 | 1,344 (+14%) | 2mo | $320,000 | $238 | 68 |
| 13 Smith St | 0.43mi | 3/1.0 | 1,120 (-5%) | 6mo | $230,000 | $205 | 66 |
| 98 Watkins Ave | 0.27mi | 3/1.0 | 1,300 (+10%) | 5mo | $345,000 | $265 | 66 |
| 20 Columbia Ave | 0.50mi | 3/1.0 | 1,232 (+4%) | 10mo | $290,000 | $235 | 61 |
| 3 Chappell Pkwy | 0.22mi | 2/1.0 (-1) | 1,016 (-14%) | 8mo | $330,000 | $325 | 55 |
| 299 Highland Ave Ext | 0.73mi | 3/1.0 | 1,284 (+9%) | 7mo | $255,000 | $199 | 46 |
| 80 Beattie Ave | 0.75mi | 3/1.0 | 1,032 (-12%) | 6mo | $200,000 | $194 | 39 |
Match score weights: distance 35% · size 25% · config 20% · recency 20%. Top-matched comps best support the ARV.
Projected returns pro-forma
-3.0% appreciation · 8.0% rent growth · sell at horizon
- IRR
- -18.7%
- Equity multiple
- 0.31×
- Total profit
- $-57,653
- Equity at exit
- $44,567
- IRR
- -2.6%
- Equity multiple
- 0.78×
- Total profit
- $-18,356
- Equity at exit
- $25,843
Cash invested: $83,692 (down + closing). Projections, not guarantees.
Landlord ↔ Tenant lean methodology
- Overall (STATE)
- 15 Strongly Tenant-Friendly
- State New York
- 15 Strongly Tenant-Friendly · D+10
- County
- — inherits STATE
- City
- — inherits STATE
ZIP-level market 10940
- Home prices YoY
- -18.7%
- Rents YoY
- 8.2%
- Active inventory
- 279
- Price-to-rent
- 10.0×
Monthly cashflow live
- Estimated rent
- $2,502 high interval (Pro) →
- Mortgage (P&I)
- −$1,567
- Tax from tax record
- −$640 /mo · $7,683/yr
- Insurance
- −$125
- HOA
- −$0
- Vacancy / Maint / Mgmt
- −$525
- Net cashflow
- $-356
Break-even live
Sensitivity live
| Price | -10% $-186 | -5% $-271 | +0% $-356 | +5% $-440 | +10% $-525 |
|---|---|---|---|---|---|
| Rent | -10% $-553 | -5% $-454 | +0% $-356 | +5% $-257 | +10% $-158 |
| Rate | -1.0pp $-205 | -0.5pp $-280 | base $-356 | +0.5pp $-433 | +1.0pp $-512 |
UW: 25.0% down · 7.5% · 30yr · 1.5% tax · 5.0% vac · 8.0% maint · 8.0% mgmt
Financing live
Cash to close
- Down payment
- $74,725
- Closing costs
- $8,967
- Reserves months
- —
- Total cash needed
- —
Loan-product check · same deal, 3 products live
Conventional
25% down · 7.5% · 30yr
- Down + closing
- —
- Monthly P&I
- —
- Monthly cashflow
- —
- DSCR
- —
- Eligible?
- —
Personal DTI + credit; lowest rate.
DSCR
20% down · 8.5% · 30yr
- Down + closing
- —
- Monthly P&I
- —
- Monthly cashflow
- —
- DSCR
- —
- Eligible?
- —
No personal income docs; deal must DSCR.
Hard money
10% down · 12.0% · 12mo
- Down + closing
- —
- Monthly P&I
- —
- Monthly cashflow
- —
- DSCR
- —
- Eligible?
- —
Short-term bridge; refi at stabilization.
Rent comps 29 comps
| Address | Beds | Baths | Sqft | Rent | $/sqft | DOM | Units | Dist |
|---|---|---|---|---|---|---|---|---|
| 184 Highland Ave Middletown, NY | 4.0 | 2.0 | 1486 | $3,500 | $2.36 | 25d | 1 | 0.22mi |
| 56 Wisner Ave Middletown, NY | 3.0 | 1.0 | 1144 | $2,500 | $2.19 | 25d | 1 | 0.34mi |
| 31 Liberty St Middletown, NY | 2.0 | 1.0 | 1090 | $2,000 | $1.83 | 15d | 1 | 0.51mi |
| 39 Crescent Pl Middletown, NY | 3.0 | 1.0 | 1278 | $2,500 | $1.96 | 25d | 1 | 0.57mi |
| 11 Knapp Ave Apt 2 Middletown, NY | 2.0 | 1.0 | 950 | $2,500 | $2.63 | 45d | 1 | 0.61mi |
| 90 Montgomery St Unit Upper Middletown, NY | 2.0 | 1.0 | 900 | $2,400 | $2.67 | 25d | 1 | 0.64mi |
| 118 W Main St Unit 1 Middletown, NY | 3.0 | 1.0 | 1158 | $2,350 | $2.03 | 23d | 1 | 0.67mi |
| 126 W Main St Middletown, NY | 3.0 | 1.0 | 900 | $2,200 | $2.44 | 23d | 1 | 0.68mi |
| 126 W Main St Unit 2 Middletown, NY | 3.0 | 1.0 | 700 | $2,200 | $3.14 | 45d | 1 | 0.68mi |
| 128 W Main St Unit 2 Middletown, NY | 3.0 | 2.0 | 880 | $2,500 | $2.84 | 45d | 1 | 0.68mi |
| 31 Beattie Ave #2 Middletown, NY | 2.0 | 1.0 | 718 | $2,000 | $2.79 | 45d | 1 | 0.75mi |
| 28 North St #1 Middletown, NY | 2.0 | 2.0 | 1200 | $2,000 | $1.67 | 45d | 1 | 0.77mi |
| 1 Dewitt St Middletown, NY | 3.0 | 1.0 | 1127 | $2,100 | $1.86 | 45d | 1 | 0.81mi |
| 22 Sunnyside Ave Middletown, NY | 2.0 | 1.0 | 928 | $1,800 | $1.94 | 45d | 1 | 0.82mi |
| 63 Broad St Middletown, NY | 3.0 | 1.0 | 1088 | $2,700 | $2.48 | 25d | 1 | 0.82mi |
| 2 E Main St #5 Middletown, NY | 3.0 | 1.0 | 1200 | $1,850 | $1.54 | 15d | 1 | 0.84mi |
| 26 Mill St Unit 2 Middletown, NY | 3.0 | 2.0 | 1300 | $2,600 | $2.00 | 45d | 1 | 0.84mi |
| 26 Mill St Middletown, NY | 3.0 | 2.0 | 1300 | $2,600 | $2.00 | 25d | 1 | 0.84mi |
| 17 Academy Ave Unit 2 Middletown, NY | 2.0 | 1.0 | 750 | $1,850 | $2.47 | 45d | 1 | 0.86mi |
| 225 Monhagen Ave Middletown, NY | 3.0 | 1.0 | 1466 | $2,700 | $1.84 | 15d | 1 | 0.94mi |
| 132 Prospect Ave Middletown, NY | 3.0 | 1.0 | 1240 | $2,300 | $1.85 | 45d | 1 | 0.96mi |
| 203 W Main St Unit 2 Middletown, NY | 2.0 | 1.0 | 784 | $1,700 | $2.17 | 45d | 1 | 0.96mi |
| 151 Tall Oaks Dr Middletown, NY | 1.0–3.0 | 1.0 | 920 | $1,607 | $1.75 | 15d | 1 | 1.04mi |
| 23 Wawayanda Ave Middletown, NY | 3.0 | 2.0 | 1072 | $2,150 | $2.01 | 45d | 1 | 1.04mi |
| 3 Giada Ln Unit 2 Middletown, NY | 2.0 | 1.0 | 950 | $2,300 | $2.42 | 45d | 1 | 1.05mi |
| 1 Giada Ln #5 Middletown, NY | 2.0 | 1.0 | 950 | $2,300 | $2.42 | 45d | 1 | 1.06mi |
| 102 Wawayanda Ave Unit 1 Middletown, NY | 2.0 | 1.0 | 750 | $1,950 | $2.60 | 45d | 1 | 1.33mi |
| 700 Stratford Ln Middletown, NY | 2.0 | 1.5 | 800 | $2,200 | $2.75 | 15d | 1 | 1.35mi |
| 38 Richmond Pl Unit 1B Middletown, NY | 2.0 | 1.0 | 950 | $2,400 | $2.53 | 15d | 1 | 1.36mi |
Listing history 25 events
-
2026-06-22days on market $298,900 Active 39 DOM
-
2026-06-18days on market $298,900 Active 36 DOM
-
2026-06-17days on market $298,900 Active 35 DOM
-
2026-06-16days on market $298,900 Active 34 DOM
-
2026-06-15days on market $298,900 Active 33 DOM
-
2026-06-14days on market $298,900 Active 31 DOM
-
2026-06-13days on market $298,900 Active 30 DOM
-
2026-06-10days on market $298,900 Active 28 DOM
-
2026-06-09days on market $298,900 Active 27 DOM
-
2026-06-08days on market $298,900 Active 26 DOM
-
2026-06-07days on market $298,900 Active 25 DOM
-
2026-06-05days on market $298,900 Active 22 DOM
-
2026-06-03days on market $298,900 Active 21 DOM
-
2026-06-02days on market $298,900 Active 20 DOM
-
2026-06-01days on market $298,900 Active 19 DOM
-
2026-05-31days on market $298,900 Active 18 DOM
-
2026-05-30days on market $298,900 Active 17 DOM
-
2026-05-13$298,900 Active 469-char remark
-
1998-11-10soldstatus $107,000
-
1998-11-02soldstatus $81,500 19-char remark
Show marketing remark (19 chars)
EXCELLENT LOCATION!
-
1998-04-16historical 19-char remark
Show marketing remark (19 chars)
EXCELLENT LOCATION!
-
1998-04-16price $87,500 19-char remark
Show marketing remark (19 chars)
EXCELLENT LOCATION!
-
1998-01-08$81,500 19-char remark
Show marketing remark (19 chars)
EXCELLENT LOCATION!
-
1994-10-27soldstatus $117,000
-
1992-03-18soldstatus $125,000
ⓘ Source: listings_history table (triggers on properties + properties_extension) + one-shot
backfill from property_details.listing_events for pre-trigger history.
Tax reassessment forecast NY · Partial reset (capped growth)
- Current annual tax
- $7,683 · $640/mo
- Projected year-2 tax
- $7,683 · $640/mo
- Expected delta
- $0/yr ($0/mo · -0.0%)
ⓘ Screening estimate from a state-policy table — verify with the county assessor before closing.
Climate risk First Street
- Flood 1/10 Low FEMA zone X (unshaded) · 0% chance over 30 yrs
- Wildfire 2/10 Low
- Heat 4/10 Moderate 7 d/yr ≥100°F today · 15 d/yr by 30 yrs out
- Wind 4/10 Moderate 10% chance of damaging wind over 30 yrs
- Air quality 2/10 Low 1 unhealthy d/yr today · 2 by 30 yrs out
Nearby sold comps map
Loading sold comps map…
Walkable amenities ~0.75 mi
Loading nearby amenities…
Taxation est. · year 1
- Rental income
- $30,026
- − Mortgage interest
- −$16,743
- − Property taxes
- −$7,683
- − Insurance
- −$1,494
- − Repairs & maintenance
- −$2,402
- − Management
- −$2,402
- − Depreciation
- −$8,695
- Taxable loss
- −$9,394
- Est. tax savings @ 24.0%
- +$2,255
- After-tax cash flow
- $-2,012/yr
For passive investors: Depreciation is non-cash, so a rental often shows a tax loss while cash-flowing — sheltering income. Rental losses are passive: they offset passive income freely, and up to $25,000/yr can offset ordinary (W-2) income if you actively participate and your MAGI is under $100k (phasing out to $0 by $150k); unused losses carry forward. On sale, claimed depreciation is recaptured at up to 25%, and gains may owe capital-gains tax (a 1031 exchange can defer both). Figures are a year-1 estimate at your 24.0% rate — not tax advice; consult a CPA.
Schools (NCES district)
- District
- Middletown City School District
- NCES district ID
- 3619320
- Math proficiency
- 41% ▼ -2.00%
- Reading proficiency
- 55% ▲ 19.00%
- Median HH income
- $54,612
- Composite
- 41.52/100
- National rank
- #3453
- State rank
- #411 of 590 in NY
Livability — Middletown
- Score
- 82/100
- State rank
- #79
- US rank
- #1219
Category grades
Schools grade is shown separately in the Schools card above.
Census & demographics
- Census place
- Middletown, NY
- County
- Orange County · 267,004 people
- City population
- 68,033
- Metro
- Poughkeepsie-Newburgh-Middletown, NY
- Population (ZIP)
- 53,611
- Household income
- $87,080
- Rent vs Own
- Severe rent burden
- 1846.0
Population outlook (Orange County) Hauer SSP2
- Today (2025)
- 379,830 people
- By 2030
- 378,955 · -0.2%
- By 2040
- 375,444 · -1.2%
- By 2050
- 369,311 · -2.8%
- By 2075
- 354,233 · -6.7%
- By 2100
- 318,150 · -16.2%
Race, ethnicity, and origin ACS 2023
- Neighborhood character
- Highly diverse neighborhood (Simpson 0.70)
- Race & ethnicity
- White 39% Hispanic / Latino 32% Black 20% Two or more races 13% Asian 4% Native American 3%
- Hispanic origin (detail)
- Mexican 9% Puerto Rican 13% Dominican 3%
- Common ancestry
- Romanian 3% Italian 1% Iranian 1%
- Foreign-born
- 18% · Canada, China, Jamaica
- Languages at home
- 72% English-only · Spanish 21% Other Indo-European 2% Chinese 1%
Political lean MEDSL · Orange
- 2024 margin
- Lean R (+8.4) · D 45.8% · R 54.2%
- 2008→2024 swing
- -12.5pp toward R · 2008: 4.1pp · 2024: -8.4pp
- All cycles
- 2024: R+8.4 2020: R+0.2 2016: R+6.5 2012: D+5.2 2008: D+4.1
Not yet ingested
- Civics
- —
Market trends
- HPI YoY
- ▼ -71.68%
- Current HPI
- 311.5969
- Rent YoY
- ▲ 8.23%
- Metro
- Poughkeepsie-Newburgh-Middletown, NY
- State GDP YoY
- ▲ 2.60%
- F500 in state
- 92
Industry mix (Fortune 500 HQ in NY)
| Industry | F500 HQs | Revenue |
|---|---|---|
| Financial Services | 10 | $950B |
|
||
| Consumer Goods | 9 | $162B |
|
||
| Insurance | 4 | $225B |
|
||
| Telecommunications | 2 | $144B |
|
||
| Pharmaceuticals | 2 | $112B |
|
||
| Media / Entertainment | 2 | $69B |
|
||
Price history
+139.1% since first listed8 events — show timeline
- 2026-05-13 Listed $298,900 OneKey® MLS as Distributed by MLS Grid
- 1998-11-10 Sold (Public Records) $107,000 Public Records
- 1998-11-02 Sold (MLS) $81,500 HGMLS
- 1998-04-16 Price Changed $87,500 HGMLS
- 1998-04-16 Delisted — HGMLS
- 1998-01-08 Listed $81,500 HGMLS
- 1994-10-27 Sold (Public Records) $117,000 Public Records
- 1992-03-18 Sold (Public Records) $125,000 Public Records
Property tax history
+2.9%/yrLatest (2025): $7,683 · -0.7% YoY. Source: county tax records.
Cash-flow waterfall
monthlySold comps — $/sqft
last 12 mo · ≤1 miLoading sold comps…