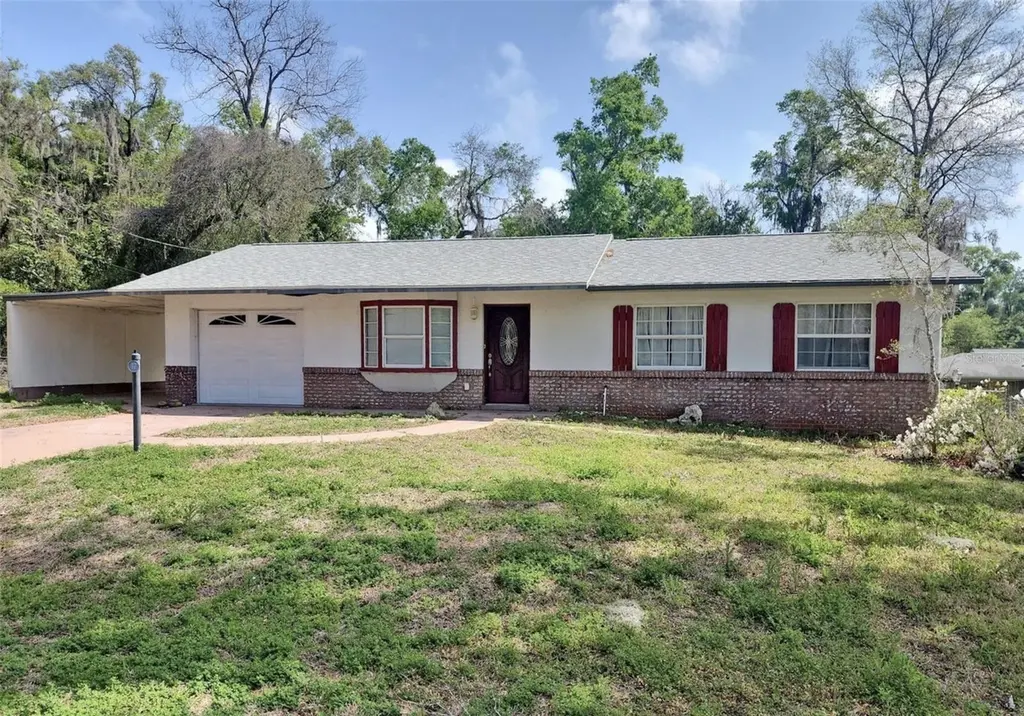
17 Juniper Track Dr · Belleview, FL
Flood risk 1/10 · Minimal
- FEMA flood zone
- X (unshaded)
- Chance of flooding over 30 yrs
- 0.0%
- Est. flood insurance / yr
- $507 – $1,088
Fire risk 4/10 · Minor
- Est. fire insurance / yr
- $947 – $1,759
Heat risk 8/10 · Major
- Hot days now (above 108°F)
- 7 days/yr
- Hot days in 30 yrs
- 21 days/yr
Wind risk 9/10 · Severe
- Chance of severe wind over 30 yrs
- 99.0%
Air-quality risk 3/10 · Minor
- Unhealthy air days now
- 3 days/yr
- Unhealthy air days in 30 yrs
- 4 days/yr
Risk factors via First Street. Map © Google.
Why this score? — see what drove the C- grade
The composite is a weighted blend of 9 inputs, each scored 0–100. Each bar is that input's sub-score; the figure is the points it added to the 100-point composite (weight × sub-score).
- Cash flow +15.5/30.0
- ARV discount +14.9/15.0
- DSCR +4.8/10.0
- 1% rule +4.5/10.0
- Schools +3.6/10.0
- Livability +3.5/5.0
- Rent growth +3.2/5.0
- Condition / age +2.5/5.0
- Appreciation +0.0/10.0
$179,700
🖨 Deal sheet 📄 Offer letter ✓ Due diligence
Listing remarks MLS
Welcome home to this cute and cozy 3-bedroom, 1-bath gem offering comfort, functionality, and a great location! Inside, you’ll find hard flooring throughout for easy maintenance and a clean, modern feel. The well-designed floorplan features a spacious living room and a dining area conveniently located just off the kitchen—perfect for everyday living and entertaining. The kitchen comes equipped with classic white appliances and provides a bright, welcoming space to prepare meals. French doors open to a large family room addition, complete with a charming bay window that fills the space with natural light—ideal for a second living area, playroom, or movie room. This home also offers excellent parking and storage options with both a covered carport and a one-car garage—perfect for creating a workshop space or extra storage. Step outside to enjoy the backyard, where a large wood deck creates the perfect setting for relaxing, grilling, or hosting gatherings. A storage shed adds even more convenience for tools, hobbies, or outdoor gear. Situated near Legacy Elementary School and the scenic Santos Greenway trails, this home offers easy access to schools, outdoor recreation, and everything the area has to offer. Don’t miss your opportunity to own this charming home—schedule your showing today and see all it has to offer!
Key facts
- Dining area
- Hard flooring
- Bay window
Tags
Neighborhood map
What this means for you Summary
Snapshot
- This is a 3-bed/1.0-bath single-family listed at $180k.
Deal economics
- At list price, monthly cash flow is $71 ($855/yr) — positive.
- The deal already cash-flows at list — no discount required.
- To meet the 1% rule (rent ≥ 1% of price), the offer needs to be $171k (5.0% below list).
- Recommended offer: $169k (6.0% below list) — sets the bar for market timing.
- Cap rate 6.8% vs local median 4.5% in Belleview — top-decile yield for the area; either an underpriced asset or a hidden risk that comps aren't pricing in. Stress-test before assuming the spread holds.
Location & tenants
- Location reads 69/100 on livability (#458 in FL) — a middle-class / working-renter tenant base. Strengths: cost of living A+, housing A+, health & safety A+; Watch: schools D, crime F, amenities F.
- Marion (rural): math 42% / reading 43% proficiency, ranked #61 of 73 in FL (top 84%) — families likely to look elsewhere, expect single-tenant / working-renter base with shorter leases; 61% free/reduced lunch — lower-income household profile, screen leases tightly.
- Market conditions: Rents rising (+2.8%/yr); 344 active listings in the ZIP; 20 comparable units currently listed for rent nearby; rentals at typical pace (median 21d on market — plan ~3-4 weeks tenant-placement turnaround); solid renter incomes; 7,071 units permitted in Marion County in 2024 (534 in 5+ unit buildings).
Forward outlook
- Local home prices are declining (-3.0%/yr); year-one equity from $1k of loan paydown is wiped out by about $5k of value loss. Plan a longer hold.
- Marion County population projected at +13% by 2050 — modest demand growth; plan on rents tracking national, not racing it.
Negotiation context
- It's been on market 61 days — a 6% lower offer ($169k) is reasonable based on typical stale-listing flexibility.
- Current owner paid $52k; list at $180k implies a 246% gain — meaningful room to come down on a strong offer.
Risks & watch-outs
- Climate carrying-cost: severe wind risk, 99% chance of damaging wind over 30y; extreme-heat days projected 7→21/yr by 2055 (HVAC capex compounding) — expect insurance premiums to compound above CPI over the hold.
Questions for the listing agent
- It's been on market 61 days. Have you received any prior offers? Is the seller open to a 6% concession, seller financing, or rate buy-down credit?
- Why hasn't it sold? Are there any deal-killer items the seller is aware of (foundation, flood, title, zoning, code violations)?
- Is there a deadline driving the sale (1031 exchange, divorce, estate, relocation)? That informs how much negotiation room exists.
- Schools are D-rated, which usually means shorter tenancies and higher turnover. Who's the typical renter profile here, and what's been the actual vacancy rate?
- Crime grade is F in this area — have there been break-ins, vandalism, or insurance claims at this property in the last 3 years? What carrier currently insures it and at what premium?
- What's the average days-on-market for RENTAL listings here right now (not sales)? A rising rental-DOM trend means longer vacancies and softer asking-rent achievability than the comps imply.
- What's the recent tenant-quality profile in this submarket — average credit score on applications, eviction rate, late-payment / NSF rate, and stable-employment percentage? A property-management company in the area should have these aggregated.
- How much new for-sale + rental construction is in the pipeline within 1–3 miles? Heavy new supply typically softens prices + rents 12–24 months out; constrained supply supports both.
Investment metrics
- 1% rule
- 0.95% ✗
- Cap rate
- 6.77%
- Cash-on-cash
- 1.70%
- DSCR
- 1.08
- GRM
- 8.8
CMA / ARV
- ARV (median comp)
- $215,185
- List price
- $179,700
- Delta
- -16.49%
- Verdict
- UNDERPRICED
- Comps
- 20 within 1.0 mi
Show comp detail 12 sales within ~0.75 mi
| Address | Dist | Beds/Ba | Sqft | Sold | Price | $/sf | Match |
|---|---|---|---|---|---|---|---|
| 36 Juniper Pass Ln | 0.12mi | 3/2.0 | 1,325 (-4%) | 6mo | $170,000 | $128 | 78 |
| 8821 Juniper Rd | 0.25mi | 3/2.0 | 1,378 (-0%) | 7mo | $238,000 | $173 | 78 |
| 14 Juniper Track Dr | 0.04mi | 3/2.0 | 1,508 (+9%) | 7mo | $218,000 | $145 | 73 |
| 18 Larch Radl | 0.43mi | 3/2.0 | 1,451 (+5%) | 12mo | $272,000 | $187 | 58 |
| 44 Walnut Dr | 0.71mi | 3/2.0 | 1,453 (+5%) | 4mo | $280,400 | $193 | 51 |
| 23 Juniper Drive Ct | 0.71mi | 3/2.0 | 1,413 (+2%) | 12mo | $240,000 | $170 | 50 |
| 27 Juniper Dr | 0.54mi | 3/2.0 | 1,284 (-7%) | 12mo | $249,900 | $195 | 49 |
| 7 Larch Dr | 0.59mi | 3/2.0 | 1,296 (-6%) | 12mo | $285,000 | $220 | 48 |
| 4955 SE 89th Place Rd | 0.44mi | 3/2.0 | 1,537 (+11%) | 11mo | $288,000 | $187 | 48 |
| 15 Juniper Trail Ln SE | 0.37mi | 3/2.0 | 1,532 (+11%) | 19mo | $302,000 | $197 | 45 |
| 4527 SE 89th St | 0.65mi | 3/2.0 | 1,545 (+12%) | 18mo | $310,240 | $201 | 31 |
| 5349 SE 91st Pl | 0.72mi | 3/2.0 | 1,545 (+12%) | 17mo | $290,000 | $188 | 28 |
Match score weights: distance 35% · size 25% · config 20% · recency 20%. Top-matched comps best support the ARV.
Projected returns pro-forma
-3.0% appreciation · 2.84% rent growth · sell at horizon
- IRR
- -13.8%
- Equity multiple
- 0.51×
- Total profit
- $-24,807
- Equity at exit
- $26,794
- IRR
- -5.1%
- Equity multiple
- 0.67×
- Total profit
- $-16,687
- Equity at exit
- $15,537
Cash invested: $50,316 (down + closing). Projections, not guarantees.
Landlord ↔ Tenant lean methodology
- Overall (STATE)
- 87 Strongly Landlord-Friendly
- State Florida
- 87 Strongly Landlord-Friendly · R+3
- County
- — inherits STATE
- City
- — inherits STATE
ZIP-level market 34480
- Home prices YoY
- -28.7%
- Rents YoY
- 2.8%
- Active inventory
- 344
- Price-to-rent
- 8.8×
Monthly cashflow live
- Estimated rent
- $1,707 high interval (Pro) →
- Mortgage (P&I)
- −$942
- Tax from tax record
- −$260 /mo · $3,118/yr
- Insurance
- −$75
- HOA
- −$0
- Vacancy / Maint / Mgmt
- −$358
- Net cashflow
- $71
Break-even live
UW: 25.0% down · 7.5% · 30yr · 1.5% tax · 5.0% vac · 8.0% maint · 8.0% mgmt
Financing live
Cash to close
- Down payment
- $44,925
- Closing costs
- $5,391
- Reserves months
- —
- Total cash needed
- —
Loan-product check · same deal, 3 products live
Conventional
25% down · 7.5% · 30yr
- Down + closing
- —
- Monthly P&I
- —
- Monthly cashflow
- —
- DSCR
- —
- Eligible?
- —
Personal DTI + credit; lowest rate.
DSCR
20% down · 8.5% · 30yr
- Down + closing
- —
- Monthly P&I
- —
- Monthly cashflow
- —
- DSCR
- —
- Eligible?
- —
No personal income docs; deal must DSCR.
Hard money
10% down · 12.0% · 12mo
- Down + closing
- —
- Monthly P&I
- —
- Monthly cashflow
- —
- DSCR
- —
- Eligible?
- —
Short-term bridge; refi at stabilization.
Rent comps 20 comps
| Address | Beds | Baths | Sqft | Rent | $/sqft | DOM | Units | Dist |
|---|---|---|---|---|---|---|---|---|
| 15 Juniper Pass Ln Ocala, FL | 4.0 | 2.0 | 1608 | $1,900 | $1.18 | 13d | 1 | 0.11mi |
| 10 Juniper Trl Ocala, FL | 4.0 | 2.0 | 1617 | $1,875 | $1.16 | 13d | 1 | 0.23mi |
| 57 Juniper Pass Ocala, FL | 2.0 | 2.0 | 974 | $1,200 | $1.23 | 13d | 1 | 0.24mi |
| 18 Juniper Trl Ocala, FL | 3.0 | 2.0 | 1270 | $1,750 | $1.38 | 13d | 1 | 0.25mi |
| 7 Juniper Pass Way Ocala, FL | 3.0 | 2.0 | 1453 | $1,750 | $1.20 | 21d | 1 | 0.41mi |
| 28 Juniper Dr Ocala, FL | 3.0 | 2.0 | 1453 | $1,650 | $1.14 | 21d | 1 | 0.53mi |
| 338 Larch Rd Ocala, FL | 3.0 | 2.0 | 1394 | $1,595 | $1.14 | 21d | 1 | 0.58mi |
| 50 Walnut Run Ocala, FL | 3.0 | 2.0 | 1287 | $1,795 | $1.39 | 13d | 1 | 0.65mi |
| 123 Juniper Loop Ocala, FL | 3.0 | 2.0 | 1445 | $1,695 | $1.17 | 21d | 1 | 0.65mi |
| 47 Walnut Run Ocala, FL | 2.0 | 2.0 | 974 | $1,235 | $1.27 | 13d | 1 | 0.70mi |
| 5494 SE 91st St Ocala, FL | 4.0 | 2.0 | 1858 | $2,200 | $1.18 | 13d | 1 | 0.71mi |
| 52 Walnut Rd Ocala, FL | 2.0 | 2.0 | 969 | $1,175 | $1.21 | 13d | 1 | 0.76mi |
| 28 Poplar Run Ocala, FL | 3.0 | 2.0 | 1473 | $1,650 | $1.12 | 13d | 1 | 0.77mi |
| 31 Walnut Run Ocala, FL | 2.0 | 2.0 | 974 | $1,200 | $1.23 | 13d | 1 | 0.78mi |
| 60 Walnut Rd Ocala, FL | 2.0 | 2.0 | 969 | $1,200 | $1.24 | 21d | 1 | 0.78mi |
| 66 Laurel Pass Ocala, FL | 2.0 | 2.0 | 974 | $1,175 | $1.21 | 21d | 1 | 1.31mi |
| 58 Laurel Pass Ocala, FL | 2.0 | 2.0 | 1000 | $1,200 | $1.20 | 21d | 1 | 1.34mi |
| 11 Aspen Dr Ocala, FL | 3.0 | 2.0 | 1357 | $1,725 | $1.27 | 21d | 1 | 1.35mi |
| 54 Laurel Pass Ocala, FL | 2.0 | 2.0 | 1000 | $1,200 | $1.20 | 21d | 1 | 1.37mi |
| 23 Aspen Dr Ocala, FL | 3.0 | 2.0 | 1399 | $1,650 | $1.18 | 21d | 1 | 1.45mi |
Listing history 18 events
-
2026-06-18days on market $179,700 Active 61 DOM
-
2026-06-17days on market $179,700 Active 60 DOM
-
2026-06-16days on market $179,700 Active 59 DOM
-
2026-06-15days on market $179,700 Active 58 DOM
-
2026-06-14days on market $179,700 Active 56 DOM
-
2026-06-13days on market $179,700 Active 55 DOM
-
2026-06-10days on market $179,700 Active 53 DOM
-
2026-06-09days on market $179,700 Active 52 DOM
-
2026-06-08days on market $179,700 Active 51 DOM
-
2026-06-07days on market $179,700 Active 50 DOM
-
2026-06-03days on market $179,700 Active 46 DOM
-
2026-06-02days on market $179,700 Active 45 DOM
-
2026-06-01days on market $179,700 Active 44 DOM
-
2026-05-31days on market $179,700 Active 43 DOM
-
2026-05-30days on market $179,700 Active 42 DOM
-
2026-04-18$189,700 Active 1370-char remark
Show marketing remark (1370 chars)
Welcome home to this cute and cozy 3-bedroom, 1-bath gem offering comfort, functionality, and a great location! Inside, you’ll find hard flooring throughout for easy maintenance and a clean, modern feel. The well-designed floorplan features a spacious living room and a dining area conveniently located just off the kitchen—perfect for everyday living and entertaining. The kitchen comes equipped with classic white appliances and provides a bright, welcoming space to prepare meals. French doors open to a large family room addition, complete with a charming bay window that fills the space with natural light—ideal for a second living area, playroom, or movie room. This home also offers excellent parking and storage options with both a covered carport and a one-car garage—perfect for creating a workshop space or extra storage. Step outside to enjoy the backyard, where a large wood deck creates the perfect setting for relaxing, grilling, or hosting gatherings. A storage shed adds even more convenience for tools, hobbies, or outdoor gear. Situated near Legacy Elementary School and the scenic Santos Greenway trails, this home offers easy access to schools, outdoor recreation, and everything the area has to offer. Don’t miss your opportunity to own this charming home—schedule your showing today and see all it has to offer!
-
2000-09-09soldstatus $52,000
-
1991-01-01soldstatus $46,700
ⓘ Source: listings_history table (triggers on properties + properties_extension) + one-shot
backfill from property_details.listing_events for pre-trigger history.
Tax reassessment forecast FL · Resets to sale price
- Current annual tax
- $3,118 · $260/mo
- Projected year-2 tax
- $3,118 · $260/mo
- Expected delta
- $0/yr ($0/mo · -0.0%)
ⓘ Screening estimate from a state-policy table — verify with the county assessor before closing.
Climate risk First Street
- Flood 1/10 Low FEMA zone X (unshaded) · 0% chance over 30 yrs
- Wildfire 4/10 Moderate
- Heat 8/10 Severe 7 d/yr ≥108°F today · 21 d/yr by 30 yrs out
- Wind 9/10 Extreme 99% chance of damaging wind over 30 yrs
- Air quality 3/10 Moderate 3 unhealthy d/yr today · 4 by 30 yrs out
Nearby sold comps map
Loading sold comps map…
Walkable amenities ~0.75 mi
Loading nearby amenities…
Taxation est. · year 1
- Rental income
- $20,481
- − Mortgage interest
- −$10,066
- − Property taxes
- −$3,118
- − Insurance
- −$898
- − Repairs & maintenance
- −$1,638
- − Management
- −$1,638
- − Depreciation
- −$5,228
- Taxable loss
- −$2,106
- Est. tax savings @ 24.0%
- +$505
- After-tax cash flow
- $1,361/yr
For passive investors: Depreciation is non-cash, so a rental often shows a tax loss while cash-flowing — sheltering income. Rental losses are passive: they offset passive income freely, and up to $25,000/yr can offset ordinary (W-2) income if you actively participate and your MAGI is under $100k (phasing out to $0 by $150k); unused losses carry forward. On sale, claimed depreciation is recaptured at up to 25%, and gains may owe capital-gains tax (a 1031 exchange can defer both). Figures are a year-1 estimate at your 24.0% rate — not tax advice; consult a CPA.
Schools (NCES district)
- District
- Marion
- NCES district ID
- 1201260
- Math proficiency
- 42% ▼ -7.00%
- Reading proficiency
- 43% ▼ -4.00%
- Median HH income
- $40,015
- Composite
- 35.61/100
- National rank
- #4890
- State rank
- #61 of 73 in FL
Livability — Belleview
- Score
- 69/100
- State rank
- #458
- US rank
- #8314
Category grades
Schools grade is shown separately in the Schools card above.
Census & demographics
- County
- Marion County · 315,796 people
- City population
- 19,167
- Metro
- Ocala, FL
- Population (ZIP)
- 23,517
- Household income
- $77,557
- Rent vs Own
- Severe rent burden
- 169.0
Population outlook (Marion County) Hauer SSP2
- Today (2025)
- 365,905 people
- By 2030
- 376,768 · +3.0%
- By 2040
- 396,555 · +8.4%
- By 2050
- 412,723 · +12.8%
- By 2075
- 446,090 · +21.9%
- By 2100
- 436,193 · +19.2%
Race, ethnicity, and origin ACS 2023
- Neighborhood character
- Predominantly White (73%)
- Race & ethnicity
- White 73% Hispanic / Latino 15% Two or more races 11% Black 6% Asian 2%
- Hispanic origin (detail)
- Mexican 3% Puerto Rican 5% Cuban 2% Dominican 2%
- Common ancestry
- Italian 3% Slovak 3% Lithuanian 2%
- Foreign-born
- 6% · Canada
- Languages at home
- 89% English-only · Spanish 9% Other Asian/Pacific 1%
Political lean MEDSL · Marion
- 2024 margin
- Solid R (+31.6) · D 33.8% · R 65.5%
- 2008→2024 swing
- -20.0pp toward R · 2008: -11.6pp · 2024: -31.6pp
- All cycles
- 2024: R+31.6 2020: R+25.9 2016: R+26.2 2012: R+16.2 2008: R+11.6
Not yet ingested
- Civics
- —
Market trends
- HPI YoY
- ▼ -85.60%
- Current HPI
- 212.4262
- Rent YoY
- ▲ 2.84%
- Metro
- Ocala, FL
- State GDP YoY
- ▲ 3.28%
- F500 in state
- 36
Industry mix (Fortune 500 HQ in FL)
| Industry | F500 HQs | Revenue |
|---|---|---|
| Industrial Technology | 2 | $29B |
|
||
| Insurance | 2 | $17B |
|
||
| Retail | 1 | $60B |
|
||
| Technology Distribution | 1 | $58B |
|
||
| Homebuilding | 1 | $35B |
|
||
| Technology Manufacturing | 1 | $35B |
|
||
Price history
+306.2% since first listed3 events — show timeline
- 2026-04-18 Listed $189,700 Stellar MLS as Distributed by MLS Grid
- 2000-09-09 Sold (Public Records) $52,000 Public Records
- 1991-01-01 Sold (Public Records) $46,700 Public Records
Property tax history
+13.9%/yrLatest (2025): $3,118 · +266.9% YoY. Source: county tax records.
Cash-flow waterfall
monthlySold comps — $/sqft
last 12 mo · ≤1 miLoading sold comps…