710 W Akoya Pearl St #81 · St. George, UT
Flood risk 1/10 · Minimal
- FEMA flood zone
- X (unshaded)
- Chance of flooding over 30 yrs
- 0.0%
- Est. flood insurance / yr
- $507 – $1,088
Fire risk 6/10 · Moderate
- Est. fire insurance / yr
- $453 – $841
Heat risk 7/10 · Major
- Hot days now (above 103°F)
- 7 days/yr
- Hot days in 30 yrs
- 19 days/yr
Wind risk 1/10 · Minimal
- Chance of severe wind over 30 yrs
- —
Air-quality risk 1/10 · Minimal
- Unhealthy air days now
- 0 days/yr
- Unhealthy air days in 30 yrs
- 0 days/yr
Risk factors via First Street. Map © Google.
Why this score? — see what drove the B grade
The composite is a weighted blend of 9 inputs, each scored 0–100. Each bar is that input's sub-score; the figure is the points it added to the 100-point composite (weight × sub-score).
- Cash flow +30.0/30.0
- 1% rule +10.0/10.0
- DSCR +10.0/10.0
- ARV discount +7.5/15.0
- Condition / age +4.8/5.0
- Schools +3.7/10.0
- Rent growth +2.6/5.0
- Livability +2.5/5.0
- Appreciation +0.0/10.0
$105,000
🖨 Deal sheet (PDF) 📄 Offer letter ✓ Due diligence
Listing remarks
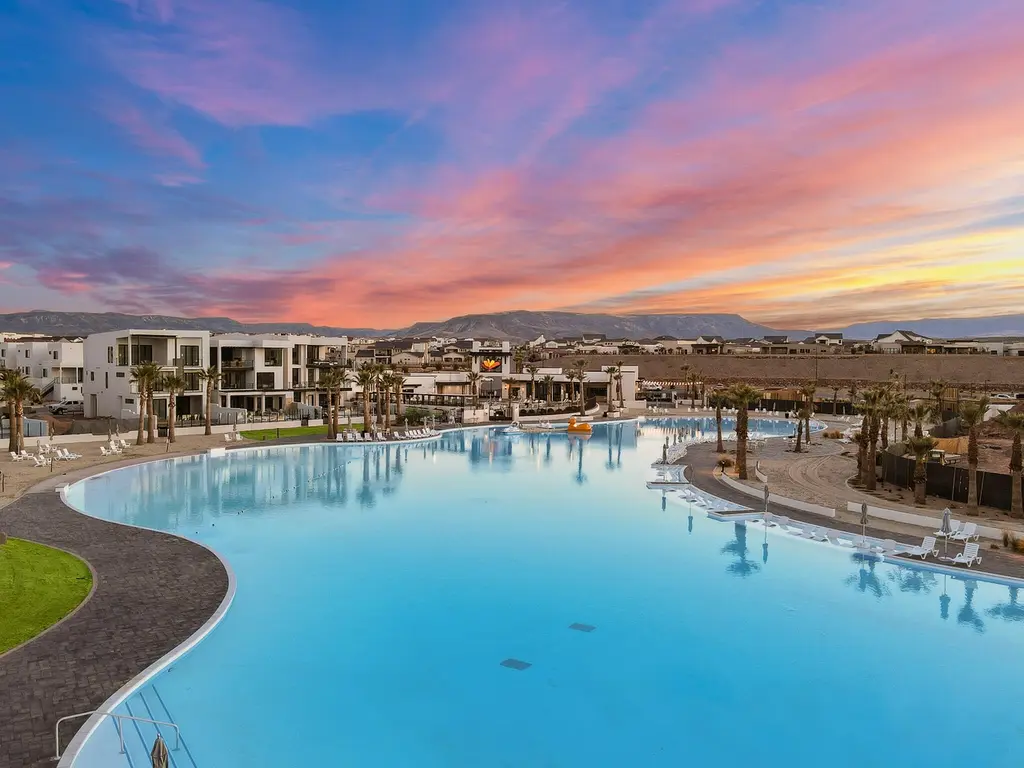
Fractional Co-Ownership Opportunity - Vacation Rental Approved! Own a 1/8 share of this beautifully furnished 3-bedroom, 3.5-bath home in the sought-after Desert Color community and enjoy 6+ weeks annually for personal use or rental income through Red Rock Vacation Rentals. This turnkey townhouse features tasteful furnishings, comfortable living areas, and inviting outdoor seating ideal for relaxing with family and friends. Enjoy full access to Desert Color's top-tier amenities, including the breathtaking lagoon, and take advantage of nearby attractions like Zion National Park for unforgettable adventures. Whether you're seeking a personal getaway or nightly rental, this is a rare chance to
Key facts
- Turnkey townhouse
- Nearby attractions
- Zion national park
Tags
Property features AI
Exterior
- Utilities: Electricity available; Natural gas connected
- Home design: Residential townhouse; 3-story building; Planned Unit Development (PUD)
- Construction: Stucco construction; Slab foundation; Built in recent years (see listing for exact year)
- Exterior features: Flat and tile roof
Interior
- Heating & cooling: Central air conditioning; Ceiling fan(s); Forced air heating
- Interior features: Ceiling fans in living areas; Walk-in closet(s); Window coverings
Neighborhood map
What this means for you Summary
Snapshot
- This is a 3-bed/4.0-bath townhouse listed at $105k. Condition is rated excellent.
Deal economics
- At list price, monthly cash flow is $1k ($13k/yr) — positive.
- The deal already cash-flows at list — no discount required.
- Meets the 1% rule at list price ($2k rent vs $105k).
- Recommended offer: $96k (9.0% below list) — sets the bar for market timing.
Location & tenants
- Location reads: area grade B — affects rentability + tenant quality, not the cash-flow math above.
- Washington District (urban): math 42% / reading 45% proficiency, ranked #37 of 80 in UT (top 46%) — families likely to look elsewhere, expect single-tenant / working-renter base with shorter leases.
- Zoned schools: Sunrise Ridge Intermediate (math 52% / reading 54%, grade C+, #17 of 138 statewide, top 12%, 810 students, 17% FRL); Desert Hills High (math 47% / reading 58%, grade C-, #22 of 171 statewide, top 13%, 1,210 students, 15% FRL) — zoned schools average 16% FRL vs 36% district-wide (20 pts lower); this property's tenant base skews higher-income than the district average.
- Market conditions: Rents flat; 980 active listings in the ZIP; 8 comparable units currently listed for rent nearby; rentals at typical pace (median 23d on market — plan ~3-4 weeks tenant-placement turnaround); solid renter incomes; 3,140 units permitted in Washington County in 2024 (650 in 5+ unit buildings).
- This rent runs 31% of the median local income ($91k/yr) — at the standard rent-burdened threshold; future hikes will face affordability resistance.
Forward outlook
- Local home prices are declining (-3.0%/yr); year-one equity from $726 of loan paydown is wiped out by about $3k of value loss. Plan a longer hold.
- Washington County population projected at +44% by 2050 — long-run rental-demand tailwind backs the buy-and-hold thesis.
- At projected returns (-3.0% appreciation + 0.2% rent growth), your $29k cash investment doubles in ~3 years — after that, you're playing with house money.
Negotiation context
- It's been on market 93 days — a 9% lower offer ($96k) is reasonable based on typical stale-listing flexibility.
- 2 sale attempts since 2y ago with the ask held roughly flat each time — persistent listings suggest the price (not the market) is what's stuck; bring a comps-based counter.
Risks & watch-outs
- Climate carrying-cost: major wildfire risk; extreme-heat days projected 7→19/yr by 2055 (HVAC capex compounding) — expect insurance premiums to compound above CPI over the hold.
Questions for the listing agent
- It's been on market 93 days. Have you received any prior offers? Is the seller open to a 9% concession, seller financing, or rate buy-down credit?
- Why hasn't it sold? Are there any deal-killer items the seller is aware of (foundation, flood, title, zoning, code violations)?
- Is there a deadline driving the sale (1031 exchange, divorce, estate, relocation)? That informs how much negotiation room exists.
- What's the average days-on-market for RENTAL listings here right now (not sales)? A rising rental-DOM trend means longer vacancies and softer asking-rent achievability than the comps imply.
- What's the recent tenant-quality profile in this submarket — average credit score on applications, eviction rate, late-payment / NSF rate, and stable-employment percentage? A property-management company in the area should have these aggregated.
- How much new for-sale + rental construction is in the pipeline within 1–3 miles? Heavy new supply typically softens prices + rents 12–24 months out; constrained supply supports both.
Investment metrics
- 1% rule
- 2.21% ✓
- Cap rate
- 18.92%
- Cash-on-cash
- 45.10%
- DSCR
- 3.01
- GRM
- 3.8
CMA / ARV
No comps found within radius.
Projected returns pro-forma
-3.0% appreciation · 0.2% rent growth · sell at horizon
- IRR
- 39.0%
- Equity multiple
- 2.60×
- Total profit
- $47,040
- Equity at exit
- $15,656
- IRR
- 44.0%
- Equity multiple
- 4.64×
- Total profit
- $107,063
- Equity at exit
- $9,078
Cash invested: $29,400 (down + closing). Projections, not guarantees.
Landlord ↔ Tenant lean methodology
- Overall (STATE)
- 86 Strongly Landlord-Friendly
- State Utah
- 86 Strongly Landlord-Friendly · R+15
- County
- — inherits STATE
- City
- — inherits STATE
ZIP-level market 84790
- Rents YoY
- 0.2%
- Active inventory
- 980
- Price-to-rent
- 3.8×
Monthly cashflow live
- Estimated rent
- $2,319 high interval (Pro) →
- Mortgage (P&I)
- −$551
- Tax from tax record
- −$133 /mo · $1,597/yr
- Insurance
- −$44
- HOA
- −$0
- Vacancy / Maint / Mgmt
- −$487
- Net cashflow
- $1,105
Break-even live
Sensitivity live
| Price | -10% $1,164 | -5% $1,135 | +0% $1,105 | +5% $1,075 | +10% $1,046 |
|---|---|---|---|---|---|
| Rent | -10% $922 | -5% $1,013 | +0% $1,105 | +5% $1,197 | +10% $1,288 |
| Rate | -1.0pp $1,158 | -0.5pp $1,132 | base $1,105 | +0.5pp $1,078 | +1.0pp $1,050 |
UW: 25.0% down · 7.5% · 30yr · 1.5% tax · 5.0% vac · 8.0% maint · 8.0% mgmt
Financing live
Cash to close
- Down payment
- $26,250
- Closing costs
- $3,150
- Reserves months
- —
- Total cash needed
- —
Loan-product check · same deal, 3 products live
Conventional
25% down · 7.5% · 30yr
- Down + closing
- —
- Monthly P&I
- —
- Monthly cashflow
- —
- DSCR
- —
- Eligible?
- —
Personal DTI + credit; lowest rate.
DSCR
20% down · 8.5% · 30yr
- Down + closing
- —
- Monthly P&I
- —
- Monthly cashflow
- —
- DSCR
- —
- Eligible?
- —
No personal income docs; deal must DSCR.
Hard money
10% down · 12.0% · 12mo
- Down + closing
- —
- Monthly P&I
- —
- Monthly cashflow
- —
- DSCR
- —
- Eligible?
- —
Short-term bridge; refi at stabilization.
Rent comps 8 comps
| Address | Beds | Baths | Sqft | Rent | $/sqft | DOM | Units | Dist |
|---|---|---|---|---|---|---|---|---|
| 662 W Rosa Ln Saint George, UT | 3.0 | 2.5 | 1628 | $2,400 | $1.47 | 15d | 1 | 0.09mi |
| 5544 S Ochre Ln Saint George, UT | 2.0 | 2.5 | 1478 | $2,425 | $1.64 | 22d | 1 | 0.20mi |
| 758 W Sunfire Ln Saint George, UT | 2.0 | 3.0 | 1406 | $2,000 | $1.42 | 22d | 1 | 0.24mi |
| 5088 S Desert Color Pkwy Saint George, UT | 3.0 | 1.0–2.0 | 883 | $2,309 | $2.61 | 15d | 47 | 0.43mi |
| 767 W Scarlet Hill Dr Saint George, UT | 3.0 | 2.5 | 2155 | $2,395 | $1.11 | 22d | 1 | 0.43mi |
| 5801 S Garnet Dr St George, UT | 1.0–3.0 | 1.0–2.0 | 1132 | $1,950 | $1.72 | 15d | 4 | 0.43mi |
| 667 W Desert Poppy Ln Saint George, UT | 3.0 | 3.0 | 1865 | $2,200 | $1.18 | 22d | 1 | 0.44mi |
| 6134 Snead Cir Saint George, UT | 3.0 | 3.0 | 1799 | $2,300 | $1.28 | 22d | 1 | 0.87mi |
Listing history 25 events
-
2026-06-22days on market $105,000 Active 93 DOM
-
2026-06-19days on market $105,000 Active 91 DOM
-
2026-06-18days on market $105,000 Active 90 DOM
-
2026-06-17days on market $105,000 Active 89 DOM
-
2026-06-16days on market $105,000 Active 88 DOM
-
2026-06-15days on market $105,000 Active 87 DOM
-
2026-06-14days on market $105,000 Active 85 DOM
-
2026-06-13days on market $105,000 Active 84 DOM
-
2026-06-10days on market $105,000 Active 82 DOM
-
2026-06-09days on market $105,000 Active 81 DOM
-
2026-06-08days on market $105,000 Active 80 DOM
-
2026-06-07days on market $105,000 Active 79 DOM
-
2026-06-05days on market $105,000 Active 76 DOM
-
2026-06-02days on market $105,000 Active 74 DOM
-
2026-06-01days on market $105,000 Active 73 DOM
-
2026-05-31days on market $105,000 Active 72 DOM
-
2026-05-30days on market $105,000 Active 71 DOM
-
2026-03-20$105,000 Active
-
2024-08-01historical
-
2024-07-02price $79,900
-
2024-02-01price $84,900
-
2024-01-25$89,900 Active
-
2023-03-06price $724,900
-
2023-01-17price $749,900
-
2021-07-30soldstatus
ⓘ Source: listings_history table (triggers on properties + properties_extension) + one-shot
backfill from property_details.listing_events for pre-trigger history.
Tax reassessment forecast UT · Resets to sale price
- Current annual tax
- $1,597 · $133/mo
- Projected year-2 tax
- $1,597 · $133/mo
- Expected delta
- $0/yr ($0/mo · 0.0%)
ⓘ Screening estimate from a state-policy table — verify with the county assessor before closing.
Climate risk First Street
- Flood 1/10 Low FEMA zone X (unshaded) · 0% chance over 30 yrs
- Wildfire 6/10 Major
- Heat 7/10 Severe 7 d/yr ≥103°F today · 19 d/yr by 30 yrs out
- Wind 1/10 Low
- Air quality 1/10 Low 0 unhealthy d/yr today · 0 by 30 yrs out
Nearby sold comps map
Loading sold comps map…
Walkable amenities ~0.75 mi
Loading nearby amenities…
Taxation est. · year 1
- Rental income
- $27,834
- − Mortgage interest
- −$5,882
- − Property taxes
- −$1,597
- − Insurance
- −$525
- − Repairs & maintenance
- −$2,227
- − Management
- −$2,227
- − Depreciation
- −$3,055
- Taxable income
- $12,323
- Est. tax owed @ 24.0%
- −$2,957
- After-tax cash flow
- $10,302/yr
For passive investors: Depreciation is non-cash, so a rental often shows a tax loss while cash-flowing — sheltering income. Rental losses are passive: they offset passive income freely, and up to $25,000/yr can offset ordinary (W-2) income if you actively participate and your MAGI is under $100k (phasing out to $0 by $150k); unused losses carry forward. On sale, claimed depreciation is recaptured at up to 25%, and gains may owe capital-gains tax (a 1031 exchange can defer both). Figures are a year-1 estimate at your 24.0% rate — not tax advice; consult a CPA.
Condition & rehab AI · 13 photos
This turnkey townhouse in Desert Color is in excellent condition with modern amenities and a beautiful outdoor space. It's ready for immediate occupancy and can be easily maintained to keep its value high.
Value-add opportunities
- Both Landscaping and pool maintenance — Maintaining the pool and landscaping will keep the property looking its best and attract more visitors
- Both Upgrade to smart home technology — Smart home features can increase both resale and rental value by making the property more convenient and appealing
Renovation cost estimate screening
Value-add ROI direction
- Both Landscaping and pool maintenance — Maintaining the pool and landscaping will keep the property looking its best and attract more visitors ↑
- Both Upgrade to smart home technology — Smart home features can increase both resale and rental value by making the property more convenient and appealing ↑
ⓘ Cost ranges are severity-bucket heuristics (US national rule-of-thumb). Get contractor quotes + a written scope before underwriting a rehab budget.
Schools (NCES district)
- District
- Washington District
- NCES district ID
- 4901140
- Math proficiency
- 42% ▼ -3.00%
- Reading proficiency
- 45% ▼ -3.00%
- Median HH income
- $50,861
- Composite
- 37.47/100
- National rank
- #4408
- State rank
- #37 of 80 in UT
Livability — St. George
No livability data for this city. (Only ~50 U.S. cities are tracked.)
Census & demographics
- Census place
- St. George, UT
- County
- Washington County · 179,216 people
- City population
- 101,579
- Metro
- St. George, UT
- Population (ZIP)
- 55,892
- Household income
- $91,054
- Rent vs Own
- Severe rent burden
- 1359.0
Population outlook (Washington County) Hauer SSP2
- Today (2025)
- 193,324 people
- By 2030
- 211,699 · +9.5%
- By 2040
- 246,449 · +27.5%
- By 2050
- 278,447 · +44.0%
- By 2075
- 342,734 · +77.3%
- By 2100
- 382,815 · +98.0%
Race, ethnicity, and origin ACS 2023
- Neighborhood character
- Predominantly White (83%)
- Race & ethnicity
- White 83% Hispanic / Latino 11% Two or more races 7% Native American 1%
- Hispanic origin (detail)
- Mexican 7%
- Common ancestry
- Slovak 5% Italian 2% Portuguese 2%
- Foreign-born
- 6% · Canada, Dominican Republic
- Languages at home
- 89% English-only · Spanish 8% Other Asian/Pacific 1%
Political lean MEDSL · Washington
- 2024 margin
- Solid R (+52.3) · D 23.0% · R 75.2% · Other 1.8%
- 2008→2024 swing
- +1.2pp toward D · 2008: -53.5pp · 2024: -52.3pp
- All cycles
- 2024: R+52.3 2020: R+51.7 2016: R+52.1 2012: R+67.0 2008: R+53.5
Not yet ingested
- Civics
- —
Market trends
- HPI YoY
- ▼ -210.13%
- Current HPI
- 218.2317
- Rent YoY
- ▲ 0.20%
- Metro
- St. George, UT
- State GDP YoY
- ▲ 3.54%
- F500 in state
- 2
Industry mix (Fortune 500 HQ in UT)
| Industry | F500 HQs | Revenue |
|---|---|---|
| Financial Services | 1 | $3B |
|
||
Price history
-86.0% since first listed8 events — show timeline
- 2026-03-20 Listed $105,000 WCBOR
- 2024-08-01 Listing Removed — WFRMLS
- 2024-07-02 Price Changed $79,900 WFRMLS
- 2024-02-01 Price Changed $84,900 WFRMLS
- 2024-01-25 Listed $89,900 WFRMLS
- 2023-03-06 Price Changed $724,900 WCBOR
- 2023-01-17 Price Changed $749,900 WCBOR
- 2021-07-30 Sold (Public Records) — Public Records
Property tax history
+188.8%/yrLatest (2021): $1,597 · +188.8% YoY. Source: county tax records.
Cash-flow waterfall
monthlySold comps — $/sqft
last 12 mo · ≤1 miLoading sold comps…