190 W Mark St · Batesville, AR
Flood risk 1/10 · Minimal
- FEMA flood zone
- X (unshaded)
- Chance of flooding over 30 yrs
- 0.0%
- Est. flood insurance / yr
- $507 – $1,088
Fire risk 5/10 · Moderate
- Est. fire insurance / yr
- $1,499 – $2,785
Heat risk 5/10 · Moderate
- Hot days now (above 108°F)
- 7 days/yr
- Hot days in 30 yrs
- 19 days/yr
Wind risk 3/10 · Minor
- Chance of severe wind over 30 yrs
- 4.0%
Air-quality risk 2/10 · Minimal
- Unhealthy air days now
- 0 days/yr
- Unhealthy air days in 30 yrs
- 2 days/yr
Risk factors via First Street. Map © Google.
Why this score? — see what drove the B- grade
The composite is a weighted blend of 9 inputs, each scored 0–100. Each bar is that input's sub-score; the figure is the points it added to the 100-point composite (weight × sub-score).
- Cash flow +30.0/30.0
- DSCR +10.0/10.0
- 1% rule +7.7/10.0
- ARV discount +7.5/15.0
- Livability +3.6/5.0
- Schools +3.1/10.0
- Rent growth +2.5/5.0
- Condition / age +2.5/5.0
- Appreciation +0.0/10.0
$60,000
🖨 Deal sheet 📄 Offer letter ✓ Due diligence
Listing remarks
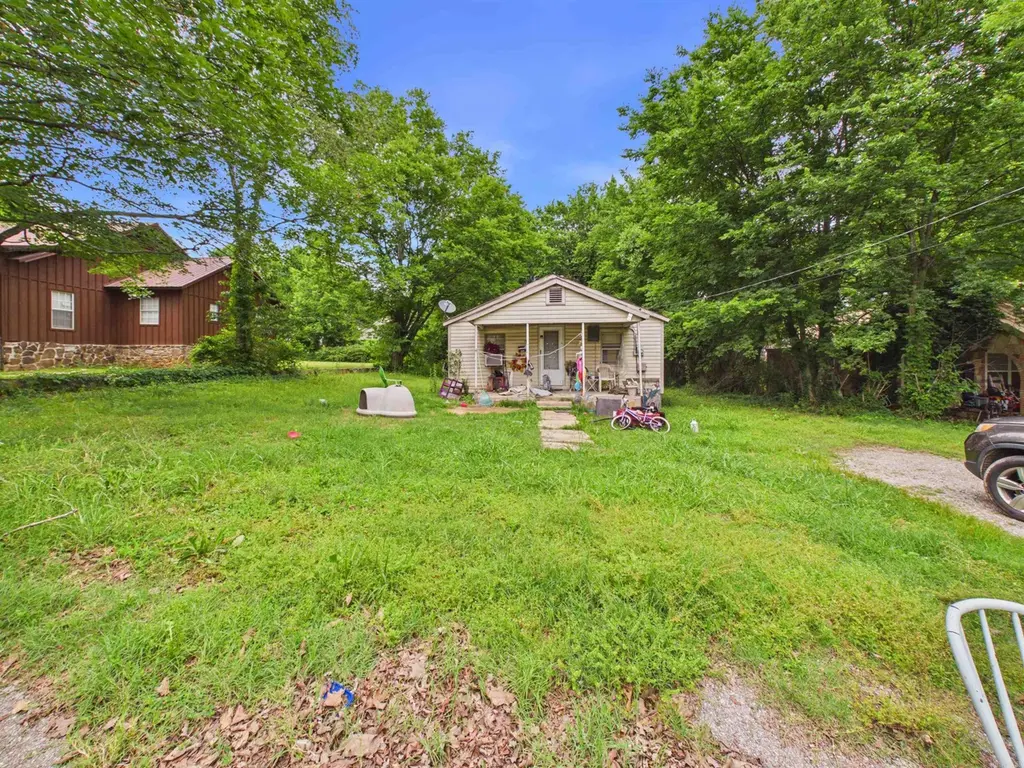
Welcome to 190 W. Mark Street in Batesville, Arkansas! This charming 2-bedroom, 1-bath home offers 672 square feet of comfortable living space and sits on a spacious city lot. Conveniently located close to schools, shopping, restaurants, and medical facilities, this property is ideal for first-time homebuyers, downsizers, or investors looking to add to their portfolio. The large yard provides plenty of room for outdoor activities, gardening, pets, or future improvements. Affordable homes in this price range are becoming increasingly difficult to find, making this an excellent opportunity to own a home in the heart of Batesville. Schedule your showing today!
Key facts
- Close to schools
- Close to restaurants
- Large yard
Tags
Property features AI
Exterior
- Utilities: Public sewer; Public water
- Home design: Single-family property (see remarks for details)
- Construction: Other exterior features (see remarks); Other foundation (see remarks); Other roof (see remarks)
- Exterior features: Level lot; Paved road access; Inside city limits
Interior
- Kitchen: Kitchen equipment: other (see remarks)
- Flooring: Other flooring (see remarks)
- Bathrooms: 1 full bathroom
- Heating & cooling: Other heating and cooling (see remarks)
- Interior features: Other interior features (see remarks)
Neighborhood map
What this means for you Summary
Snapshot
- This is a 2-bed/1.0-bath single-family listed at $60k.
Deal economics
- At list price, monthly cash flow is $240 ($3k/yr) — positive.
- The deal already cash-flows at list — no discount required.
- Meets the 1% rule at list price ($762 rent vs $60k).
- Recommended offer: $59k (1.5% below list) — sets the bar for market timing.
- Cap rate 11.1% vs local median 4.3% in Batesville — top-decile yield for the area; either an underpriced asset or a hidden risk that comps aren't pricing in. Stress-test before assuming the spread holds.
Location & tenants
- Location reads 72/100 on livability (#33 in AR) — a middle-class / working-renter tenant base. Strengths: cost of living A+, housing A+, health & safety A+; Watch: employment C-, crime D+, schools D.
- Batesville School District (rural): math 36% / reading 38% proficiency, ranked #104 of 238 in AR (top 44%) — families likely to look elsewhere, expect single-tenant / working-renter base with shorter leases.
- Market conditions: 176 active listings in the ZIP; 3 comparable units currently listed for rent nearby; rentals lingering (median 44d on market — plan ~5-8 weeks vacancy on turnover, expect pricing pressure); 100% of comp listings sitting > 30 days — soft ceiling on asking rent; 33 units permitted in Independence County in 2024 (24 in 5+ unit buildings).
- This rent is only 17% of the median local income ($53k/yr) — well below the 30% rent-burden line; pricing power to push rent on renewal without tenant pushback.
Forward outlook
- Local home prices are declining (-3.0%/yr); year-one equity from $415 of loan paydown is wiped out by about $2k of value loss. Plan a longer hold.
- At projected returns (-3.0% appreciation + 3.0% rent growth), your $17k cash investment doubles in ~8 years — after that, you're playing with house money.
Negotiation context
- It's been on market 15 days — a 2% lower offer ($59k) is reasonable based on typical stale-listing flexibility.
Risks & watch-outs
- Climate carrying-cost: moderate wildfire risk; extreme-heat days projected 7→19/yr by 2055 (HVAC capex compounding) — expect insurance premiums to compound above CPI over the hold.
Questions for the listing agent
- Is there a deadline driving the sale (1031 exchange, divorce, estate, relocation)? That informs how much negotiation room exists.
- Schools are D-rated, which usually means shorter tenancies and higher turnover. Who's the typical renter profile here, and what's been the actual vacancy rate?
- Crime grade is D in this area — have there been break-ins, vandalism, or insurance claims at this property in the last 3 years? What carrier currently insures it and at what premium?
- What's the average days-on-market for RENTAL listings here right now (not sales)? A rising rental-DOM trend means longer vacancies and softer asking-rent achievability than the comps imply.
- What's the recent tenant-quality profile in this submarket — average credit score on applications, eviction rate, late-payment / NSF rate, and stable-employment percentage? A property-management company in the area should have these aggregated.
- How much new for-sale + rental construction is in the pipeline within 1–3 miles? Heavy new supply typically softens prices + rents 12–24 months out; constrained supply supports both.
Investment metrics
- 1% rule
- 1.27% ✓
- Cap rate
- 11.09%
- Cash-on-cash
- 17.12%
- DSCR
- 1.76
- GRM
- 6.6
CMA / ARV
No comps found within radius.
Projected returns pro-forma
-3.0% appreciation · 3.0% rent growth · sell at horizon
- IRR
- 8.4%
- Equity multiple
- 1.33×
- Total profit
- $5,521
- Equity at exit
- $8,946
- IRR
- 17.6%
- Equity multiple
- 2.45×
- Total profit
- $24,379
- Equity at exit
- $5,188
Cash invested: $16,800 (down + closing). Projections, not guarantees.
Landlord ↔ Tenant lean methodology
- Overall (STATE)
- 92 Strongly Landlord-Friendly
- State Arkansas
- 92 Strongly Landlord-Friendly · R+14
- County
- — inherits STATE
- City
- — inherits STATE
ZIP-level market 72501
- Home prices YoY
- -16.3%
- Active inventory
- 176
- Price-to-rent
- 6.6×
Monthly cashflow live
- Estimated rent
- $762 medium interval (Pro) →
- Mortgage (P&I)
- −$315
- Tax from tax record
- −$23 /mo · $275/yr
- Insurance
- −$25
- HOA
- −$0
- Vacancy / Maint / Mgmt
- −$160
- Net cashflow
- $240
Break-even live
UW: 25.0% down · 7.5% · 30yr · 1.5% tax · 5.0% vac · 8.0% maint · 8.0% mgmt
Financing live
Cash to close
- Down payment
- $15,000
- Closing costs
- $1,800
- Reserves months
- —
- Total cash needed
- —
Loan-product check · same deal, 3 products live
Conventional
25% down · 7.5% · 30yr
- Down + closing
- —
- Monthly P&I
- —
- Monthly cashflow
- —
- DSCR
- —
- Eligible?
- —
Personal DTI + credit; lowest rate.
DSCR
20% down · 8.5% · 30yr
- Down + closing
- —
- Monthly P&I
- —
- Monthly cashflow
- —
- DSCR
- —
- Eligible?
- —
No personal income docs; deal must DSCR.
Hard money
10% down · 12.0% · 12mo
- Down + closing
- —
- Monthly P&I
- —
- Monthly cashflow
- —
- DSCR
- —
- Eligible?
- —
Short-term bridge; refi at stabilization.
Rent comps 3 comps
| Address | Beds | Baths | Sqft | Rent | $/sqft | DOM | Units | Dist |
|---|---|---|---|---|---|---|---|---|
| 507 Ferrell St Unit 1280 Agnes Batesville, AR | 1.0 | 1.0 | 650 | $695 | $1.07 | 44d | 1 | 0.41mi |
| 509 Ferrell St Unit 509 Ferrell Batesville, AR | 1.0 | 1.0 | 400 | $695 | $1.74 | 44d | 1 | 0.42mi |
| 1520 E Boswell St Unit 12 Batesville, AR | 1.0 | 1.0 | 660 | $750 | $1.14 | 44d | 1 | 1.36mi |
Listing history 12 events
-
2026-06-19days on market $60,000 Active 15 DOM
-
2026-06-18days on market $60,000 Active 14 DOM
-
2026-06-17days on market $60,000 Active 13 DOM
-
2026-06-16days on market $60,000 Active 12 DOM
-
2026-06-15days on market $60,000 Active 11 DOM
-
2026-06-14days on market $60,000 Active 9 DOM
-
2026-06-12statusdays on market $60,000 Active 8 DOM
-
2026-06-09days on market $60,000 New Listing 5 DOM
-
2026-06-08days on market $60,000 New Listing 4 DOM
-
2026-06-07days on market $60,000 New Listing 3 DOM
-
2026-06-07remarks 665-char remark
-
2026-06-07$60,000 New Listing 2 DOM
ⓘ Source: listings_history table (triggers on properties + properties_extension) + one-shot
backfill from property_details.listing_events for pre-trigger history.
Tax reassessment forecast AR · Resets to sale price
- Current annual tax
- $275 · $23/mo
- Projected year-2 tax
- $384 · $32/mo
- Expected delta
- +$109/yr (+$9/mo · 39.8%)
ⓘ Screening estimate from a state-policy table — verify with the county assessor before closing.
Climate risk First Street
- Flood 1/10 Low FEMA zone X (unshaded) · 0% chance over 30 yrs
- Wildfire 5/10 Major
- Heat 5/10 Major 7 d/yr ≥108°F today · 19 d/yr by 30 yrs out
- Wind 3/10 Moderate 4% chance of damaging wind over 30 yrs
- Air quality 2/10 Low 0 unhealthy d/yr today · 2 by 30 yrs out
Nearby sold comps map
Loading sold comps map…
Walkable amenities ~0.75 mi
Loading nearby amenities…
Taxation est. · year 1
- Rental income
- $9,147
- − Mortgage interest
- −$3,361
- − Property taxes
- −$275
- − Insurance
- −$300
- − Repairs & maintenance
- −$732
- − Management
- −$732
- − Depreciation
- −$1,745
- Taxable income
- $2,003
- Est. tax owed @ 24.0%
- −$481
- After-tax cash flow
- $2,395/yr
For passive investors: Depreciation is non-cash, so a rental often shows a tax loss while cash-flowing — sheltering income. Rental losses are passive: they offset passive income freely, and up to $25,000/yr can offset ordinary (W-2) income if you actively participate and your MAGI is under $100k (phasing out to $0 by $150k); unused losses carry forward. On sale, claimed depreciation is recaptured at up to 25%, and gains may owe capital-gains tax (a 1031 exchange can defer both). Figures are a year-1 estimate at your 24.0% rate — not tax advice; consult a CPA.
Schools (NCES district)
- District
- Batesville School District
- NCES district ID
- 0500019
- Math proficiency
- 36% ▼ -12.00%
- Reading proficiency
- 38% ▼ -6.00%
- Median HH income
- $37,304
- Composite
- 30.79/100
- National rank
- #6147
- State rank
- #104 of 238 in AR
Livability — Batesville
- Score
- 72/100
- State rank
- #33
- US rank
- #6274
Category grades
Schools grade is shown separately in the Schools card above.
Census & demographics
- Census place
- Batesville, AR
- County
- Independence County · 26,218 people
- City population
- 26,218
- Metro
- Batesville, AR
- Population (ZIP)
- 26,218
- Household income
- $52,829
- Rent vs Own
- Severe rent burden
- 553.0
Population outlook (Independence County) Hauer SSP2
- Today (2025)
- 37,748 people
- By 2030
- 37,962 · +0.6%
- By 2040
- 38,151 · +1.1%
- By 2050
- 37,980 · +0.6%
- By 2075
- 36,622 · -3.0%
- By 2100
- 32,741 · -13.3%
Race, ethnicity, and origin ACS 2023
- Neighborhood character
- Predominantly White (79%)
- Race & ethnicity
- White 79% Hispanic / Latino 12% Two or more races 8% Black 2% Asian 1%
- Hispanic origin (detail)
- Mexican 6%
- Common ancestry
- Slovak 2% Lithuanian 2% Italian 1%
- Foreign-born
- 5% · Canada, Vietnam
- Languages at home
- 92% English-only · Spanish 7% Other Asian/Pacific 1%
Political lean MEDSL · Independence
- 2024 margin
- Solid R (+59.5) · D 19.2% · R 78.7% · Other 2.1%
- 2008→2024 swing
- -22.3pp toward R · 2008: -37.1pp · 2024: -59.5pp
- All cycles
- 2024: R+59.5 2020: R+58.2 2016: R+52.4 2012: R+44.0 2008: R+37.1
Not yet ingested
- Civics
- —
Market trends
- HPI YoY
- ▼ -40.19%
- Current HPI
- 206.3787
- Rent YoY
- —
- Metro
- Batesville, AR
- State GDP YoY
- ▲ 3.80%
- F500 in state
- 10
Industry mix (Fortune 500 HQ in AR)
| Industry | F500 HQs | Revenue |
|---|---|---|
| Retail | 1 | $681B |
|
||
| Food / Agriculture | 1 | $53B |
|
||
| Retail / Energy | 1 | $22B |
|
||
| Transportation / Logistics | 1 | $12B |
|
||
| Energy | 1 | $4B |
|
||
Price history
+445.5% since first listed7 events — show timeline
- 2026-06-02 Listed $60,000 CARMLS
- 2025-12-02 Sold (Public Records) $240,000 Public Records
- 2016-02-17 Sold (Public Records) $274,000 Public Records
- 1997-02-18 Sold (Public Records) $20,000 Public Records
- 1994-05-27 Sold (Public Records) $12,000 Public Records
- 1992-06-02 Sold (Public Records) $11,000 Public Records
- 1990-01-02 Sold (Public Records) $11,000 Public Records
Property tax history
+0.9%/yrLatest (2025): $275 · +10.0% YoY. Source: county tax records.
Cash-flow waterfall
monthlySold comps — $/sqft
last 12 mo · ≤1 miLoading sold comps…