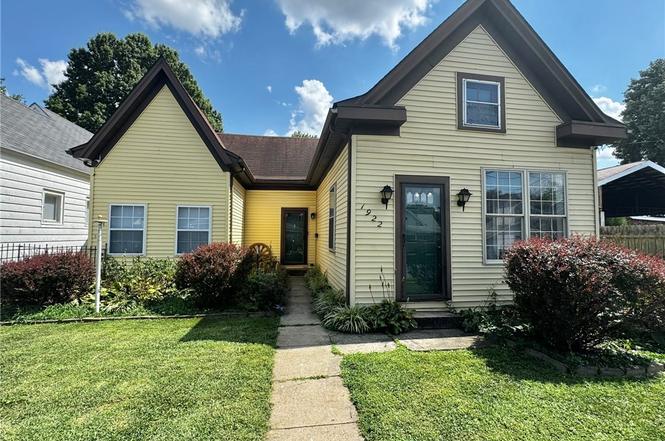
1922 Division St · New Albany, IN
Flood risk 1/10 · Minimal
- FEMA flood zone
- X (unshaded)
- Chance of flooding over 30 yrs
- 0.0%
- Est. flood insurance / yr
- $507 – $1,088
Fire risk 1/10 · Minimal
- Est. fire insurance / yr
- $717 – $1,331
Heat risk 5/10 · Moderate
- Hot days now (above 105°F)
- 7 days/yr
- Hot days in 30 yrs
- 20 days/yr
Wind risk 2/10 · Minimal
- Chance of severe wind over 30 yrs
- 2.0%
Air-quality risk 2/10 · Minimal
- Unhealthy air days now
- 1 days/yr
- Unhealthy air days in 30 yrs
- 2 days/yr
Risk factors via First Street. Map © Google.
Why this score? — see what drove the C+ grade
The composite is a weighted blend of 9 inputs, each scored 0–100. Each bar is that input's sub-score; the figure is the points it added to the 100-point composite (weight × sub-score).
- Cash flow +21.9/30.0
- ARV discount +15.0/15.0
- DSCR +7.0/10.0
- 1% rule +4.7/10.0
- Rent growth +4.3/5.0
- Schools +4.2/10.0
- Livability +3.7/5.0
- Condition / age +2.5/5.0
- Appreciation +0.0/10.0
$186,000
🖨 Deal sheet (PDF) 📄 Offer letter ✓ Due diligence
Listing remarks
Back on the market due to no fault of seller or home. Buyer unable to move forward. This home offers an open floor plan with a spacious living room, eat-in kitchen with lots of cabinets and the stove and refrigerator remain. There are 2 bedrooms on the first level and 2 more rooms upstairs. There is a very large closet and storage area upstairs. Yard is fully fenced and back yard features a large covered deck, garage and extra parking in rear. The clothes washer in garage can remain. This home features: New HVAC, new ductwork, new flooring throughout, fresh paint, new window blinds, updated electrical panel and breakers. Roof approximately 8 years old. Window AC unit upstairs to remain. Loc
Key facts
- Open floor plan
- Lots of cabinets
- Eat-in kitchen
Tags
Property features AI
Exterior
- Parking: Garage(s)
- Utilities: Public water (connected); Public sewer; Paved road access
- Home design: Single-story (1 story); Resale property
- Construction: Vinyl siding; Shingle roof; Foundation: block, poured, crawlspace, cellar
- Exterior features: Deck; Fenced yard; Landscaped yard; Attached or detached garage structure present
Interior
- Kitchen: Dishwasher; Oven; Range; Refrigerator; Eat-in kitchen; Ceiling fan in kitchen
- Bedrooms: Second-level room with large walk-in closet; Second-level bedroom (carpet); First-level bedroom with ceiling fan, no closet
- Flooring: Wood flooring in large walk-in closet room; Carpet in some upstairs rooms; Laminate flooring on main level
- Bathrooms: 1 full bathroom
- Heating & cooling: Forced air heating; Central air; Window and wall air conditioning units
- Interior features: Blinds; Ceiling fans; Eat-in kitchen; Main level primary; Open floor plan; Utility room; Vaulted ceilings; Window treatments
- Laundry & utility: Main-level laundry room
Neighborhood map
What this means for you Summary
Snapshot
- This is a 2-bed/1.0-bath single-family listed at $186k.
Deal economics
- At list price, monthly cash flow is $294 ($4k/yr) — positive.
- The deal already cash-flows at list — no discount required.
- To meet the 1% rule (rent ≥ 1% of price), the offer needs to be $180k (3.4% below list).
- Recommended offer: $164k (12.0% below list) — sets the bar for market timing.
- Cap rate 8.2% vs local median 3.8% in New Albany — top-decile yield for the area; either an underpriced asset or a hidden risk that comps aren't pricing in. Stress-test before assuming the spread holds.
Location & tenants
- Location reads 73/100 on livability (#100 in IN) — a middle-class / working-renter tenant base. Strengths: cost of living A+, housing A+, health & safety B; Watch: commute C-, employment D+, schools D.
- New Albany-Floyd County Consolidated Schools (suburban): math 46% / reading 50% proficiency, ranked #68 of 301 in IN (top 23%) — families likely to look elsewhere, expect single-tenant / working-renter base with shorter leases.
- Market conditions: Rents rising fast (+7.2%/yr); 269 active listings in the ZIP; 4 comparable units currently listed for rent nearby; rentals at typical pace (median 21d on market — plan ~3-4 weeks tenant-placement turnaround); 297 units permitted in Floyd County in 2024 (84 in 5+ unit buildings).
- This rent runs 34% of the median local income ($63k/yr) — at the standard rent-burdened threshold; future hikes will face affordability resistance.
Forward outlook
- Local home prices are declining (-3.0%/yr); year-one equity from $1k of loan paydown is wiped out by about $6k of value loss. Plan a longer hold.
- Floyd County population projected at +10% by 2050 — modest demand growth; plan on rents tracking national, not racing it.
- At projected returns (-3.0% appreciation + 7.2% rent growth), your $52k cash investment doubles in ~9 years — after that, you're playing with house money.
Negotiation context
- It's been on market 301 days — a 12% lower offer ($164k) is reasonable based on typical stale-listing flexibility.
- 2 sale attempts; this cycle's ask has dropped $28k (13%) from the opening price — seller is motivated, your offer sets the floor, not the list.
Risks & watch-outs
- Watch-outs: built in 1939 — expect roof / HVAC / electrical / plumbing capex.
- Climate carrying-cost: extreme-heat days projected 7→20/yr by 2055 (HVAC capex compounding) — expect insurance premiums to compound above CPI over the hold.
Questions for the listing agent
- It's been on market 301 days. Have you received any prior offers? Is the seller open to a 12% concession, seller financing, or rate buy-down credit?
- Built in 1939 — when were the roof, HVAC, electrical panel, plumbing, and water heater last replaced?
- Why hasn't it sold? Are there any deal-killer items the seller is aware of (foundation, flood, title, zoning, code violations)?
- Is there a deadline driving the sale (1031 exchange, divorce, estate, relocation)? That informs how much negotiation room exists.
- Schools are D-rated, which usually means shorter tenancies and higher turnover. Who's the typical renter profile here, and what's been the actual vacancy rate?
- What's the average days-on-market for RENTAL listings here right now (not sales)? A rising rental-DOM trend means longer vacancies and softer asking-rent achievability than the comps imply.
- What's the recent tenant-quality profile in this submarket — average credit score on applications, eviction rate, late-payment / NSF rate, and stable-employment percentage? A property-management company in the area should have these aggregated.
- How much new for-sale + rental construction is in the pipeline within 1–3 miles? Heavy new supply typically softens prices + rents 12–24 months out; constrained supply supports both.
Investment metrics
- 1% rule
- 0.97% ✗
- Cap rate
- 8.19%
- Cash-on-cash
- 6.77%
- DSCR
- 1.30
- GRM
- 8.6
CMA / ARV
- ARV (on-the-fly)
- $257,176
- Comps found
- 12
Show comp detail 12 sales within ~0.75 mi
| Address | Dist | Beds/Ba | Sqft | Sold | Price | $/sf | Match |
|---|---|---|---|---|---|---|---|
| 1921 E Spring St | 0.07mi | 3/2.0 (+1) | 2,100 (-0%) | 6mo | $320,000 | $152 | 83 |
| 1748 Ekin Ave | 0.37mi | 3/2.0 (+1) | 2,160 (+2%) | 2mo | $249,900 | $116 | 68 |
| 1748 E Oak St | 0.27mi | 3/2.0 (+1) | 2,003 (-5%) | 5mo | $250,000 | $125 | 66 |
| 2226 Reno Ave | 0.36mi | 2/2.0 | 1,919 (-9%) | 1mo | $105,000 | $55 | 63 |
| 716 Vincennes St | 0.43mi | 3/2.0 (+1) | 2,085 (-1%) | 7mo | $239,000 | $115 | 63 |
| 1905 Culbertson Ave | 0.30mi | 3/1.0 (+1) | 1,967 (-7%) | 9mo | $173,000 | $88 | 62 |
| 913 Silver St | 0.48mi | 2/2.0 | 1,911 (-9%) | 0mo | $300,000 | $157 | 58 |
| 321 E 13th St | 0.59mi | 3/1.5 (+1) | 2,044 (-3%) | 5mo | $110,000 | $54 | 56 |
| 1912 Beeler St | 0.47mi | 3/2.0 (+1) | 1,872 (-11%) | 2mo | $269,000 | $144 | 49 |
| 1126 Myrtle Ave | 0.64mi | 3/2.0 (+1) | 1,954 (-7%) | 6mo | $120,000 | $61 | 44 |
| 2111 Mclean Ave | 0.59mi | 3/2.0 (+1) | 1,846 (-12%) | 5mo | $225,000 | $122 | 39 |
| 2406 Beeler St | 0.64mi | 3/1.5 (+1) | 1,869 (-11%) | 9mo | $232,000 | $124 | 37 |
Match score weights: distance 35% · size 25% · config 20% · recency 20%. Top-matched comps best support the ARV.
Projected returns pro-forma
-3.0% appreciation · 7.24% rent growth · sell at horizon
- IRR
- -1.7%
- Equity multiple
- 0.93×
- Total profit
- $-3,501
- Equity at exit
- $27,733
- IRR
- 11.7%
- Equity multiple
- 2.09×
- Total profit
- $56,558
- Equity at exit
- $16,082
Cash invested: $52,080 (down + closing). Projections, not guarantees.
Landlord ↔ Tenant lean methodology
- Overall (STATE)
- 90 Strongly Landlord-Friendly
- State Indiana
- 90 Strongly Landlord-Friendly · R+11
- County
- — inherits STATE
- City
- — inherits STATE
ZIP-level market 47150
- Rents YoY
- 7.2%
- Active inventory
- 269
- Price-to-rent
- 8.6×
Monthly cashflow live
- Estimated rent
- $1,797 medium interval (Pro) →
- Mortgage (P&I)
- −$975
- Tax from tax record
- −$72 /mo · $869/yr
- Insurance
- −$78
- HOA
- −$0
- Vacancy / Maint / Mgmt
- −$377
- Net cashflow
- $294
Break-even live
Sensitivity live
| Price | -10% $399 | -5% $347 | +0% $294 | +5% $241 | +10% $189 |
|---|---|---|---|---|---|
| Rent | -10% $152 | -5% $223 | +0% $294 | +5% $365 | +10% $436 |
| Rate | -1.0pp $388 | -0.5pp $341 | base $294 | +0.5pp $246 | +1.0pp $197 |
UW: 25.0% down · 7.5% · 30yr · 1.5% tax · 5.0% vac · 8.0% maint · 8.0% mgmt
Financing live
Cash to close
- Down payment
- $46,500
- Closing costs
- $5,580
- Reserves months
- —
- Total cash needed
- —
Loan-product check · same deal, 3 products live
Conventional
25% down · 7.5% · 30yr
- Down + closing
- —
- Monthly P&I
- —
- Monthly cashflow
- —
- DSCR
- —
- Eligible?
- —
Personal DTI + credit; lowest rate.
DSCR
20% down · 8.5% · 30yr
- Down + closing
- —
- Monthly P&I
- —
- Monthly cashflow
- —
- DSCR
- —
- Eligible?
- —
No personal income docs; deal must DSCR.
Hard money
10% down · 12.0% · 12mo
- Down + closing
- —
- Monthly P&I
- —
- Monthly cashflow
- —
- DSCR
- —
- Eligible?
- —
Short-term bridge; refi at stabilization.
Rent comps 4 comps
| Address | Beds | Baths | Sqft | Rent | $/sqft | DOM | Units | Dist |
|---|---|---|---|---|---|---|---|---|
| 621 Thomas St New Albany, IN | 3.0 | 2.5 | 1510 | $2,300 | $1.52 | 17d | 1 | 0.26mi |
| 808 Vincennes St New Albany, IN | 2.0 | 1.5 | 1444 | $2,000 | $1.39 | 22d | 1 | 0.45mi |
| 807 E Main St New Albany, IN | 3.0 | 2.0 | 1500 | $1,650 | $1.10 | 20d | 1 | 0.93mi |
| 1429 Slate Run Rd New Albany, IN | 1.0–2.0 | 1.0–2.0 | 1200 | $1,365 | $1.14 | 15d | 4 | 1.24mi |
Listing history 18 events
-
2026-06-18days on market $186,000 Active 301 DOM
-
2026-06-17days on market $186,000 Active 300 DOM
-
2026-06-16days on market $186,000 Active 299 DOM
-
2026-06-15days on market $186,000 Active 298 DOM
-
2026-06-13days on market $186,000 Active 296 DOM
-
2026-06-10days on market $186,000 Active 293 DOM
-
2026-06-09days on market $186,000 Active 292 DOM
-
2026-06-08pricedays on market $186,000 Active 291 DOM
-
2026-06-03days on market $187,900 Active 290 DOM
-
2026-06-02days on market $187,900 Active 289 DOM
-
2026-06-01days on market $187,900 Active 288 DOM
-
2026-05-31days on market $187,900 Active 287 DOM
-
2026-02-23price $187,900
-
2026-02-17status Active
-
2026-02-16historical
-
2025-10-07price $199,900
-
2025-09-15price $209,000
-
2025-08-15$214,000 Active
ⓘ Source: listings_history table (triggers on properties + properties_extension) + one-shot
backfill from property_details.listing_events for pre-trigger history.
Tax reassessment forecast IN · Partial reset (capped growth)
- Current annual tax
- $869 · $72/mo
- Projected year-2 tax
- $1,225 · $102/mo
- Expected delta
- +$356/yr (+$30/mo · 40.9%)
ⓘ Screening estimate from a state-policy table — verify with the county assessor before closing.
Climate risk First Street
- Flood 1/10 Low FEMA zone X (unshaded) · 0% chance over 30 yrs
- Wildfire 1/10 Low
- Heat 5/10 Major 7 d/yr ≥105°F today · 20 d/yr by 30 yrs out
- Wind 2/10 Low 2% chance of damaging wind over 30 yrs
- Air quality 2/10 Low 1 unhealthy d/yr today · 2 by 30 yrs out
Nearby sold comps map
Loading sold comps map…
Walkable amenities ~0.75 mi
Loading nearby amenities…
Taxation est. · year 1
- Rental income
- $21,558
- − Mortgage interest
- −$10,419
- − Property taxes
- −$869
- − Insurance
- −$930
- − Repairs & maintenance
- −$1,725
- − Management
- −$1,725
- − Depreciation
- −$5,411
- Taxable income
- $480
- Est. tax owed @ 24.0%
- −$115
- After-tax cash flow
- $3,412/yr
For passive investors: Depreciation is non-cash, so a rental often shows a tax loss while cash-flowing — sheltering income. Rental losses are passive: they offset passive income freely, and up to $25,000/yr can offset ordinary (W-2) income if you actively participate and your MAGI is under $100k (phasing out to $0 by $150k); unused losses carry forward. On sale, claimed depreciation is recaptured at up to 25%, and gains may owe capital-gains tax (a 1031 exchange can defer both). Figures are a year-1 estimate at your 24.0% rate — not tax advice; consult a CPA.
Schools (NCES district)
- District
- New Albany-Floyd County Consolidated Schools
- NCES district ID
- 1807410
- Math proficiency
- 46% ▼ -4.00%
- Reading proficiency
- 50% ▼ -3.00%
- Median HH income
- $54,709
- Composite
- 41.57/100
- National rank
- #3441
- State rank
- #68 of 301 in IN
Livability — New Albany
- Score
- 73/100
- State rank
- #100
- US rank
- #5454
Category grades
Schools grade is shown separately in the Schools card above.
Census & demographics
- Census place
- New Albany, IN
- County
- Floyd County · 49,144 people
- City population
- 49,144
- Metro
- Louisville/Jefferson County, KY-IN
- Population (ZIP)
- 49,144
- Household income
- $62,820
- Rent vs Own
- Severe rent burden
- 1737.0
Population outlook (Floyd County) Hauer SSP2
- Today (2025)
- 82,092 people
- By 2030
- 84,384 · +2.8%
- By 2040
- 87,919 · +7.1%
- By 2050
- 89,958 · +9.6%
- By 2075
- 94,159 · +14.7%
- By 2100
- 91,907 · +12.0%
Race, ethnicity, and origin ACS 2023
- Neighborhood character
- Predominantly White (82%)
- Race & ethnicity
- White 82% Black 8% Two or more races 6% Hispanic / Latino 5% Asian 1%
- Common ancestry
- Italian 3% Slovak 2% Lithuanian 2%
- Foreign-born
- 3% · Canada
- Languages at home
- 96% English-only · Spanish 2% Other Asian/Pacific 1%
Political lean MEDSL · Floyd
- 2024 margin
- R (+15.5) · D 41.4% · R 56.9% · Other 1.7%
- 2008→2024 swing
- -5.4pp toward R · 2008: -10.1pp · 2024: -15.5pp
- All cycles
- 2024: R+15.5 2020: R+14.1 2016: R+20.1 2012: R+14.3 2008: R+10.1
Not yet ingested
- Civics
- —
Market trends
- HPI YoY
- ▼ -185.20%
- Current HPI
- 206.7738
- Rent YoY
- ▲ 7.24%
- Metro
- Louisville/Jefferson County, KY-IN
- State GDP YoY
- ▲ 2.90%
- F500 in state
- 18
Industry mix (Fortune 500 HQ in IN)
| Industry | F500 HQs | Revenue |
|---|---|---|
| Industrial Machinery | 2 | $37B |
|
||
| Healthcare | 1 | $177B |
|
||
| Pharmaceuticals | 1 | $45B |
|
||
| Metals / Steel | 1 | $18B |
|
||
| Agriculture | 1 | $17B |
|
||
| Packaging | 1 | $12B |
|
||
Price history
-12.2% since first listed6 events — show timeline
- 2026-02-23 Price Changed $187,900 SIRA
- 2026-02-17 Relisted — SIRA
- 2026-02-16 Delisted — SIRA
- 2025-10-07 Price Changed $199,900 SIRA
- 2025-09-15 Price Changed $209,000 SIRA
- 2025-08-15 Listed $214,000 SIRA
Property tax history
+10.8%/yrLatest (2024): $869 · +52.9% YoY. Source: county tax records.
Cash-flow waterfall
monthlySold comps — $/sqft
last 12 mo · ≤1 miLoading sold comps…