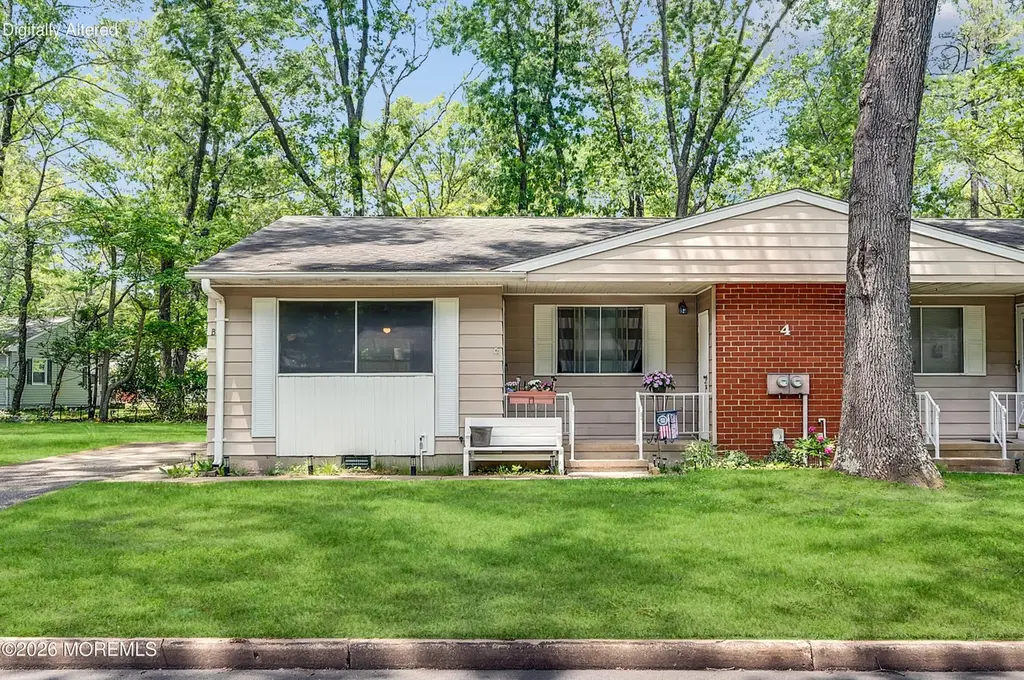
4 Indiana Way Unit B · Cedar Glen Lakes, NJ
Flood risk 1/10 · Minimal
- FEMA flood zone
- X (unshaded)
- Chance of flooding over 30 yrs
- 0.0%
- Est. flood insurance / yr
- $507 – $1,088
Fire risk 6/10 · Moderate
- Est. fire insurance / yr
- $526 – $976
Heat risk 6/10 · Moderate
- Hot days now (above 103°F)
- 7 days/yr
- Hot days in 30 yrs
- 14 days/yr
Wind risk 6/10 · Moderate
- Chance of severe wind over 30 yrs
- 67.0%
Air-quality risk 4/10 · Minor
- Unhealthy air days now
- 4 days/yr
- Unhealthy air days in 30 yrs
- 5 days/yr
Risk factors via First Street. Map © Google.
Why this score? — see what drove the C grade
The composite is a weighted blend of 9 inputs, each scored 0–100. Each bar is that input's sub-score; the figure is the points it added to the 100-point composite (weight × sub-score).
- Cash flow +28.0/30.0
- 1% rule +10.0/10.0
- DSCR +9.9/10.0
- Livability +3.2/5.0
- Schools +2.9/10.0
- Rent growth +2.5/5.0
- Condition / age +2.2/5.0
- ARV discount +0.0/15.0
- Appreciation +0.0/10.0
$129,000
🖨 Deal sheet 📄 Offer letter ✓ Due diligence
Listing remarks MLS
Come take a look and make an offer! House is empty and Move-in ready! This home is a Madison duplex located in an Active adult pet-friendly community with Clubhouse, planned activities, community bus to local malls, grocery stores, churches and more. Low HOA fee includes taxes, exterior maintenance, water and sewer it also covers lawn care, snow removal, trash pick up, hot water heater, front gutter and roof. This home features a large, just painted, living room (new carpet ordered),an updated eat in kitchen, 2 bedrooms, an updated bath and central air conditioning. Outside a private front porch with ramp and outdoor storage closet. The area has local shopping centers, banks, pharmacies and doctor's offices. Conveniently located off Routes 70 & 539. A perfect escape for your retirement!
Key facts
- Outdoor storage
- Hot water heater
- Single-level living
Tags
Property features AI
Finance
- HOA & community: HOA with monthly fee; Monthly association fee of $446; Association amenities include exercise room, clubhouse, community room, common area; no pool; HOA fee covers trash, common area maintenance, lawn maintenance, sewer, snow removal, and water
Exterior
- Parking: No garage
- Utilities: Public sewer
- Home design: Cooperative ownership; Model: Madison Basic
- Exterior features: Shingle roof
Interior
- Kitchen: Includes dishwasher, microwave, stove, refrigerator
- Bedrooms: 2 bedrooms
- Flooring: Linoleum; Ceramic tile
- Bathrooms: 1 full bathroom
- Heating & cooling: Electric baseboard heating; Central air conditioning
- Interior features: Washer, Dryer, Dishwasher, Microwave, Stove, Refrigerator; Crawl space basement
- Laundry & utility: Washer and dryer included
Neighborhood map
What this means for you Summary
Snapshot
- This is a 2-bed/1.0-bath single-family listed at $129k. Condition is rated fair.
Deal economics
- At list price, monthly cash flow is $401 ($5k/yr) — positive.
- The deal already cash-flows at list — no discount required.
- Meets the 1% rule at list price ($2k rent vs $129k).
- Recommended offer: $127k (1.5% below list) — sets the bar for market timing.
Location & tenants
- Location reads 64/100 on livability (#406 in NJ) — a middle-class / working-renter tenant base. Strengths: crime A+, cost of living A+, housing A+; Watch: schools F, amenities F, commute F.
- Manchester Township School District (suburban): math 25% / reading 44% proficiency, ranked #320 of 472 in NJ (top 68%) — families likely to look elsewhere, expect single-tenant / working-renter base with shorter leases.
- Market conditions: 648 active listings in the ZIP; 1 comparable units currently listed for rent nearby; 4,434 units permitted in Ocean County in 2024 (868 in 5+ unit buildings).
Forward outlook
- Local home prices are declining (-3.0%/yr); year-one equity from $892 of loan paydown is wiped out by about $4k of value loss. Plan a longer hold.
- Ocean County population projected to shrink 8% by 2050 — rents likely to lag national; underwrite the cash flow, not the appreciation.
- At projected returns (-3.0% appreciation + 3.0% rent growth), your $36k cash investment doubles in ~9 years — after that, you're playing with house money.
Negotiation context
- It's been on market 17 days — a 2% lower offer ($127k) is reasonable based on typical stale-listing flexibility.
- 2 sale attempts since 6y ago with the ask held roughly flat each time — persistent listings suggest the price (not the market) is what's stuck; bring a comps-based counter.
- Current owner paid $60k; list at $129k implies a 115% gain — meaningful room to come down on a strong offer.
Risks & watch-outs
- Watch-outs: HOA is 20% of rent.
- Climate carrying-cost: major wind risk, 67% chance of damaging wind over 30y; major wildfire risk; extreme-heat days projected 7→14/yr by 2055 (HVAC capex compounding) — expect insurance premiums to compound above CPI over the hold.
Questions for the listing agent
- Have any recent inspections been done? Can we get a copy of the seller's disclosures and any deferred-maintenance estimates?
- Built in 1970 — when were the roof, HVAC, electrical panel, plumbing, and water heater last replaced?
- What does the HOA fee cover, when was the last increase, and are there any pending special assessments or reserve-fund shortfalls?
- Is there a deadline driving the sale (1031 exchange, divorce, estate, relocation)? That informs how much negotiation room exists.
- Schools are F-rated, which usually means shorter tenancies and higher turnover. Who's the typical renter profile here, and what's been the actual vacancy rate?
- What's the average days-on-market for RENTAL listings here right now (not sales)? A rising rental-DOM trend means longer vacancies and softer asking-rent achievability than the comps imply.
- What's the recent tenant-quality profile in this submarket — average credit score on applications, eviction rate, late-payment / NSF rate, and stable-employment percentage? A property-management company in the area should have these aggregated.
- How much new for-sale + rental construction is in the pipeline within 1–3 miles? Heavy new supply typically softens prices + rents 12–24 months out; constrained supply supports both.
Investment metrics
- 1% rule
- 1.71% ✓
- Cap rate
- 10.02%
- Cash-on-cash
- 13.31%
- DSCR
- 1.59
- GRM
- 4.9
CMA / ARV
- ARV (on-the-fly)
- $91,600
- Comps found
- 9
Show comp detail 9 sales within ~0.75 mi
| Address | Dist | Beds/Ba | Sqft | Sold | Price | $/sf | Match |
|---|---|---|---|---|---|---|---|
| 14 Roosevelt City Rd Unit B | 0.09mi | 1/1.0 (-1) | 1,000 (+9%) | 7mo | $94,500 | $95 | 69 |
| 10 B Virginia Dr | 0.25mi | 1/1.0 (-1) | 1,000 (+9%) | 5mo | $57,500 | $58 | 64 |
| 21 Maryland Ave Unit B | 0.31mi | 2/1.0 | 1,000 (+9%) | 10mo | $92,500 | $93 | 62 |
| 29A Maine Ave | 0.29mi | 2/1.0 | 1,000 (+9%) | 13mo | $100,000 | $100 | 61 |
| 5 Ohio Dr Unit B | 0.41mi | 2/1.0 | 1,000 (+9%) | 8mo | $130,000 | $130 | 59 |
| 6 S South Carolina Way | 0.29mi | 2/1.0 | 1,000 (+9%) | 18mo | $145,000 | $145 | 56 |
| 59 Maryland Ave Unit B | 0.45mi | 2/1.0 | 1,000 (+9%) | 12mo | $135,000 | $135 | 54 |
| 29 Arizona Ave Unit B | 0.58mi | 1/1.0 (-1) | 1,000 (+9%) | 2mo | $86,500 | $87 | 51 |
| 35 Arizona Ave | 0.61mi | 2/1.0 | 1,000 (+9%) | 16mo | $169,000 | $169 | 43 |
Match score weights: distance 35% · size 25% · config 20% · recency 20%. Top-matched comps best support the ARV.
Projected returns pro-forma
-3.0% appreciation · 3.0% rent growth · sell at horizon
- IRR
- 3.5%
- Equity multiple
- 1.14×
- Total profit
- $4,912
- Equity at exit
- $19,234
- IRR
- 13.2%
- Equity multiple
- 2.06×
- Total profit
- $38,373
- Equity at exit
- $11,154
Cash invested: $36,120 (down + closing). Projections, not guarantees.
Landlord ↔ Tenant lean methodology
- Overall (STATE)
- 21 Tenant-Leaning
- State New Jersey
- 21 Tenant-Leaning · D+6
- County
- — inherits STATE
- City
- — inherits STATE
ZIP-level market 08759
- Active inventory
- 648
- Price-to-rent
- 4.9×
Monthly cashflow live
- Estimated rent
- $2,200 medium interval (Pro) →
- Mortgage (P&I)
- −$676
- Tax est. 1.5%
- −$161 /mo · $1,935/yr
- Insurance
- −$54
- HOA
- −$446
- Vacancy / Maint / Mgmt
- −$462
- Net cashflow
- $401
Break-even live
UW: 25.0% down · 7.5% · 30yr · 1.5% tax · 5.0% vac · 8.0% maint · 8.0% mgmt
Financing live
Cash to close
- Down payment
- $32,250
- Closing costs
- $3,870
- Reserves months
- —
- Total cash needed
- —
Loan-product check · same deal, 3 products live
Conventional
25% down · 7.5% · 30yr
- Down + closing
- —
- Monthly P&I
- —
- Monthly cashflow
- —
- DSCR
- —
- Eligible?
- —
Personal DTI + credit; lowest rate.
DSCR
20% down · 8.5% · 30yr
- Down + closing
- —
- Monthly P&I
- —
- Monthly cashflow
- —
- DSCR
- —
- Eligible?
- —
No personal income docs; deal must DSCR.
Hard money
10% down · 12.0% · 12mo
- Down + closing
- —
- Monthly P&I
- —
- Monthly cashflow
- —
- DSCR
- —
- Eligible?
- —
Short-term bridge; refi at stabilization.
Rent comps 1 comps
| Address | Beds | Baths | Sqft | Rent | $/sqft | DOM | Units | Dist |
|---|---|---|---|---|---|---|---|---|
| 50 Westport Dr #71 Whiting, NJ | 2.0 | 1.0 | 1120 | $2,200 | $1.96 | 1d | 1 | 1.32mi |
HOA detail
- Monthly dues
- $446 · $5,352/yr
- Likely covers
- watersewertrashlandscapingsnow removalexterior maint.
Listing history 12 events
-
2026-06-18days on market $129,000 Active 17 DOM
-
2026-06-17days on market $129,000 Active 16 DOM
-
2026-06-16days on market $129,000 Active 15 DOM
-
2026-06-15days on market $129,000 Active 14 DOM
-
2026-06-13days on market $129,000 Active 12 DOM
-
2026-06-09days on market $129,000 Active 8 DOM
-
2026-06-08days on market $129,000 Active 7 DOM
-
2026-06-07days on market $129,000 Active 6 DOM
-
2026-06-04days on market $129,000 Active 3 DOM
-
2026-06-03days on market $129,000 Active 2 DOM
-
2026-06-02remarks 699-char remark
-
2026-06-02$129,000 Active 1 DOM
ⓘ Source: listings_history table (triggers on properties + properties_extension) + one-shot
backfill from property_details.listing_events for pre-trigger history.
Climate risk First Street
- Flood 1/10 Low FEMA zone X (unshaded) · 0% chance over 30 yrs
- Wildfire 6/10 Major
- Heat 6/10 Major 7 d/yr ≥103°F today · 14 d/yr by 30 yrs out
- Wind 6/10 Major 67% chance of damaging wind over 30 yrs
- Air quality 4/10 Moderate 4 unhealthy d/yr today · 5 by 30 yrs out
Nearby sold comps map
Loading sold comps map…
Walkable amenities ~0.75 mi
Loading nearby amenities…
Taxation est. · year 1
- Rental income
- $26,400
- − Mortgage interest
- −$7,226
- − Property taxes
- −$1,935
- − Insurance
- −$645
- − Repairs & maintenance
- −$2,112
- − Management
- −$2,112
- − HOA
- −$5,352
- − Depreciation
- −$3,753
- Taxable income
- $3,265
- Est. tax owed @ 24.0%
- −$784
- After-tax cash flow
- $4,022/yr
For passive investors: Depreciation is non-cash, so a rental often shows a tax loss while cash-flowing — sheltering income. Rental losses are passive: they offset passive income freely, and up to $25,000/yr can offset ordinary (W-2) income if you actively participate and your MAGI is under $100k (phasing out to $0 by $150k); unused losses carry forward. On sale, claimed depreciation is recaptured at up to 25%, and gains may owe capital-gains tax (a 1031 exchange can defer both). Figures are a year-1 estimate at your 24.0% rate — not tax advice; consult a CPA.
Condition & rehab AI · 12 photos
This home requires moderate repairs and updates to improve its condition and value. The kitchen and bathroom need updates, and the exterior siding requires repair. Fresh paint and new cabinets would significantly enhance its appeal.
Repairs flagged
- Moderate kitchen cabinets — outdated and worn
- Moderate bathroom fixtures — outdated and worn
- Moderate exterior siding — worn and in need of repainting
Value-add opportunities
- Resale paint interior walls — fresh paint enhances curb appeal
- Resale replace kitchen cabinets — new cabinets improve functionality and aesthetics
- Resale repair exterior siding — new siding improves curb appeal and durability
Renovation cost estimate screening
| Repair item | Severity | Est. cost |
|---|---|---|
| kitchen cabinets · outdated and worn | Moderate | $3,000–15,000 |
| bathroom fixtures · outdated and worn | Moderate | $3,000–15,000 |
| exterior siding · worn and in need of repainting | Moderate | $3,000–15,000 |
| Total estimated repair cost · 3 items | $9,000–45,000 |
Value-add ROI direction
- Resale paint interior walls — fresh paint enhances curb appeal ↑
- Resale replace kitchen cabinets — new cabinets improve functionality and aesthetics ↑
- Resale repair exterior siding — new siding improves curb appeal and durability ↑
ⓘ Cost ranges are severity-bucket heuristics (US national rule-of-thumb). Get contractor quotes + a written scope before underwriting a rehab budget.
Schools (NCES district)
- District
- Manchester Township School District
- NCES district ID
- 3409450
- Math proficiency
- 25% ▼ -17.00%
- Reading proficiency
- 44% ▼ -5.00%
- Median HH income
- $38,905
- Composite
- 28.8/100
- National rank
- #6662
- State rank
- #320 of 472 in NJ
Livability — Cedar Glen Lakes
- Score
- 64/100
- State rank
- #406
- US rank
- #14186
Category grades
Schools grade is shown separately in the Schools card above.
Census & demographics
- Census place
- Cedar Glen Lakes, NJ
- Population (ZIP)
- 34,290
Population outlook (Ocean County) Hauer SSP2
- Today (2025)
- 586,991 people
- By 2030
- 581,403 · -1.0%
- By 2040
- 564,913 · -3.8%
- By 2050
- 538,149 · -8.3%
- By 2075
- 468,845 · -20.1%
- By 2100
- 350,297 · -40.3%
Race, ethnicity, and origin ACS 2023
- Neighborhood character
- Predominantly White (87%)
- Race & ethnicity
- White 87% Hispanic / Latino 5% Black 4% Two or more races 4% Asian 2%
- Hispanic origin (detail)
- Puerto Rican 2%
- Common ancestry
- Romanian 8% Scotch-Irish 2% Lithuanian 2%
- Foreign-born
- 11% · Canada, China
- Languages at home
- 88% English-only · Spanish 3% Russian/Polish/Slavic 2% Other Indo-European 2%
Political lean MEDSL · Ocean
- 2024 margin
- Solid R (+36.0) · D 31.4% · R 67.4% · Other 1.2%
- 2008→2024 swing
- -17.6pp toward R · 2008: -18.4pp · 2024: -36.0pp
- All cycles
- 2024: R+36.0 2020: R+28.7 2016: R+34.0 2012: R+17.7 2008: R+18.4
Not yet ingested
- Civics
- —
Market trends
- HPI YoY
- ▼ -347.85%
- Current HPI
- 274.4679
- Rent YoY
- —
- Metro
- —
- State GDP YoY
- ▲ 2.05%
- F500 in state
- 34
Industry mix (Fortune 500 HQ in NJ)
| Industry | F500 HQs | Revenue |
|---|---|---|
| Consumer Goods | 3 | $31B |
|
||
| Pharmaceuticals | 2 | $153B |
|
||
| Technology | 2 | $21B |
|
||
| Insurance | 2 | $20B |
|
||
| Healthcare | 2 | $19B |
|
||
| Financial Services | 1 | $70B |
|
||
Price history
+115.0% since first listed4 events — show timeline
- 2026-06-01 Listed $129,000 MOMLS
- 2020-11-03 Sold (MLS) $60,000 MOMLS
- 2020-10-13 Pending — MOMLS
- 2020-09-14 Listed $60,000 MOMLS
Cash-flow waterfall
monthlySold comps — $/sqft
last 12 mo · ≤1 miLoading sold comps…