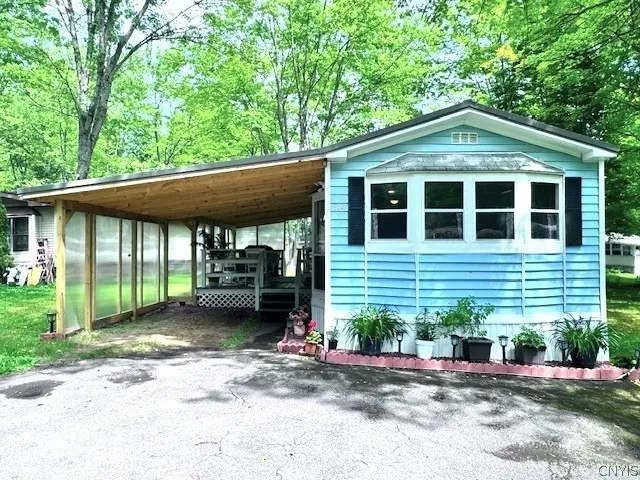
254 Blossom Ln · Utica, NY
Flood risk 1/10 · Minimal
- FEMA flood zone
- X
- Chance of flooding over 30 yrs
- 0.0%
- Est. flood insurance / yr
- $507 – $1,088
Fire risk 3/10 · Minor
- Est. fire insurance / yr
- $691 – $1,283
Heat risk 2/10 · Minimal
- Hot days now (above 96°F)
- 7 days/yr
- Hot days in 30 yrs
- 16 days/yr
Wind risk 2/10 · Minimal
- Chance of severe wind over 30 yrs
- 1.0%
Air-quality risk 2/10 · Minimal
- Unhealthy air days now
- 0 days/yr
- Unhealthy air days in 30 yrs
- 1 days/yr
Risk factors via First Street. Map © Google.
Why this score? — see what drove the B grade
The composite is a weighted blend of 9 inputs, each scored 0–100. Each bar is that input's sub-score; the figure is the points it added to the 100-point composite (weight × sub-score).
- Cash flow +30.0/30.0
- 1% rule +10.0/10.0
- DSCR +10.0/10.0
- ARV discount +7.5/15.0
- Schools +5.6/10.0
- Livability +4.0/5.0
- Rent growth +2.5/5.0
- Condition / age +2.5/5.0
- Appreciation +0.0/10.0
$69,900
🖨 Deal sheet (PDF) 📄 Offer letter ✓ Due diligence
Listing remarks MLS
Looking for convenient one level living. .. located in popular Strawberry Hills is this Pristine Clean Affordable 2 bedroom home. Updates to include brand new (gutted) bath with laundry hookups, new stainless steel refrigerator & gas stove, new hot water tank, all new laminate & carpeting flooring, new lighting & fan fixtures, added insulation in wall, ceiling & floors, all new pex plumbing, new subflooring, new ceiling in hall, bathroom & bedrooms, new interior door & exterior doors, new skirting around the home, Also features Central Air & includes a shed. Park approval required. Lot rent is $525 per month which includes trash pickup. See pics & disclosure for more details of the many features & benefits this home has to offer.
Key facts
- Large deck
- Parking
- Built 1984
Tags
Property features AI
Finance
- Other: Irregular residential lot; City street frontage; Manufactured by Zimmer Homes
- HOA & community: Land lease: $525
Exterior
- Parking: Carport; Driveway
- Utilities: Public water (connected); Sewer connected; Cable available; Circuit breaker electric
- Home design: Single-wide mobile home; Single-story; Existing (pre-owned) condition
- Construction: Vinyl siding; PEX plumbing; Metal roof
- Exterior features: Deck; Blacktop driveway; Shed(s)/storage
Interior
- Kitchen: Gas oven; Gas range; Range hood; Refrigerator; Exhaust fan
- Bedrooms: 2 main-level bedrooms
- Flooring: Carpet; Laminate; Varied flooring
- Bathrooms: 1 full bathroom (main level)
- Heating & cooling: Gas forced-air heating; Central air conditioning
- Interior features: Breakfast bar; Ceiling fan(s); Eat-in kitchen; Separate/formal living room; Bath in primary bedroom; Main level primary
- Laundry & utility: Washer; Dryer; Main-level laundry; Electric water heater
Neighborhood map
What this means for you Summary
Snapshot
- This is a 2-bed/1.0-bath manufactured listed at $70k.
Deal economics
- At list price, monthly cash flow is $616 ($7k/yr) — positive.
- The deal already cash-flows at list — no discount required.
- Meets the 1% rule at list price ($1k rent vs $70k).
- Cap rate 16.9% vs local median 7.8% in Utica — top-decile yield for the area; either an underpriced asset or a hidden risk that comps aren't pricing in. Stress-test before assuming the spread holds.
Location & tenants
- Location reads 80/100 on livability (#104 in NY, #1,589 nationally) — a professional / high-income tenant draw. Strengths: commute A+, cost of living A+, housing A+; Watch: employment D, crime F.
- Whitesboro Central School District (suburban): math 68% / reading 61% proficiency, ranked #174 of 590 in NY (top 30%) — acceptable for families but not a draw, mixed tenant base, ~2y average lease.
- Zoned schools: Deerfield Elementary School (math 72% / reading 57%, grade B, #591 of 2,108 statewide, top 31%, 318 students, 35% FRL); Whitesboro Middle School (math 58% / reading 62%, grade B, #157 of 729 statewide, top 22%, 474 students, 40% FRL); Whitesboro High School (math 94%, 938 students, 34% FRL).
- Market conditions: 150 active listings in the ZIP; 54 units permitted in Herkimer County in 2024 (0 in 5+ unit buildings).
Forward outlook
- Local home prices are declining (-3.0%/yr); year-one equity from $483 of loan paydown is wiped out by about $2k of value loss. Plan a longer hold.
- Herkimer County population projected at -24% by 2050 — secular population decline; favor cash flow + early exit over multi-decade hold.
- At projected returns (-3.0% appreciation + 3.0% rent growth), your $20k cash investment doubles in ~4 years — after that, you're playing with house money.
Negotiation context
- Only 9 days on market — expect competitive offers; lowballing is unlikely to land.
- 2 sale attempts since 2y ago with the ask held roughly flat each time — persistent listings suggest the price (not the market) is what's stuck; bring a comps-based counter.
- Current owner paid $37k; list at $70k implies a 89% gain — meaningful room to come down on a strong offer.
Questions for the listing agent
- Is there a deadline driving the sale (1031 exchange, divorce, estate, relocation)? That informs how much negotiation room exists.
- Schools are D-rated, which usually means shorter tenancies and higher turnover. Who's the typical renter profile here, and what's been the actual vacancy rate?
- Crime grade is F in this area — have there been break-ins, vandalism, or insurance claims at this property in the last 3 years? What carrier currently insures it and at what premium?
- What's the average days-on-market for RENTAL listings here right now (not sales)? A rising rental-DOM trend means longer vacancies and softer asking-rent achievability than the comps imply.
- What's the recent tenant-quality profile in this submarket — average credit score on applications, eviction rate, late-payment / NSF rate, and stable-employment percentage? A property-management company in the area should have these aggregated.
- How much new for-sale + rental construction is in the pipeline within 1–3 miles? Heavy new supply typically softens prices + rents 12–24 months out; constrained supply supports both.
Investment metrics
- 1% rule
- 1.99% ✓
- Cap rate
- 16.87%
- Cash-on-cash
- 37.79%
- DSCR
- 2.68
- GRM
- 4.2
CMA / ARV
- ARV (on-the-fly)
- $37,310
- Comps found
- 8
Show comp detail 8 sales within ~0.75 mi
| Address | Dist | Beds/Ba | Sqft | Sold | Price | $/sf | Match |
|---|---|---|---|---|---|---|---|
| 254 Blossom Ln | 0.00mi | 2/1.0 | 910 (0%) | 13mo | $37,000 | $41 | 89 |
| 170 Concord Dr | 0.18mi | 2/2.0 | 900 (-1%) | 4mo | $35,000 | $39 | 82 |
| 153 Rodeo Dr | 0.25mi | 2/1.0 | 800 (-12%) | 7mo | $20,000 | $25 | 63 |
| 608 Kilkenny Dr | 0.46mi | 3/1.0 (+1) | 853 (-6%) | 2mo | $64,400 | $75 | 61 |
| 149 Country Rd | 0.13mi | 3/1.0 (+1) | 980 (+8%) | 19mo | $25,000 | $26 | 60 |
| 635 Kilkenny Dr | 0.49mi | 3/1.0 (+1) | 853 (-6%) | 4mo | $65,000 | $76 | 59 |
| 422 Donegal Dr | 0.48mi | 2/2.0 | 1,008 (+11%) | 8mo | $15,000 | $15 | 49 |
| 135 Concord Dr | 0.29mi | 3/1.0 (+1) | 813 (-11%) | 24mo | $49,000 | $60 | 44 |
Match score weights: distance 35% · size 25% · config 20% · recency 20%. Top-matched comps best support the ARV.
Projected returns pro-forma
-3.0% appreciation · 3.0% rent growth · sell at horizon
- IRR
- 33.8%
- Equity multiple
- 2.43×
- Total profit
- $27,945
- Equity at exit
- $10,422
- IRR
- 40.7%
- Equity multiple
- 4.83×
- Total profit
- $74,961
- Equity at exit
- $6,044
Cash invested: $19,572 (down + closing). Projections, not guarantees.
Landlord ↔ Tenant lean methodology
- Overall (STATE)
- 15 Strongly Tenant-Friendly
- State New York
- 15 Strongly Tenant-Friendly · D+10
- County
- — inherits STATE
- City
- — inherits STATE
ZIP-level market 13502
- Home prices YoY
- -12.1%
- Active inventory
- 150
- Price-to-rent
- 4.2×
Monthly cashflow live
- Estimated rent
- $1,392 medium interval (Pro) →
- Mortgage (P&I)
- −$367
- Tax est. 1.5%
- −$87 /mo · $1,048/yr
- Insurance
- −$29
- HOA
- −$0
- Vacancy / Maint / Mgmt
- −$292
- Net cashflow
- $616
Break-even live
Sensitivity live
| Price | -10% $665 | -5% $640 | +0% $616 | +5% $592 | +10% $568 |
|---|---|---|---|---|---|
| Rent | -10% $506 | -5% $561 | +0% $616 | +5% $671 | +10% $726 |
| Rate | -1.0pp $651 | -0.5pp $634 | base $616 | +0.5pp $598 | +1.0pp $580 |
UW: 25.0% down · 7.5% · 30yr · 1.5% tax · 5.0% vac · 8.0% maint · 8.0% mgmt
Financing live
Cash to close
- Down payment
- $17,475
- Closing costs
- $2,097
- Reserves months
- —
- Total cash needed
- —
Loan-product check · same deal, 3 products live
Conventional
25% down · 7.5% · 30yr
- Down + closing
- —
- Monthly P&I
- —
- Monthly cashflow
- —
- DSCR
- —
- Eligible?
- —
Personal DTI + credit; lowest rate.
DSCR
20% down · 8.5% · 30yr
- Down + closing
- —
- Monthly P&I
- —
- Monthly cashflow
- —
- DSCR
- —
- Eligible?
- —
No personal income docs; deal must DSCR.
Hard money
10% down · 12.0% · 12mo
- Down + closing
- —
- Monthly P&I
- —
- Monthly cashflow
- —
- DSCR
- —
- Eligible?
- —
Short-term bridge; refi at stabilization.
Listing history 8 events
-
2026-06-22days on market $69,900 Active 9 DOM
-
2026-06-19days on market $69,900 Active 7 DOM
-
2026-06-18days on market $69,900 Active 6 DOM
-
2026-06-17days on market $69,900 Active 5 DOM
-
2026-06-16days on market $69,900 Active 4 DOM
-
2026-06-15days on market $69,900 Active 3 DOM
-
2026-06-13remarks 679-char remark
-
2026-06-13$69,900 Active 1 DOM
ⓘ Source: listings_history table (triggers on properties + properties_extension) + one-shot
backfill from property_details.listing_events for pre-trigger history.
Climate risk First Street
- Flood 1/10 Low FEMA zone X · 0% chance over 30 yrs
- Wildfire 3/10 Moderate
- Heat 2/10 Low 7 d/yr ≥96°F today · 16 d/yr by 30 yrs out
- Wind 2/10 Low 100% chance of damaging wind over 30 yrs
- Air quality 2/10 Low 0 unhealthy d/yr today · 1 by 30 yrs out
Nearby sold comps map
Loading sold comps map…
Walkable amenities ~0.75 mi
Loading nearby amenities…
Taxation est. · year 1
- Rental income
- $16,699
- − Mortgage interest
- −$3,915
- − Property taxes
- −$1,048
- − Insurance
- −$350
- − Repairs & maintenance
- −$1,336
- − Management
- −$1,336
- − Depreciation
- −$2,033
- Taxable income
- $6,680
- Est. tax owed @ 24.0%
- −$1,603
- After-tax cash flow
- $5,792/yr
For passive investors: Depreciation is non-cash, so a rental often shows a tax loss while cash-flowing — sheltering income. Rental losses are passive: they offset passive income freely, and up to $25,000/yr can offset ordinary (W-2) income if you actively participate and your MAGI is under $100k (phasing out to $0 by $150k); unused losses carry forward. On sale, claimed depreciation is recaptured at up to 25%, and gains may owe capital-gains tax (a 1031 exchange can defer both). Figures are a year-1 estimate at your 24.0% rate — not tax advice; consult a CPA.
Schools (NCES district)
- District
- Whitesboro Central School District
- NCES district ID
- 3631320
- Math proficiency
- 68% ▼ -7.00%
- Reading proficiency
- 61% ▼ -2.00%
- Median HH income
- $59,732
- Composite
- 55.77/100
- National rank
- #1217
- State rank
- #174 of 590 in NY
Livability — Utica
- Score
- 80/100
- State rank
- #104
- US rank
- #1589
Category grades
Schools grade is shown separately in the Schools card above.
Census & demographics
- County
- Oneida County · 89,710 people
- City population
- 72,968
- Metro
- Utica-Rome, NY
- Population (ZIP)
- 34,037
- Household income
- $57,835
- Rent vs Own
- Severe rent burden
- 1604.0
Population outlook (Herkimer County) Hauer SSP2
- Today (2025)
- 59,340 people
- By 2030
- 56,838 · -4.2%
- By 2040
- 51,098 · -13.9%
- By 2050
- 45,080 · -24.0%
- By 2075
- 32,648 · -45.0%
- By 2100
- 22,266 · -62.5%
Race, ethnicity, and origin ACS 2023
- Neighborhood character
- Predominantly White (71%)
- Race & ethnicity
- White 71% Hispanic / Latino 11% Black 9% Two or more races 7% Asian 5%
- Hispanic origin (detail)
- Mexican 2% Puerto Rican 5% Dominican 2%
- Common ancestry
- Romanian 11% Lithuanian 3% American 2%
- Foreign-born
- 12% · Canada, Philippines, China
- Languages at home
- 81% English-only · Spanish 7% Russian/Polish/Slavic 4% Other Asian/Pacific 3%
Political lean MEDSL · Herkimer
- 2024 margin
- Solid R (+36.4) · D 31.8% · R 68.2%
- 2008→2024 swing
- -27.1pp toward R · 2008: -9.3pp · 2024: -36.4pp
- All cycles
- 2024: R+36.4 2020: R+30.5 2016: R+34.5 2012: R+8.4 2008: R+9.3
Not yet ingested
- Civics
- —
Market trends
- HPI YoY
- ▼ -50.76%
- Current HPI
- 368.3955
- Rent YoY
- —
- Metro
- Utica-Rome, NY
- State GDP YoY
- ▲ 2.60%
- F500 in state
- 92
Industry mix (Fortune 500 HQ in NY)
| Industry | F500 HQs | Revenue |
|---|---|---|
| Financial Services | 10 | $950B |
|
||
| Consumer Goods | 9 | $162B |
|
||
| Insurance | 4 | $225B |
|
||
| Telecommunications | 2 | $144B |
|
||
| Pharmaceuticals | 2 | $112B |
|
||
| Media / Entertainment | 2 | $69B |
|
||
Price history
+40.1% since first listed6 events — show timeline
- 2026-06-12 Listed $69,900 CNYIS
- 2025-05-21 Pending — CNYIS
- 2025-05-21 Sold (MLS) $37,000 CNYIS
- 2025-04-04 Price Changed $39,000 CNYIS
- 2025-01-16 Price Changed $42,900 CNYIS
- 2024-12-11 Listed $49,900 CNYIS
Cash-flow waterfall
monthlySold comps — $/sqft
last 12 mo · ≤1 miLoading sold comps…