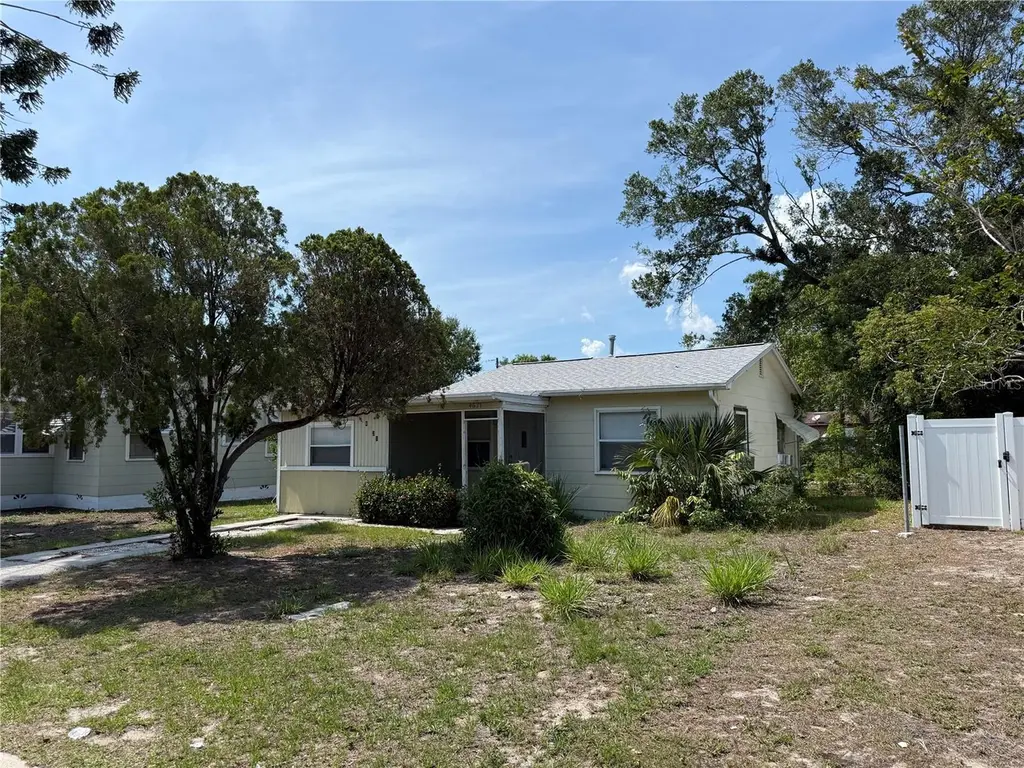
4621 17th Ave S · St. Petersburg, FL
Flood risk 1/10 · Minimal
- FEMA flood zone
- X (unshaded)
- Chance of flooding over 30 yrs
- 0.0%
- Est. flood insurance / yr
- $507 – $1,088
Fire risk 1/10 · Minimal
- Est. fire insurance / yr
- $947 – $1,759
Heat risk 10/10 · Severe
- Hot days now (above 106°F)
- 7 days/yr
- Hot days in 30 yrs
- 26 days/yr
Wind risk 10/10 · Severe
- Chance of severe wind over 30 yrs
- 99.0%
Air-quality risk 4/10 · Minor
- Unhealthy air days now
- 4 days/yr
- Unhealthy air days in 30 yrs
- 4 days/yr
Risk factors via First Street. Map © Google.
Why this score? — see what drove the C+ grade
The composite is a weighted blend of 9 inputs, each scored 0–100. Each bar is that input's sub-score; the figure is the points it added to the 100-point composite (weight × sub-score).
- Cash flow +23.0/30.0
- ARV discount +15.0/15.0
- DSCR +7.4/10.0
- 1% rule +5.5/10.0
- Schools +4.3/10.0
- Livability +2.5/5.0
- Condition / age +2.5/5.0
- Rent growth +2.1/5.0
- Appreciation +0.0/10.0
$199,900
🖨 Deal sheet 📄 Offer letter ✓ Due diligence
Listing remarks MLS
Great Single Family Home in the Heart of Saint Petersburg. Spacious Lot! Needs Some TLC, But Has Tons of Potential!
Key facts
- Ample outdoor space
- Income-producing use
- Huge lot
Tags
Property features AI
Finance
- Other: Property type: Residential — Single Family Residence; Lot approximately 0.15 acres (50 x 131); Living area reported as 759 sq ft; building area 863 sq ft
- Financial info: Lease restrictions apply
- HOA & community: No association
Exterior
- Utilities: Public water available; No water source listed; Public sewer; Cable available; Electricity connected; Sewer connected; Water connected
- Home design: Single family residence; One story; Southeast facing; Entry level: One
- Construction: Frame and other construction materials; Shingle roof; Slab foundation (and other foundation types)
- Exterior features: Other exterior features; Concrete road access
Interior
- Kitchen: Cooktop; Range; Range hood; Refrigerator; Electric water heater
- Bedrooms: 2 bedrooms (both on main level)
- Bathrooms: 1 full bathroom
- Heating & cooling: Other heating; Wall/window unit(s) for cooling
- Interior features: Ceiling fans; Living room / dining room combo; Open floorplan; Other interior features
- Laundry & utility: Laundry: Other configuration
Neighborhood map
What this means for you Summary
Snapshot
- This is a 2-bed/1.0-bath single-family listed at $200k.
Deal economics
- At list price, monthly cash flow is $353 ($4k/yr) — positive.
- The deal already cash-flows at list — no discount required.
- Meets the 1% rule at list price ($2k rent vs $200k).
- Recommended offer: $197k (1.5% below list) — sets the bar for market timing.
- Cap rate 8.4% vs local median 2.6% in St. Petersburg — top-decile yield for the area; either an underpriced asset or a hidden risk that comps aren't pricing in. Stress-test before assuming the spread holds.
Location & tenants
- Location reads: area grade C — affects rentability + tenant quality, not the cash-flow math above.
- Pinellas (suburban): math 51% / reading 51% proficiency, ranked #31 of 73 in FL (top 42%) — acceptable for families but not a draw, mixed tenant base, ~2y average lease.
- Zoned schools: Gulfport Montessori Elementary School (math 35% / reading 33%, grade F, #1,744 of 2,144 statewide, top 82%, 435 students, 86% FRL); Boca Ciega High School (math 24% / reading 33%, grade F, #458 of 667 statewide, top 69%, 1,423 students, 64% FRL) — zoned schools average 75% FRL vs 48% district-wide (27 pts higher); higher-poverty schools than district average — tighter screening recommended.
- Zoned-school proficiency averages 31% at this address vs 51% district-wide (-20 pts) — the specific schools serving this property underperform the Pinellas average; the district grade overstates school quality for this exact location.
- Market conditions: Rents soft (-1.5%/yr); 261 active listings in the ZIP; 40 comparable units currently listed for rent nearby; rentals leasing fast (median 11d on market — plan ~1-2 weeks tenant-placement turnaround); 2,676 units permitted in Pinellas County in 2024 (1,422 in 5+ unit buildings).
Forward outlook
- Local home prices are declining (-3.0%/yr); year-one equity from $1k of loan paydown is wiped out by about $6k of value loss. Plan a longer hold.
- Pinellas County population projected at +14% by 2050 — modest demand growth; plan on rents tracking national, not racing it.
Negotiation context
- It's been on market 27 days — a 2% lower offer ($197k) is reasonable based on typical stale-listing flexibility.
- 3 sale attempts since 7y ago with the ask held roughly flat each time — persistent listings suggest the price (not the market) is what's stuck; bring a comps-based counter.
- Current owner paid $54k; list at $200k implies a 270% gain — meaningful room to come down on a strong offer.
Risks & watch-outs
- Watch-outs: built in 1954 — expect roof / HVAC / electrical / plumbing capex.
- Climate carrying-cost: severe wind risk, 99% chance of damaging wind over 30y; extreme-heat days projected 7→26/yr by 2055 (HVAC capex compounding) — expect insurance premiums to compound above CPI over the hold.
Questions for the listing agent
- Built in 1954 — when were the roof, HVAC, electrical panel, plumbing, and water heater last replaced?
- Is there a deadline driving the sale (1031 exchange, divorce, estate, relocation)? That informs how much negotiation room exists.
- What's the average days-on-market for RENTAL listings here right now (not sales)? A rising rental-DOM trend means longer vacancies and softer asking-rent achievability than the comps imply.
- What's the recent tenant-quality profile in this submarket — average credit score on applications, eviction rate, late-payment / NSF rate, and stable-employment percentage? A property-management company in the area should have these aggregated.
- How much new for-sale + rental construction is in the pipeline within 1–3 miles? Heavy new supply typically softens prices + rents 12–24 months out; constrained supply supports both.
Investment metrics
- 1% rule
- 1.05% ✓
- Cap rate
- 8.41%
- Cash-on-cash
- 7.57%
- DSCR
- 1.34
- GRM
- 8.0
CMA / ARV
- ARV (on-the-fly)
- $246,675
- Comps found
- 12
Show comp detail 12 sales within ~0.75 mi
| Address | Dist | Beds/Ba | Sqft | Sold | Price | $/sf | Match |
|---|---|---|---|---|---|---|---|
| 4371 18th Ave S | 0.25mi | 2/1.0 | 752 (-1%) | 6mo | $282,000 | $375 | 82 |
| 4601 21st Ave S | 0.31mi | 2/1.0 | 780 (+3%) | 4mo | $237,000 | $304 | 78 |
| 4941 Newton Ave S | 0.35mi | 3/1.0 (+1) | 720 (-5%) | 0mo | $160,000 | $222 | 70 |
| 4627 19th Ave S | 0.19mi | 2/1.0 | 648 (-15%) | 4mo | $125,000 | $193 | 63 |
| 4727 17th Ave S | 0.13mi | 2/1.0 | 861 (+13%) | 10mo | $280,000 | $325 | 63 |
| 5009 12th Ave S | 0.46mi | 3/1.0 (+1) | 804 (+6%) | 5mo | $319,000 | $397 | 60 |
| 3929 10th Ave S | 0.73mi | 3/1.0 (+1) | 770 (+1%) | 6mo | $235,000 | $305 | 54 |
| 1119 51st St S | 0.48mi | 2/1.0 | 848 (+12%) | 7mo | $215,000 | $254 | 52 |
| 5145 Preston Ave S | 0.45mi | 2/1.0 | 861 (+13%) | 9mo | $265,000 | $308 | 49 |
| 5410 19th Ave S | 0.70mi | 2/1.0 | 810 (+7%) | 9mo | $275,000 | $340 | 49 |
| 1801 52nd St S | 0.49mi | 3/2.0 (+1) | 866 (+14%) | 10mo | $290,000 | $335 | 36 |
| 5413 Newton Ave S | 0.70mi | 2/1.0 | 868 (+14%) | 9mo | $303,000 | $349 | 36 |
Match score weights: distance 35% · size 25% · config 20% · recency 20%. Top-matched comps best support the ARV.
Projected returns pro-forma
-3.0% appreciation · 0.0% rent growth · sell at horizon
- IRR
- -8.0%
- Equity multiple
- 0.71×
- Total profit
- $-16,047
- Equity at exit
- $29,806
- IRR
- -2.7%
- Equity multiple
- 0.84×
- Total profit
- $-8,779
- Equity at exit
- $17,284
Cash invested: $55,972 (down + closing). Projections, not guarantees.
Landlord ↔ Tenant lean methodology
- Overall (STATE)
- 87 Strongly Landlord-Friendly
- State Florida
- 87 Strongly Landlord-Friendly · R+3
- County
- — inherits STATE
- City
- — inherits STATE
ZIP-level market 33711
- Rents YoY
- -1.5%
- Active inventory
- 261
- Price-to-rent
- 8.0×
Monthly cashflow live
- Estimated rent
- $2,092 high interval (Pro) →
- Mortgage (P&I)
- −$1,048
- Tax from tax record
- −$168 /mo · $2,018/yr
- Insurance
- −$83
- HOA
- −$0
- Vacancy / Maint / Mgmt
- −$439
- Net cashflow
- $353
Break-even live
UW: 25.0% down · 7.5% · 30yr · 1.5% tax · 5.0% vac · 8.0% maint · 8.0% mgmt
Financing live
Cash to close
- Down payment
- $49,975
- Closing costs
- $5,997
- Reserves months
- —
- Total cash needed
- —
Loan-product check · same deal, 3 products live
Conventional
25% down · 7.5% · 30yr
- Down + closing
- —
- Monthly P&I
- —
- Monthly cashflow
- —
- DSCR
- —
- Eligible?
- —
Personal DTI + credit; lowest rate.
DSCR
20% down · 8.5% · 30yr
- Down + closing
- —
- Monthly P&I
- —
- Monthly cashflow
- —
- DSCR
- —
- Eligible?
- —
No personal income docs; deal must DSCR.
Hard money
10% down · 12.0% · 12mo
- Down + closing
- —
- Monthly P&I
- —
- Monthly cashflow
- —
- DSCR
- —
- Eligible?
- —
Short-term bridge; refi at stabilization.
Rent comps 40 comps
| Address | Beds | Baths | Sqft | Rent | $/sqft | DOM | Units | Dist |
|---|---|---|---|---|---|---|---|---|
| 4631 Queensboro Ave S St Petersburg, FL | 3.0 | 2.0 | 1094 | $2,600 | $2.38 | 10d | 1 | 0.06mi |
| 4631 Queensboro Ave S Unit 4631 St. Petersburg, FL | 3.0 | 2.0 | 1094 | $2,600 | $2.38 | 7d | 1 | 0.06mi |
| 1727 45th St S Unit B St. Petersburg, FL | 1.0 | 1.0 | 600 | $1,150 | $1.92 | 7d | 1 | 0.11mi |
| 4327 17th Ave S Saint Petersburg, FL | 2.0 | 1.0 | 880 | $2,500 | $2.84 | 24d | 1 | 0.26mi |
| 1933 47th St S Saint Petersburg, FL | 2.0 | 1.0 | 816 | $1,595 | $1.95 | 4d | 1 | 0.27mi |
| 4618 20th Ave S Saint Petersburg, FL | 2.0 | 1.0 | 921 | $1,800 | $1.95 | 2d | 1 | 0.28mi |
| 1327 43rd St S Saint Petersburg, FL | 3.0 | 1.5 | 959 | $2,250 | $2.35 | 4d | 1 | 0.31mi |
| 4545 12th Ave S Saint Petersburg, FL | 2.0 | 1.0 | 660 | $2,000 | $3.03 | 4d | 1 | 0.32mi |
| 1628 43rd St S Saint Petersburg, FL | 3.0 | 2.0 | 1045 | $2,100 | $2.01 | 24d | 1 | 0.33mi |
| 4601 22nd Ave S Saint Petersburg, FL | 1.0–2.0 | 1.0 | 872 | $1,349 | $1.55 | 1d | 3 | 0.38mi |
| 4421 11th Ave S Saint Petersburg, FL | 3.0 | 2.0 | 945 | $2,000 | $2.12 | 4d | 1 | 0.39mi |
| 4933 13th Ave S Gulfport, FL | 2.0 | 1.0 | 939 | $2,200 | $2.34 | 20d | 1 | 0.40mi |
| 4801 10th Ave S Unit 1 St. Petersburg, FL | 3.0 | 1.0 | 1100 | $2,200 | $2.00 | 24d | 1 | 0.46mi |
| 5219 17th Ave S Unit 5219 Gulfport, FL | 1.0 | 1.0 | 600 | $1,400 | $2.33 | 21d | 1 | 0.53mi |
| 4665 Yarmouth Ave S Saint Petersburg, FL | 2.0 | 1.0 | 826 | $1,950 | $2.36 | 24d | 1 | 0.53mi |
| 1720 53rd St S Unit 1720 Gulfport, FL | 1.0 | 1.0 | 723 | $1,800 | $2.49 | 17d | 1 | 0.55mi |
| 1720 53rd St S Gulfport, FL | 1.0 | 1.0 | 728 | $1,800 | $2.47 | 4d | 1 | 0.55mi |
| 1701 53rd St S Gulfport, FL | 3.0 | 1.0 | 994 | $2,800 | $2.82 | 4d | 1 | 0.58mi |
| 1642 39th St S Saint Petersburg, FL | 3.0 | 1.0 | 975 | $1,995 | $2.05 | 20d | 1 | 0.63mi |
| 2402 52nd St S Gulfport, FL | 2.0 | 2.0 | 1028 | $3,000 | $2.92 | 4d | 1 | 0.70mi |
| 3936 9th Ave S Saint Petersburg, FL | 2.0 | 1.0 | 696 | $1,895 | $2.72 | 7d | 1 | 0.72mi |
| 4541 6th Ave S Saint Petersburg, FL | 3.0 | 1.0 | 945 | $1,100 | $1.16 | 14d | 1 | 0.75mi |
| 1665 37th St S Saint Petersburg, FL | 3.0 | 1.0 | 867 | $1,850 | $2.13 | 10d | 1 | 0.75mi |
| 1922 55th St S Gulfport, FL | 2.0 | 1.0 | 864 | $2,500 | $2.89 | 4d | 1 | 0.75mi |
| 2524 52nd St S Unit 2 Gulfport, FL | 1.0 | 1.0 | 575 | $1,595 | $2.77 | 17d | 1 | 0.77mi |
| 2412 53rd St S Unit A Gulfport, FL | 3.0 | 1.0 | 821 | $2,250 | $2.74 | 24d | 1 | 0.77mi |
| 2800 47th St S Gulfport, FL | 2.0 | 1.0 | 890 | $2,300 | $2.58 | 4d | 1 | 0.82mi |
| 5608 18th Ave S Gulfport, FL | 1.0 | 1.0 | 560 | $1,600 | $2.86 | 24d | 1 | 0.84mi |
| 2506 54th St S Gulfport, FL | 2.0 | 1.0 | 938 | $1,800 | $1.92 | 24d | 1 | 0.86mi |
| 2506 54th St S Gulfport, FL | 2.0 | 1.0 | 876 | $1,800 | $2.05 | 7d | 1 | 0.86mi |
| 3535 14th Ave S Saint Petersburg, FL | 3.0 | 1.0 | 768 | $1,650 | $2.15 | 4d | 1 | 0.86mi |
| 505 43rd St S Unit 5051/2 St. Petersburg, FL | 2.0 | 1.0 | 800 | $2,000 | $2.50 | 24d | 1 | 0.87mi |
| 450 47th St S Saint Petersburg, FL | 3.0 | 1.0 | 960 | $2,950 | $3.07 | 4d | 1 | 0.87mi |
| 5011 Emerson Ave S Saint Petersburg, FL | 1.0 | 1.0 | 600 | $1,450 | $2.42 | 24d | 1 | 0.88mi |
| 4525 29th Ave S Gulfport, FL | 2.0 | 1.0 | 828 | $1,895 | $2.29 | 4d | 1 | 0.88mi |
| 1806 57th St S Fl 33714 Gulfport, FL | 1.0 | 1.0 | 550 | $1,500 | $2.73 | 24d | 1 | 0.89mi |
| 2510 38th St S Saint Petersburg, FL | 3.0 | 1.5 | 1104 | $2,340 | $2.12 | 4d | 1 | 0.89mi |
| 2510 38th St S Saint Petersburg, FL | 3.0 | 1.5 | 1104 | $2,340 | $2.12 | 23d | 1 | 0.89mi |
| 5214 27th Ave S Unit 2 Gulfport, FL | 1.0 | 1.0 | 800 | $2,600 | $3.25 | 4d | 1 | 0.90mi |
| 2865 51st St S Gulfport, FL | 2.0 | 1.0 | 944 | $1,900 | $2.01 | 11d | 1 | 0.94mi |
Listing history 21 events
-
2026-06-19status $199,900 Pending 27 DOM
-
2026-06-18days on market $199,900 Active 27 DOM
-
2026-06-17days on market $199,900 Active 26 DOM
-
2026-06-16days on market $199,900 Active 25 DOM
-
2026-06-15days on market $199,900 Active 24 DOM
-
2026-06-13pricedays on market $199,900 Active 22 DOM
-
2026-06-09days on market $209,000 Active 18 DOM
-
2026-06-08days on market $209,000 Active 17 DOM
-
2026-06-07days on market $209,000 Active 16 DOM
-
2026-06-04days on market $209,000 Active 13 DOM
-
2026-06-03days on market $209,000 Active 12 DOM
-
2026-06-02days on market $209,000 Active 11 DOM
-
2026-06-01days on market $209,000 Active 10 DOM
-
2026-05-31days on market $209,000 Active 9 DOM
-
2026-05-22$209,000 Active
-
2024-08-09$220,000 Active
-
2019-08-16soldstatus $54,000
-
2019-08-15soldstatus $54,000 Sold 115-char remark
Show marketing remark (115 chars)
Great Single Family Home in the Heart of Saint Petersburg. Spacious Lot! Needs Some TLC, But Has Tons of Potential!
-
2019-07-30status Pending 115-char remark
Show marketing remark (115 chars)
Great Single Family Home in the Heart of Saint Petersburg. Spacious Lot! Needs Some TLC, But Has Tons of Potential!
-
2019-07-22$44,900 Active 115-char remark
Show marketing remark (115 chars)
Great Single Family Home in the Heart of Saint Petersburg. Spacious Lot! Needs Some TLC, But Has Tons of Potential!
-
1981-01-01soldstatus $18,500
ⓘ Source: listings_history table (triggers on properties + properties_extension) + one-shot
backfill from property_details.listing_events for pre-trigger history.
Tax reassessment forecast FL · Resets to sale price
- Current annual tax
- $2,018 · $168/mo
- Projected year-2 tax
- $2,018 · $168/mo
- Expected delta
- $0/yr ($0/mo · 0.0%)
ⓘ Screening estimate from a state-policy table — verify with the county assessor before closing.
Climate risk First Street
- Flood 1/10 Low FEMA zone X (unshaded) · 0% chance over 30 yrs
- Wildfire 1/10 Low
- Heat 10/10 Extreme 7 d/yr ≥106°F today · 26 d/yr by 30 yrs out
- Wind 10/10 Extreme 99% chance of damaging wind over 30 yrs
- Air quality 4/10 Moderate 4 unhealthy d/yr today · 4 by 30 yrs out
Nearby sold comps map
Loading sold comps map…
Walkable amenities ~0.75 mi
Loading nearby amenities…
Taxation est. · year 1
- Rental income
- $25,108
- − Mortgage interest
- −$11,198
- − Property taxes
- −$2,018
- − Insurance
- −$1,000
- − Repairs & maintenance
- −$2,009
- − Management
- −$2,009
- − Depreciation
- −$5,815
- Taxable income
- $1,061
- Est. tax owed @ 24.0%
- −$255
- After-tax cash flow
- $3,984/yr
For passive investors: Depreciation is non-cash, so a rental often shows a tax loss while cash-flowing — sheltering income. Rental losses are passive: they offset passive income freely, and up to $25,000/yr can offset ordinary (W-2) income if you actively participate and your MAGI is under $100k (phasing out to $0 by $150k); unused losses carry forward. On sale, claimed depreciation is recaptured at up to 25%, and gains may owe capital-gains tax (a 1031 exchange can defer both). Figures are a year-1 estimate at your 24.0% rate — not tax advice; consult a CPA.
Schools (NCES district)
- District
- Pinellas
- NCES district ID
- 1201560
- Math proficiency
- 51% ▼ -5.00%
- Reading proficiency
- 51% ▼ -3.00%
- Median HH income
- $46,270
- Composite
- 43.27/100
- National rank
- #3046
- State rank
- #31 of 73 in FL
Livability — St. Petersburg
No livability data for this city. (Only ~50 U.S. cities are tracked.)
Census & demographics
- Census place
- St. Petersburg, FL
- County
- Pinellas County · 939,478 people
- City population
- 249,151
- Metro
- Tampa-St. Petersburg-Clearwater, FL
- Population (ZIP)
- 20,013
- Household income
- $66,540
- Rent vs Own
- Severe rent burden
- 903.0
Population outlook (Pinellas County) Hauer SSP2
- Today (2025)
- 1,027,532 people
- By 2030
- 1,063,586 · +3.5%
- By 2040
- 1,125,020 · +9.5%
- By 2050
- 1,168,637 · +13.7%
- By 2075
- 1,265,188 · +23.1%
- By 2100
- 1,260,357 · +22.7%
Race, ethnicity, and origin ACS 2023
- Neighborhood character
- Diverse neighborhood (Simpson 0.59)
- Race & ethnicity
- White 45% Black 45% Hispanic / Latino 6% Two or more races 6%
- Hispanic origin (detail)
- Puerto Rican 1%
- Common ancestry
- Romanian 2% Lithuanian 2% Italian 1%
- Foreign-born
- 7% · Canada, Dominican Republic
- Languages at home
- 91% English-only · Spanish 4% French/Haitian/Cajun 3% Other Indo-European 1%
Political lean MEDSL · Pinellas
- 2024 margin
- Lean R (+5.2) · D 46.9% · R 52.1%
- 2008→2024 swing
- -13.5pp toward R · 2008: 8.3pp · 2024: -5.2pp
- All cycles
- 2024: R+5.2 2020: D+0.2 2016: R+1.1 2012: D+5.6 2008: D+8.3
Not yet ingested
- Civics
- —
Market trends
- HPI YoY
- ▼ -313.54%
- Current HPI
- 338.2712
- Rent YoY
- ▼ -1.47%
- Metro
- Tampa-St. Petersburg-Clearwater, FL
- State GDP YoY
- ▲ 3.28%
- F500 in state
- 36
Industry mix (Fortune 500 HQ in FL)
| Industry | F500 HQs | Revenue |
|---|---|---|
| Industrial Technology | 2 | $29B |
|
||
| Insurance | 2 | $17B |
|
||
| Retail | 1 | $60B |
|
||
| Technology Distribution | 1 | $58B |
|
||
| Homebuilding | 1 | $35B |
|
||
| Technology Manufacturing | 1 | $35B |
|
||
Price history
+1029.7% since first listed7 events — show timeline
- 2026-05-22 Listed $209,000 Stellar MLS as Distributed by MLS Grid
- 2024-08-09 Listed $220,000 Stellar MLS as Distributed by MLS Grid
- 2019-08-16 Sold (Public Records) $54,000 Public Records
- 2019-08-15 Sold (MLS) $54,000 Stellar MLS as Distributed by MLS Grid
- 2019-07-30 Pending — Stellar MLS as Distributed by MLS Grid
- 2019-07-22 Listed $44,900 Stellar MLS as Distributed by MLS Grid
- 1981-01-01 Sold (Public Records) $18,500 Public Records
Property tax history
+14.4%/yrLatest (2025): $2,018 · +15.2% YoY. Source: county tax records.
Cash-flow waterfall
monthlySold comps — $/sqft
last 12 mo · ≤1 miLoading sold comps…