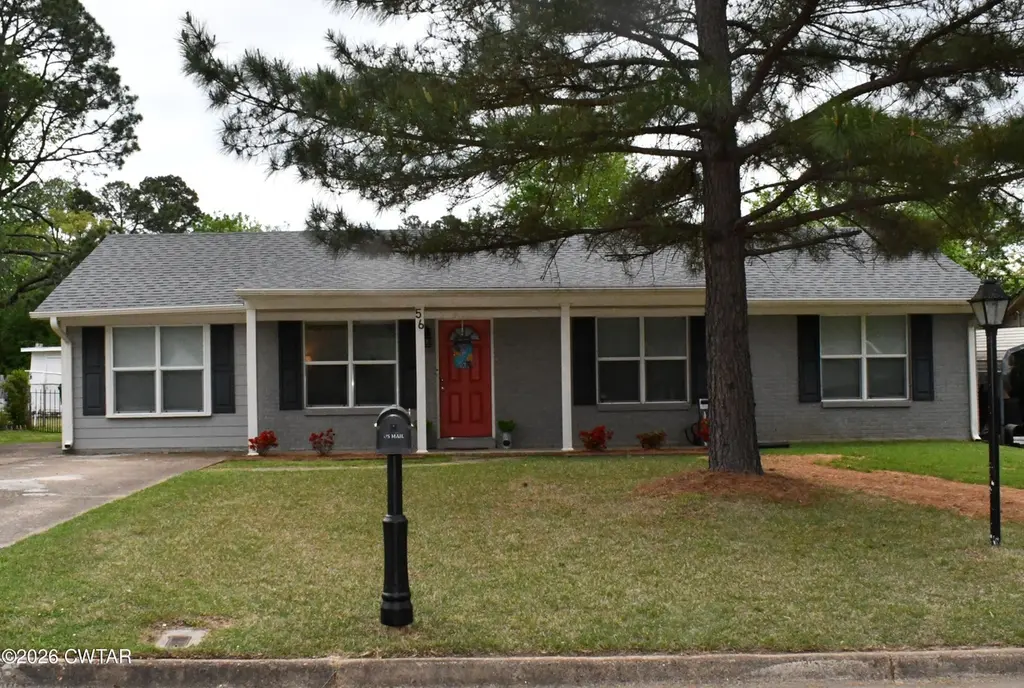
56 Briarcliff Dr · Jackson, TN
Flood risk 1/10 · Minimal
- FEMA flood zone
- X (unshaded)
- Chance of flooding over 30 yrs
- 0.0%
- Est. flood insurance / yr
- $473 – $860
Fire risk 1/10 · Minimal
- Est. fire insurance / yr
- $949 – $1,763
Heat risk 6/10 · Moderate
- Hot days now (above 108°F)
- 7 days/yr
- Hot days in 30 yrs
- 20 days/yr
Wind risk 4/10 · Minor
- Chance of severe wind over 30 yrs
- 14.0%
Air-quality risk 1/10 · Minimal
- Unhealthy air days now
- 0 days/yr
- Unhealthy air days in 30 yrs
- 0 days/yr
Risk factors via First Street. Map © Google.
Why this score? — see what drove the C- grade
The composite is a weighted blend of 9 inputs, each scored 0–100. Each bar is that input's sub-score; the figure is the points it added to the 100-point composite (weight × sub-score).
- Cash flow +23.2/30.0
- DSCR +7.4/10.0
- ARV discount +5.6/15.0
- 1% rule +4.8/10.0
- Rent growth +3.8/5.0
- Livability +3.1/5.0
- Condition / age +2.5/5.0
- Schools +1.2/10.0
- Appreciation +0.0/10.0
$162,000
🖨 Deal sheet (PDF) 📄 Offer letter ✓ Due diligence
Listing remarks MLS
Newly Remodeled 4 Bedroom/1 Bath Home in Central Jackson Location. New Roof to be installed within 4 weeks, New HVAC - New Windows - New Flooring - New Interior & Exterior Doors - New Tub Shower Combo - New Toilet - New Vanity & Sink - New Light Fixtures and Fresh New Paint. New Kitchen Cabinets - New Countertops - New Gas Range - New Kitchen Sink and New Garbage Disposal. List Price $99,900. Call a Local Realtor Today to See this Completely Remodeled Home.
Key facts
- Updated cabinets
- Stainless appliances
- Bright living spaces
Tags
Property features AI
Finance
- Other: Subdivision: Briarcliff
Exterior
- Parking: 2 open parking spaces
- Security: Smoke detector(s)
- Utilities: Public water; Public sewer; Electricity connected; Natural gas connected / available; Phone available
- Home design: Single-family residence; One level / 1 story
- Construction: Vinyl siding; Slab foundation
- Exterior features: Patio; Back yard with chain-link fencing; Level lot; Asphalt road frontage on a city street (public maintained road)
Interior
- Kitchen: Dishwasher; Gas range; Microwave; Electric water heater
- Bedrooms: 4 main-level bedrooms
- Flooring: Laminate; Vinyl
- Bathrooms: 1 full bathroom (main level)
- Heating & cooling: Central heating (heat pump); Central air; Ceiling fan(s)
- Interior features: Eat-in kitchen; Aluminum window frames; Window blinds; Smoke detector(s); Storage
- Laundry & utility: Laundry room with washer and electric dryer hookups
Neighborhood map
What this means for you Summary
Snapshot
- This is a 4-bed/2.0-bath single-family listed at $162k.
Deal economics
- At list price, monthly cash flow is $293 ($4k/yr) — positive.
- The deal already cash-flows at list — no discount required.
- To meet the 1% rule (rent ≥ 1% of price), the offer needs to be $159k (1.6% below list).
- Recommended offer: $159k (1.6% below list) — sets the bar for 1% rule.
- Cap rate 8.5% vs local median 3.5% in Jackson — top-decile yield for the area; either an underpriced asset or a hidden risk that comps aren't pricing in. Stress-test before assuming the spread holds.
Location & tenants
- Location reads 62/100 on livability (#216 in TN) — a middle-class / working-renter tenant base. Strengths: cost of living A+, housing A+; Watch: health & safety C-, crime F, amenities F.
- Madison County (urban): math 10% / reading 17% proficiency, ranked #131 of 139 in TN (top 94%) — low school quality limits family demand, transient renter base, plan for 1-2y turnover; 68% free/reduced lunch — lower-income household profile, screen leases tightly.
- Zoned schools: Andrew Jackson Elementary School (math 2% / reading 8%, grade F, #896 of 952 statewide, top 96%, 475 students, 0% FRL); North Parkway Middle School (math 4% / reading 6%, grade F, #295 of 333 statewide, top 91%, 340 students, 0% FRL); North Side High School (math 3% / reading 22%, grade F, #257 of 332 statewide, top 78%, 886 students, 0% FRL) — zoned schools average 0% FRL vs 68% district-wide (68 pts lower); this property's tenant base skews higher-income than the district average.
- Market conditions: Rents rising fast (+5.2%/yr); 255 active listings in the ZIP; lower-income renter base — watch delinquency; 247 units permitted in Madison County in 2024 (0 in 5+ unit buildings).
- This rent runs 44% of the median local income ($43k/yr) — at the standard rent-burdened threshold; future hikes will face affordability resistance.
Forward outlook
- Local home prices are declining (-3.0%/yr); year-one equity from $1k of loan paydown is wiped out by about $5k of value loss. Plan a longer hold.
- Madison County population projected at -12% by 2050 — secular population decline; favor cash flow + early exit over multi-decade hold.
- At projected returns (-3.0% appreciation + 5.2% rent growth), your $45k cash investment doubles in ~10 years — after that, you're playing with house money.
Negotiation context
- Only 14 days on market — expect competitive offers; lowballing is unlikely to land.
- 2 sale attempts since 6y ago with the ask held roughly flat each time — persistent listings suggest the price (not the market) is what's stuck; bring a comps-based counter.
- Current owner paid $102k; list at $162k implies a 59% gain — meaningful room to come down on a strong offer.
Risks & watch-outs
- Climate carrying-cost: extreme-heat days projected 7→20/yr by 2055 (HVAC capex compounding) — expect insurance premiums to compound above CPI over the hold.
Questions for the listing agent
- Built in 1966 — when were the roof, HVAC, electrical panel, plumbing, and water heater last replaced?
- Is there a deadline driving the sale (1031 exchange, divorce, estate, relocation)? That informs how much negotiation room exists.
- Schools are F-rated, which usually means shorter tenancies and higher turnover. Who's the typical renter profile here, and what's been the actual vacancy rate?
- Crime grade is F in this area — have there been break-ins, vandalism, or insurance claims at this property in the last 3 years? What carrier currently insures it and at what premium?
- What's the average days-on-market for RENTAL listings here right now (not sales)? A rising rental-DOM trend means longer vacancies and softer asking-rent achievability than the comps imply.
- What's the recent tenant-quality profile in this submarket — average credit score on applications, eviction rate, late-payment / NSF rate, and stable-employment percentage? A property-management company in the area should have these aggregated.
- How much new for-sale + rental construction is in the pipeline within 1–3 miles? Heavy new supply typically softens prices + rents 12–24 months out; constrained supply supports both.
Investment metrics
- 1% rule
- 0.98% ✗
- Cap rate
- 8.46%
- Cash-on-cash
- 7.74%
- DSCR
- 1.34
- GRM
- 8.5
CMA / ARV
- ARV (on-the-fly)
- $155,358
- Comps found
- 12
Show comp detail 12 sales within ~0.75 mi
| Address | Dist | Beds/Ba | Sqft | Sold | Price | $/sf | Match |
|---|---|---|---|---|---|---|---|
| 56 Briarcliff Dr | 0.00mi | 4/1.0 | 1,233 (0%) | 1mo | $155,000 | $126 | 96 |
| 66 Briarcliff Dr | 0.03mi | 3/1.0 (-1) | 1,361 (+10%) | 4mo | $105,000 | $77 | 69 |
| 29 Webber St | 0.11mi | 4/2.0 | 1,292 (+5%) | 22mo | $70,000 | $54 | 69 |
| 46 Sweetbay Dr | 0.09mi | 3/1.5 (-1) | 1,102 (-11%) | 6mo | $101,000 | $92 | 66 |
| 316 Fairmont Ave | 0.66mi | 3/2.0 (-1) | 1,222 (-1%) | 1mo | $157,500 | $129 | 62 |
| 97 Ingram St | 0.27mi | 4/2.0 | 1,384 (+12%) | 8mo | $190,000 | $137 | 60 |
| 83 Chipwood Dr | 0.37mi | 3/1.5 (-1) | 1,340 (+9%) | 13mo | $125,000 | $93 | 50 |
| 411 Greenwood Ave | 0.67mi | 3/2.0 (-1) | 1,350 (+10%) | 3mo | $182,000 | $135 | 45 |
| 320 Walnut St | 0.63mi | 3/2.0 (-1) | 1,320 (+7%) | 12mo | $222,500 | $169 | 44 |
| 401 Greenwood Ave | 0.64mi | 3/1.0 (-1) | 1,296 (+5%) | 12mo | $5,000 | $4 | 43 |
| 356 Roland Ave | 0.71mi | 3/2.0 (-1) | 1,340 (+9%) | 20mo | $240,000 | $179 | 31 |
| 116 Muse St | 0.61mi | 3/1.0 (-1) | 1,100 (-11%) | 18mo | $65,000 | $59 | 30 |
Match score weights: distance 35% · size 25% · config 20% · recency 20%. Top-matched comps best support the ARV.
Projected returns pro-forma
-3.0% appreciation · 5.19% rent growth · sell at horizon
- IRR
- -2.3%
- Equity multiple
- 0.91×
- Total profit
- $-4,090
- Equity at exit
- $24,155
- IRR
- 9.4%
- Equity multiple
- 1.78×
- Total profit
- $35,560
- Equity at exit
- $14,007
Cash invested: $45,360 (down + closing). Projections, not guarantees.
Landlord ↔ Tenant lean methodology
- Overall (STATE)
- 87 Strongly Landlord-Friendly
- State Tennessee
- 87 Strongly Landlord-Friendly · R+13
- County
- — inherits STATE
- City
- — inherits STATE
ZIP-level market 38301
- Rents YoY
- 5.2%
- Active inventory
- 255
- Price-to-rent
- 8.5×
Monthly cashflow live
- Estimated rent
- $1,594 medium interval (Pro) →
- Mortgage (P&I)
- −$850
- Tax from tax record
- −$49 /mo · $592/yr
- Insurance
- −$68
- HOA
- −$0
- Vacancy / Maint / Mgmt
- −$335
- Net cashflow
- $293
Break-even live
Sensitivity live
| Price | -10% $384 | -5% $339 | +0% $293 | +5% $247 | +10% $201 |
|---|---|---|---|---|---|
| Rent | -10% $167 | -5% $230 | +0% $293 | +5% $356 | +10% $419 |
| Rate | -1.0pp $374 | -0.5pp $334 | base $293 | +0.5pp $251 | +1.0pp $208 |
UW: 25.0% down · 7.5% · 30yr · 1.5% tax · 5.0% vac · 8.0% maint · 8.0% mgmt
Financing live
Cash to close
- Down payment
- $40,500
- Closing costs
- $4,860
- Reserves months
- —
- Total cash needed
- —
Loan-product check · same deal, 3 products live
Conventional
25% down · 7.5% · 30yr
- Down + closing
- —
- Monthly P&I
- —
- Monthly cashflow
- —
- DSCR
- —
- Eligible?
- —
Personal DTI + credit; lowest rate.
DSCR
20% down · 8.5% · 30yr
- Down + closing
- —
- Monthly P&I
- —
- Monthly cashflow
- —
- DSCR
- —
- Eligible?
- —
No personal income docs; deal must DSCR.
Hard money
10% down · 12.0% · 12mo
- Down + closing
- —
- Monthly P&I
- —
- Monthly cashflow
- —
- DSCR
- —
- Eligible?
- —
Short-term bridge; refi at stabilization.
Listing history 5 events
-
2026-04-29status Pending
-
2026-04-09$162,000 Active
-
2020-08-26soldstatus $101,700
-
2020-08-25soldstatus $101,700 475-char remark
Show marketing remark (475 chars)
Newly Remodeled 4 Bedroom/1 Bath Home in Central Jackson Location. New Roof to be installed within 4 weeks, New HVAC - New Windows - New Flooring - New Interior & Exterior Doors - New Tub Shower Combo - New Toilet - New Vanity & Sink - New Light Fixtures and Fresh New Paint. New Kitchen Cabinets - New Countertops - New Gas Range - New Kitchen Sink and New Garbage Disposal. List Price $99,900. Call a Local Realtor Today to See this Completely Remodeled Home.
-
2020-06-21$99,500 475-char remark
Show marketing remark (475 chars)
Newly Remodeled 4 Bedroom/1 Bath Home in Central Jackson Location. New Roof to be installed within 4 weeks, New HVAC - New Windows - New Flooring - New Interior & Exterior Doors - New Tub Shower Combo - New Toilet - New Vanity & Sink - New Light Fixtures and Fresh New Paint. New Kitchen Cabinets - New Countertops - New Gas Range - New Kitchen Sink and New Garbage Disposal. List Price $99,900. Call a Local Realtor Today to See this Completely Remodeled Home.
ⓘ Source: listings_history table (triggers on properties + properties_extension) + one-shot
backfill from property_details.listing_events for pre-trigger history.
Tax reassessment forecast TN · Resets to sale price
- Current annual tax
- $592 · $49/mo
- Projected year-2 tax
- $1,150 · $96/mo
- Expected delta
- +$558/yr (+$47/mo · 94.3%)
ⓘ Screening estimate from a state-policy table — verify with the county assessor before closing.
Climate risk First Street
- Flood 1/10 Low FEMA zone X (unshaded) · 0% chance over 30 yrs
- Wildfire 1/10 Low
- Heat 6/10 Major 7 d/yr ≥108°F today · 20 d/yr by 30 yrs out
- Wind 4/10 Moderate 14% chance of damaging wind over 30 yrs
- Air quality 1/10 Low 0 unhealthy d/yr today · 0 by 30 yrs out
Nearby sold comps map
Loading sold comps map…
Walkable amenities ~0.75 mi
Loading nearby amenities…
Taxation est. · year 1
- Rental income
- $19,125
- − Mortgage interest
- −$9,075
- − Property taxes
- −$592
- − Insurance
- −$810
- − Repairs & maintenance
- −$1,530
- − Management
- −$1,530
- − Depreciation
- −$4,713
- Taxable income
- $876
- Est. tax owed @ 24.0%
- −$210
- After-tax cash flow
- $3,302/yr
For passive investors: Depreciation is non-cash, so a rental often shows a tax loss while cash-flowing — sheltering income. Rental losses are passive: they offset passive income freely, and up to $25,000/yr can offset ordinary (W-2) income if you actively participate and your MAGI is under $100k (phasing out to $0 by $150k); unused losses carry forward. On sale, claimed depreciation is recaptured at up to 25%, and gains may owe capital-gains tax (a 1031 exchange can defer both). Figures are a year-1 estimate at your 24.0% rate — not tax advice; consult a CPA.
Schools (NCES district)
- District
- Madison County
- NCES district ID
- 4702580
- Math proficiency
- 10% ▼ -11.00%
- Reading proficiency
- 17% ▼ -4.00%
- Median HH income
- $42,015
- Composite
- 11.74/100
- National rank
- #9687
- State rank
- #131 of 139 in TN
Livability — Jackson
- Score
- 62/100
- State rank
- #216
- US rank
- #16488
Category grades
Schools grade is shown separately in the Schools card above.
Census & demographics
- Census place
- Jackson, TN
- County
- Madison County · 87,024 people
- City population
- 87,024
- Metro
- Jackson, TN
- Population (ZIP)
- 33,536
- Household income
- $43,227
- Rent vs Own
- Severe rent burden
- 1701.0
Population outlook (Madison County) Hauer SSP2
- Today (2025)
- 95,952 people
- By 2030
- 94,264 · -1.8%
- By 2040
- 89,607 · -6.6%
- By 2050
- 84,133 · -12.3%
- By 2075
- 72,215 · -24.7%
- By 2100
- 62,062 · -35.3%
Race, ethnicity, and origin ACS 2023
- Neighborhood character
- Diverse neighborhood (Simpson 0.57)
- Race & ethnicity
- Black 50% White 42% Two or more races 5% Hispanic / Latino 4%
- Common ancestry
- Slovak 1% Serbian 1% Portuguese 1%
- Foreign-born
- 3% · Canada
- Languages at home
- 96% English-only · Spanish 3%
Political lean MEDSL · Madison
- 2024 margin
- R (+18.2) · D 40.3% · R 58.5% · Other 1.2%
- 2008→2024 swing
- +3.4pp toward D · 2008: -21.6pp · 2024: -18.2pp
- All cycles
- 2024: R+18.2 2020: R+12.9 2016: R+15.6 2012: R+8.9 2008: R+21.6
Not yet ingested
- Civics
- —
Market trends
- HPI YoY
- ▼ -112.26%
- Current HPI
- 162.2273
- Rent YoY
- ▲ 5.19%
- Metro
- Jackson, TN
- State GDP YoY
- ▲ 2.78%
- F500 in state
- 22
Industry mix (Fortune 500 HQ in TN)
| Industry | F500 HQs | Revenue |
|---|---|---|
| Healthcare | 3 | $91B |
|
||
| Retail | 3 | $72B |
|
||
| Transportation / Logistics | 1 | $88B |
|
||
| Paper / Packaging | 1 | $19B |
|
||
| Insurance | 1 | $13B |
|
||
| Energy | 1 | $12B |
|
||
Price history
+62.8% since first listed5 events — show timeline
- 2026-04-29 Pending — CWTAR
- 2026-04-09 Listed $162,000 CWTAR
- 2020-08-26 Sold (Public Records) $101,700 Public Records
- 2020-08-25 Sold (MLS) $101,700 CWTAR
- 2020-06-21 Listed $99,500 CWTAR
Property tax history
+4.2%/yrLatest (2025): $592 · +0.0% YoY. Source: county tax records.
Cash-flow waterfall
monthlySold comps — $/sqft
last 12 mo · ≤1 miLoading sold comps…