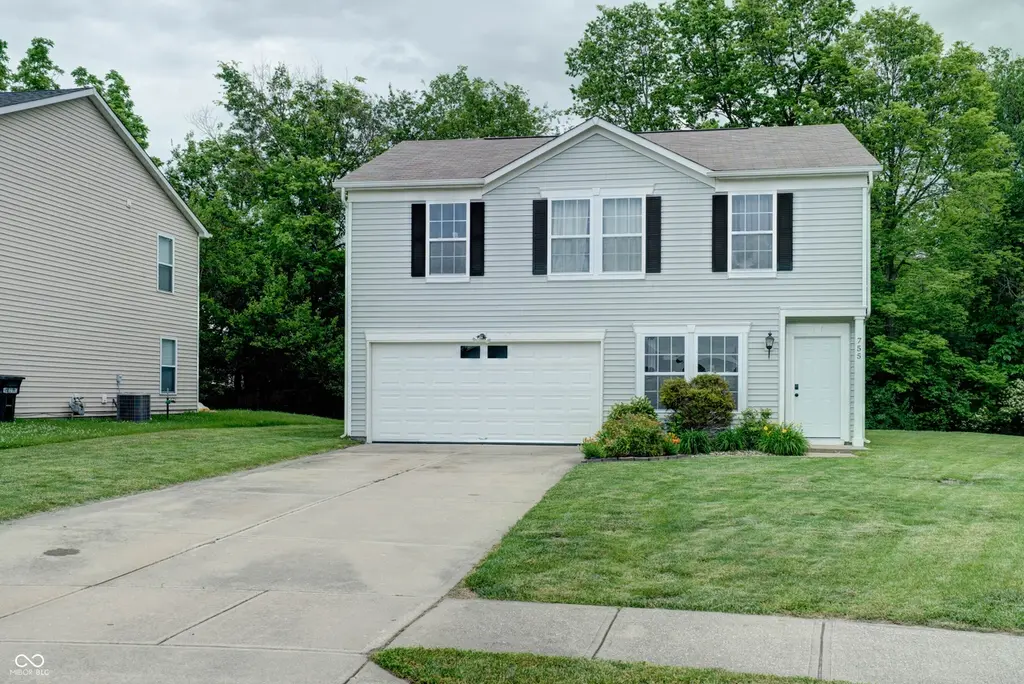
755 Sedgewick Ln · Greenfield, IN
Flood risk 1/10 · Minimal
- FEMA flood zone
- X (unshaded)
- Chance of flooding over 30 yrs
- 0.0%
- Est. flood insurance / yr
- $507 – $1,088
Fire risk 1/10 · Minimal
- Est. fire insurance / yr
- $717 – $1,331
Heat risk 3/10 · Minor
- Hot days now (above 102°F)
- 7 days/yr
- Hot days in 30 yrs
- 18 days/yr
Wind risk 2/10 · Minimal
- Chance of severe wind over 30 yrs
- 1.0%
Air-quality risk 2/10 · Minimal
- Unhealthy air days now
- 1 days/yr
- Unhealthy air days in 30 yrs
- 2 days/yr
Risk factors via First Street. Map © Google.
Why this score? — see what drove the D grade
The composite is a weighted blend of 9 inputs, each scored 0–100. Each bar is that input's sub-score; the figure is the points it added to the 100-point composite (weight × sub-score).
- Cash flow +13.9/30.0
- ARV discount +10.6/15.0
- DSCR +4.2/10.0
- Schools +4.0/10.0
- Livability +3.7/5.0
- Rent growth +3.2/5.0
- 1% rule +2.7/10.0
- Condition / age +2.5/5.0
- Appreciation +0.0/10.0
$259,900
🖨 Deal sheet (PDF) 📄 Offer letter ✓ Due diligence
Listing remarks
Beautiful 3-bedroom, 2-bath 2 story home located in a quiet cul de sac. This well-maintained home features an open-concept floor plan, beautiful vinyl plank floors in the living room, a spacious primary suite complete with a large garden tub/shower combo, and a walk-in closet. The yard is perfect for entertaining. This easy-to-love home includes a spacious laundry and garage area as well as a nicely sized loft. Conveniently located near shopping, dining, parks, and top-rated schools. Move-in ready and waiting for its next owner!
Key facts
- 7,928 sq ft lot
- 2 garage spots
- Built 2007
Property features AI
Finance
- HOA & community: HOA with an annual fee of $304 (fee includes: Not Applicable); Association reports no listed common amenities
Exterior
- Parking: Attached 2-car garage (approx. 360 sq ft); Asphalt driveway
- Utilities: Public water; Municipal sewer connected; Cable connected; Electricity connected; Natural gas available
- Home design: Single-family residence; Two levels; Mandatory HOA
- Construction: Vinyl siding; Slab foundation
- Exterior features: Cul-de-sac lot; Has a view
Interior
- Kitchen: Dishwasher; Disposal; Microwave; Electric oven; Refrigerator
- Bedrooms: Three upstairs bedrooms; Primary bedroom with walk-in closet
- Bathrooms: Two full bathrooms (both upstairs)
- Heating & cooling: Electric heating; Central air conditioning
- Interior features: Attic with pull-down stairs; Water softener (rented); Exhaust fan
- Laundry & utility: Washer and dryer; Gas water heater
Neighborhood map
What this means for you Summary
Snapshot
- This is a 3-bed/2.0-bath single-family listed at $260k.
Deal economics
- At list price, monthly cash flow is $29 ($350/yr) — positive.
- The deal already cash-flows at list — no discount required.
- To meet the 1% rule (rent ≥ 1% of price), the offer needs to be $201k (22.5% below list).
- Recommended offer: $201k (22.5% below list) — sets the bar for 1% rule.
- Cap rate 6.4% vs local median 4.7% in Greenfield — top-decile yield for the area; either an underpriced asset or a hidden risk that comps aren't pricing in. Stress-test before assuming the spread holds.
Location & tenants
- Location reads 73/100 on livability (#88 in IN) — a middle-class / working-renter tenant base. Strengths: cost of living A+, housing A+; Watch: amenities F, commute F.
- Greenfield-Central Community Schools (other): math 47% / reading 45% proficiency, ranked #83 of 301 in IN (top 28%) — families likely to look elsewhere, expect single-tenant / working-renter base with shorter leases.
- Zoned schools: Harris Elementary School (math 57% / reading 37%, grade D-, #325 of 994 statewide, top 36%, 280 students, 57% FRL); Greenfield Central Junior High Sch (math 38% / reading 42%, grade F, #120 of 330 statewide, top 37%, 675 students, 45% FRL); Greenfield-Central High School (math 37% / reading 65%, grade D+, #115 of 369 statewide, top 31%, 1,462 students, 35% FRL) — zoned schools average 46% FRL vs 29% district-wide (17 pts higher); higher-poverty schools than district average — tighter screening recommended.
- Market conditions: Rents rising (+2.9%/yr); 481 active listings in the ZIP; 8 comparable units currently listed for rent nearby; rentals leasing fast (median 6d on market — plan ~1-2 weeks tenant-placement turnaround); solid renter incomes; 1,091 units permitted in Hancock County in 2024 (0 in 5+ unit buildings).
Forward outlook
- Local home prices are declining (-3.0%/yr); year-one equity from $2k of loan paydown is wiped out by about $8k of value loss. Plan a longer hold.
- Hancock County population projected at +7% by 2050 — modest demand growth; plan on rents tracking national, not racing it.
Negotiation context
- It's been on market 19 days — a 2% lower offer ($256k) is reasonable based on typical stale-listing flexibility.
Questions for the listing agent
- What does the HOA fee cover, when was the last increase, and are there any pending special assessments or reserve-fund shortfalls?
- Is there a deadline driving the sale (1031 exchange, divorce, estate, relocation)? That informs how much negotiation room exists.
- Schools are B-rated — typically a magnet for longer-tenancy family renters. What's the average tenant stay here, and is there a school-zone premium baked into asking?
- The area grade is low — what's the realistic commute time and amenity access for the typical tenant pool here? Any planned neighborhood developments (good or bad) we should know about?
- What's the average days-on-market for RENTAL listings here right now (not sales)? A rising rental-DOM trend means longer vacancies and softer asking-rent achievability than the comps imply.
- What's the recent tenant-quality profile in this submarket — average credit score on applications, eviction rate, late-payment / NSF rate, and stable-employment percentage? A property-management company in the area should have these aggregated.
- How much new for-sale + rental construction is in the pipeline within 1–3 miles? Heavy new supply typically softens prices + rents 12–24 months out; constrained supply supports both.
Investment metrics
- 1% rule
- 0.77% ✗
- Cap rate
- 6.43%
- Cash-on-cash
- 0.48%
- DSCR
- 1.02
- GRM
- 10.8
CMA / ARV
- ARV (on-the-fly)
- $278,880
- Comps found
- 12
Show comp detail 12 sales within ~0.75 mi
| Address | Dist | Beds/Ba | Sqft | Sold | Price | $/sf | Match |
|---|---|---|---|---|---|---|---|
| 322 Longfellow Ct | 0.14mi | 3/2.0 | 1,725 (-1%) | 10mo | $267,450 | $155 | 83 |
| 388 Pomona Ct | 0.18mi | 3/2.0 | 1,653 (-5%) | 2mo | $264,000 | $160 | 81 |
| 217 Tague St | 0.26mi | 4/2.0 (+1) | 1,753 (+1%) | 5mo | $225,000 | $128 | 77 |
| 778 Oakleaf Dr | 0.37mi | 3/2.0 | 1,756 (+1%) | 9mo | $359,990 | $205 | 74 |
| 1174 Bumblebee Way | 0.50mi | 3/2.0 | 1,797 (+3%) | 3mo | $285,000 | $159 | 69 |
| 358 Bear Story Blvd | 0.25mi | 3/2.0 | 1,599 (-8%) | 8mo | $262,500 | $164 | 68 |
| 530 S State St | 0.37mi | 2/1.0 (-1) | 1,728 (-1%) | 7mo | $182,000 | $105 | 66 |
| 404 Lullaby Blvd | 0.11mi | 4/2.0 (+1) | 1,530 (-12%) | 8mo | $270,000 | $176 | 63 |
| 172 Bear Story Ct | 0.34mi | 4/2.0 (+1) | 1,511 (-13%) | 1mo | $270,000 | $179 | 56 |
| 1049 Bumblebee Way | 0.38mi | 3/2.0 | 1,483 (-15%) | 2mo | $250,000 | $169 | 55 |
| 3904 N State Road 9 | 0.70mi | 3/1.5 | 1,635 (-6%) | 3mo | $250,000 | $153 | 53 |
| 238 Walnut St | 0.74mi | 3/2.0 | 1,637 (-6%) | 6mo | $230,000 | $141 | 50 |
Match score weights: distance 35% · size 25% · config 20% · recency 20%. Top-matched comps best support the ARV.
Projected returns pro-forma
-3.0% appreciation · 2.88% rent growth · sell at horizon
- IRR
- -15.7%
- Equity multiple
- 0.44×
- Total profit
- $-40,614
- Equity at exit
- $38,752
- IRR
- -7.5%
- Equity multiple
- 0.53×
- Total profit
- $-34,429
- Equity at exit
- $22,471
Cash invested: $72,772 (down + closing). Projections, not guarantees.
Landlord ↔ Tenant lean methodology
- Overall (STATE)
- 90 Strongly Landlord-Friendly
- State Indiana
- 90 Strongly Landlord-Friendly · R+11
- County
- — inherits STATE
- City
- — inherits STATE
ZIP-level market 46140
- Rents YoY
- 2.9%
- Active inventory
- 481
- Price-to-rent
- 10.8×
Monthly cashflow live
- Estimated rent
- $2,014 high interval (Pro) →
- Mortgage (P&I)
- −$1,363
- Tax from tax record
- −$66 /mo · $790/yr
- Insurance
- −$108
- HOA
- −$25
- Vacancy / Maint / Mgmt
- −$423
- Net cashflow
- $29
Break-even live
Sensitivity live
| Price | -10% $176 | -5% $103 | +0% $29 | +5% $-44 | +10% $-118 |
|---|---|---|---|---|---|
| Rent | -10% $-130 | -5% $-50 | +0% $29 | +5% $109 | +10% $188 |
| Rate | -1.0pp $160 | -0.5pp $95 | base $29 | +0.5pp $-38 | +1.0pp $-107 |
UW: 25.0% down · 7.5% · 30yr · 1.5% tax · 5.0% vac · 8.0% maint · 8.0% mgmt
Financing live
Cash to close
- Down payment
- $64,975
- Closing costs
- $7,797
- Reserves months
- —
- Total cash needed
- —
Loan-product check · same deal, 3 products live
Conventional
25% down · 7.5% · 30yr
- Down + closing
- —
- Monthly P&I
- —
- Monthly cashflow
- —
- DSCR
- —
- Eligible?
- —
Personal DTI + credit; lowest rate.
DSCR
20% down · 8.5% · 30yr
- Down + closing
- —
- Monthly P&I
- —
- Monthly cashflow
- —
- DSCR
- —
- Eligible?
- —
No personal income docs; deal must DSCR.
Hard money
10% down · 12.0% · 12mo
- Down + closing
- —
- Monthly P&I
- —
- Monthly cashflow
- —
- DSCR
- —
- Eligible?
- —
Short-term bridge; refi at stabilization.
Rent comps 8 comps
| Address | Beds | Baths | Sqft | Rent | $/sqft | DOM | Units | Dist |
|---|---|---|---|---|---|---|---|---|
| 713 Cattail Dr Greenfield, IN | 3.0 | 2.0 | 1498 | $2,045 | $1.37 | 5d | 1 | 0.11mi |
| 876 Marsh Aster Dr Greenfield, IN | 4.0 | 2.0 | 1771 | $2,245 | $1.27 | 12d | 1 | 0.34mi |
| 968 Lotus Dr Greenfield, IN | 3.0–5.0 | 2.0–3.0 | 2049 | $2,045 | $1.00 | 0d | 8 | 0.42mi |
| 22 Wilson St Greenfield, IN | 2.0 | 1.0 | 2200 | $925 | $0.42 | 5d | 1 | 0.61mi |
| 821 W 7th St Greenfield, IN | 2.0 | 2.0 | 1234 | $1,700 | $1.38 | 25d | 1 | 0.94mi |
| 220 Walker St Greenfield, IN | 3.0 | 1.0 | 1101 | $1,400 | $1.27 | 6d | 1 | 1.07mi |
| 550 Wood St Greenfield, IN | 2.0 | 1.0 | 1162 | $1,200 | $1.03 | 6d | 1 | 1.15mi |
| 1027 E Fourth St Greenfield, IN | 3.0 | 2.0 | 1430 | $1,700 | $1.19 | 25d | 1 | 1.38mi |
HOA detail
- Monthly dues
- $25 · $300/yr
Listing history 14 events
-
2026-06-21days on market $259,900 Active 19 DOM
-
2026-06-18days on market $259,900 Active 16 DOM
-
2026-06-17price $259,900 Active 15 DOM
-
2026-06-17days on market $264,000 Active 15 DOM
-
2026-06-16days on market $264,000 Active 14 DOM
-
2026-06-15days on market $264,000 Active 13 DOM
-
2026-06-13days on market $264,000 Active 11 DOM
-
2026-06-13days on market $264,000 Active 10 DOM
-
2026-06-09days on market $264,000 Active 7 DOM
-
2026-06-08days on market $264,000 Active 6 DOM
-
2026-06-07days on market $264,000 Active 5 DOM
-
2026-06-05days on market $264,000 Active 2 DOM
-
2026-06-02remarks 534-char remark
-
2026-06-02$264,000 Active 1 DOM
ⓘ Source: listings_history table (triggers on properties + properties_extension) + one-shot
backfill from property_details.listing_events for pre-trigger history.
Tax reassessment forecast IN · Partial reset (capped growth)
- Current annual tax
- $790 · $66/mo
- Projected year-2 tax
- $1,499 · $125/mo
- Expected delta
- +$710/yr (+$59/mo · 89.9%)
ⓘ Screening estimate from a state-policy table — verify with the county assessor before closing.
Climate risk First Street
- Flood 1/10 Low FEMA zone X (unshaded) · 0% chance over 30 yrs
- Wildfire 1/10 Low
- Heat 3/10 Moderate 7 d/yr ≥102°F today · 18 d/yr by 30 yrs out
- Wind 2/10 Low 100% chance of damaging wind over 30 yrs
- Air quality 2/10 Low 1 unhealthy d/yr today · 2 by 30 yrs out
Nearby sold comps map
Loading sold comps map…
Walkable amenities ~0.75 mi
Loading nearby amenities…
Taxation est. · year 1
- Rental income
- $24,170
- − Mortgage interest
- −$14,558
- − Property taxes
- −$790
- − Insurance
- −$1,300
- − Repairs & maintenance
- −$1,934
- − Management
- −$1,934
- − HOA
- −$300
- − Depreciation
- −$7,561
- Taxable loss
- −$4,205
- Est. tax savings @ 24.0%
- +$1,009
- After-tax cash flow
- $1,359/yr
For passive investors: Depreciation is non-cash, so a rental often shows a tax loss while cash-flowing — sheltering income. Rental losses are passive: they offset passive income freely, and up to $25,000/yr can offset ordinary (W-2) income if you actively participate and your MAGI is under $100k (phasing out to $0 by $150k); unused losses carry forward. On sale, claimed depreciation is recaptured at up to 25%, and gains may owe capital-gains tax (a 1031 exchange can defer both). Figures are a year-1 estimate at your 24.0% rate — not tax advice; consult a CPA.
Schools (NCES district)
- District
- Greenfield-Central Community Schools
- NCES district ID
- 1804050
- Math proficiency
- 47% ▼ -12.00%
- Reading proficiency
- 45% ▼ -11.00%
- Median HH income
- $55,533
- Composite
- 40.01/100
- National rank
- #3827
- State rank
- #83 of 301 in IN
Livability — Greenfield
- Score
- 73/100
- State rank
- #88
- US rank
- #5094
Category grades
Schools grade is shown separately in the Schools card above.
Census & demographics
- Census place
- Greenfield, IN
- County
- Hancock County · 59,521 people
- City population
- 43,511
- Metro
- Indianapolis-Carmel-Anderson, IN
- Population (ZIP)
- 43,511
- Household income
- $83,056
- Rent vs Own
- Severe rent burden
- 795.0
Population outlook (Hancock County) Hauer SSP2
- Today (2025)
- 77,820 people
- By 2030
- 79,914 · +2.7%
- By 2040
- 82,734 · +6.3%
- By 2050
- 83,348 · +7.1%
- By 2075
- 82,439 · +5.9%
- By 2100
- 74,181 · -4.7%
Race, ethnicity, and origin ACS 2023
- Neighborhood character
- Predominantly White (92%)
- Race & ethnicity
- White 92% Two or more races 5% Hispanic / Latino 3% Black 1%
- Common ancestry
- Italian 3% Lithuanian 3% Slovak 1%
- Foreign-born
- 3% · Canada
- Languages at home
- 96% English-only · Spanish 2% Other Indo-European 1%
Political lean MEDSL · Hancock
- 2024 margin
- Solid R (+33.7) · D 32.2% · R 65.9% · Other 1.9%
- 2008→2024 swing
- -4.1pp toward R · 2008: -29.6pp · 2024: -33.7pp
- All cycles
- 2024: R+33.7 2020: R+37.5 2016: R+44.8 2012: R+41.0 2008: R+29.6
Not yet ingested
- Civics
- —
Market trends
- HPI YoY
- ▼ -131.67%
- Current HPI
- 225.0367
- Rent YoY
- ▲ 2.88%
- Metro
- Indianapolis-Carmel-Anderson, IN
- State GDP YoY
- ▲ 2.90%
- F500 in state
- 18
Industry mix (Fortune 500 HQ in IN)
| Industry | F500 HQs | Revenue |
|---|---|---|
| Industrial Machinery | 2 | $37B |
|
||
| Healthcare | 1 | $177B |
|
||
| Pharmaceuticals | 1 | $45B |
|
||
| Metals / Steel | 1 | $18B |
|
||
| Agriculture | 1 | $17B |
|
||
| Packaging | 1 | $12B |
|
||
Price history
1 event — show timeline
- 2026-06-02 Listed $264,000 MIBOR as Distributed by MLS Grid
Property tax history
-0.3%/yrLatest (2025): $790 · -82.0% YoY. Source: county tax records.
Cash-flow waterfall
monthlySold comps — $/sqft
last 12 mo · ≤1 miLoading sold comps…