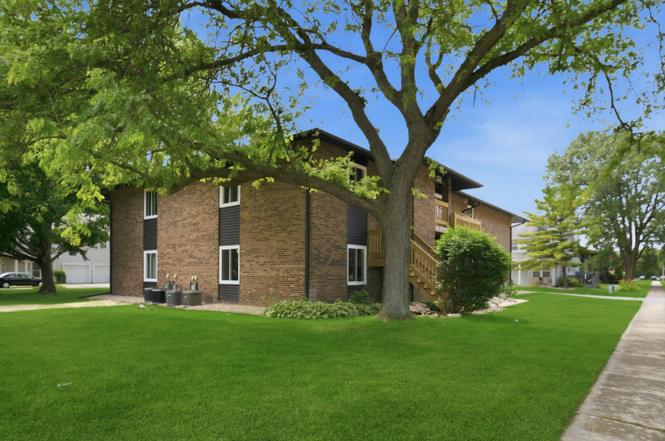
19403 Oakwood Ave #19403 · Country Club Hills, IL
Flood risk 1/10 · Minimal
- FEMA flood zone
- X (unshaded)
- Chance of flooding over 30 yrs
- 0.0%
- Est. flood insurance / yr
- $507 – $1,088
Fire risk 1/10 · Minimal
- Est. fire insurance / yr
- $804 – $1,492
Heat risk 3/10 · Minor
- Hot days now (above 101°F)
- 7 days/yr
- Hot days in 30 yrs
- 16 days/yr
Wind risk 2/10 · Minimal
- Chance of severe wind over 30 yrs
- —
Air-quality risk 2/10 · Minimal
- Unhealthy air days now
- 1 days/yr
- Unhealthy air days in 30 yrs
- 1 days/yr
Risk factors via First Street. Map © Google.
Why this score? — see what drove the C- grade
The composite is a weighted blend of 9 inputs, each scored 0–100. Each bar is that input's sub-score; the figure is the points it added to the 100-point composite (weight × sub-score).
- Cash flow +20.2/30.0
- ARV discount +7.5/15.0
- 1% rule +7.1/10.0
- DSCR +6.4/10.0
- Livability +3.8/5.0
- Rent growth +2.5/5.0
- Condition / age +2.5/5.0
- Schools +0.9/10.0
- Appreciation +0.0/10.0
$165,000
🖨 Deal sheet (PDF) 📄 Offer letter ✓ Due diligence
Listing remarks MLS
HEATED ATT GAR. & DRIVE. BEAUTIFUL FP IN SUNKEN LR. WALKIN CLOSET EASY ACCESS TO FOREST PRESERVE. LOCATED ON QUIET CUL DE SAC W/ PRIVATE BALCONY. GUEST PARKING. . BK BAR & DISHWASHER EAT IN KIT. A MUST SEE, BRING YOUR BUYERS. UNIT IS NOT FHA APPROVED
Key facts
- $225 HOA
- Garage
- Built 1980
Property features AI
Finance
- Other: School bus service available; Located in Country Club Hills (Bremen Township)
- HOA & community: Monthly association fee of $225 covering exterior maintenance, lawn care, and snow removal; Self-managed association; Pets allowed (dogs OK), maximum pet weight 50 lbs
Exterior
- Parking: Attached garage with 1 garage space; Garage owned with garage door opener; asphalt parking
- Utilities: Water source: Lake Michigan; Public sewer and storm sewer; Electric: 100 amp service
- Home design: Attached single condo; Entry level 2; Condo ownership; model: CONDO; Not currently leased; rehab in 2026
- Construction: Brick and cedar construction; Asphalt roof; Building age approximately 41–50 years; 5-unit building
- Exterior features: Patio; Common grounds
Interior
- Kitchen: Range; Microwave; Dishwasher; Refrigerator; Freezer; Pantry closet
- Bedrooms: Master bedroom on main level (13 x 11); Second bedroom on main level (9 x 12); Two additional bedrooms listed
- Flooring: Vinyl flooring throughout main living areas and bedrooms
- Bathrooms: 2 full bathrooms
- Heating & cooling: Natural gas forced-air heating; Central air conditioning
- Interior features: Walk-in closet(s); Separate dining room; 5 total rooms; Gas-log fireplace with gas starter in the family room
- Laundry & utility: In-unit laundry with washer hookup and gas dryer hookup (laundry room 8 x 6)
Neighborhood map
What this means for you Summary
Snapshot
- This is a 2-bed/2.0-bath condo listed at $165k.
Deal economics
- At list price, monthly cash flow is $208 ($2k/yr) — positive.
- The deal already cash-flows at list — no discount required.
- Meets the 1% rule at list price ($2k rent vs $165k).
Location & tenants
- Location reads 75/100 on livability (#212 in IL, #3,963 nationally) — a middle-class / working-renter tenant base. Strengths: commute A+, cost of living A+, housing A+; Watch: crime D+, health & safety D+, schools F.
- Rich Twp Hsd 227 (suburban): math 5% / reading 12% proficiency, ranked #577 of 620 in IL (top 93%) — low school quality limits family demand, transient renter base, plan for 1-2y turnover.
- Market conditions: 94 active listings in the ZIP; 6,272 units permitted in Cook County in 2024 (4,658 in 5+ unit buildings).
Forward outlook
- Local home prices are declining (-3.0%/yr); year-one equity from $1k of loan paydown is wiped out by about $5k of value loss. Plan a longer hold.
Negotiation context
- Only 2 days on market — expect competitive offers; lowballing is unlikely to land.
- 3 sale attempts since 16y ago with the ask held roughly flat each time — persistent listings suggest the price (not the market) is what's stuck; bring a comps-based counter.
- Current owner paid $60k; list at $165k implies a 175% gain — meaningful room to come down on a strong offer.
Questions for the listing agent
- What does the HOA fee cover, when was the last increase, and are there any pending special assessments or reserve-fund shortfalls?
- Any open or pending special assessments — roof, HVAC, plumbing, elevator, façade? What's the per-unit balance and payoff schedule, and is the seller paying it off at close or rolling it to the buyer?
- Is there a deadline driving the sale (1031 exchange, divorce, estate, relocation)? That informs how much negotiation room exists.
- Schools are F-rated, which usually means shorter tenancies and higher turnover. Who's the typical renter profile here, and what's been the actual vacancy rate?
- Crime grade is D in this area — have there been break-ins, vandalism, or insurance claims at this property in the last 3 years? What carrier currently insures it and at what premium?
- What's the average days-on-market for RENTAL listings here right now (not sales)? A rising rental-DOM trend means longer vacancies and softer asking-rent achievability than the comps imply.
- What's the recent tenant-quality profile in this submarket — average credit score on applications, eviction rate, late-payment / NSF rate, and stable-employment percentage? A property-management company in the area should have these aggregated.
- How much new apartment / multifamily construction is in the pipeline within 1–3 miles? Heavy new supply (>2% of stock underway) typically softens rents 12–24 months out; light construction supports rent growth.
Investment metrics
- 1% rule
- 1.21% ✓
- Cap rate
- 7.81%
- Cash-on-cash
- 5.40%
- DSCR
- 1.24
- GRM
- 6.9
CMA / ARV
No comps found within radius.
Projected returns pro-forma
-3.0% appreciation · 3.0% rent growth · sell at horizon
- IRR
- -7.8%
- Equity multiple
- 0.71×
- Total profit
- $-13,313
- Equity at exit
- $24,602
- IRR
- 1.9%
- Equity multiple
- 1.13×
- Total profit
- $6,177
- Equity at exit
- $14,266
Cash invested: $46,200 (down + closing). Projections, not guarantees.
Landlord ↔ Tenant lean methodology
- Overall (STATE)
- 43 Moderately Tenant-Leaning
- State Illinois
- 43 Moderately Tenant-Leaning · D+7
- County
- — inherits STATE
- City
- — inherits STATE
ZIP-level market 60478
- Home prices YoY
- -27.3%
- Active inventory
- 94
- Price-to-rent
- 6.9×
Monthly cashflow live
- Estimated rent
- $2,003 medium interval (Pro) →
- Mortgage (P&I)
- −$865
- Tax from tax record
- −$215 /mo · $2,584/yr
- Insurance
- −$69
- HOA
- −$225
- Vacancy / Maint / Mgmt
- −$421
- Net cashflow
- $208
Break-even live
Sensitivity live
| Price | -10% $301 | -5% $255 | +0% $208 | +5% $161 | +10% $115 |
|---|---|---|---|---|---|
| Rent | -10% $50 | -5% $129 | +0% $208 | +5% $287 | +10% $366 |
| Rate | -1.0pp $291 | -0.5pp $250 | base $208 | +0.5pp $165 | +1.0pp $122 |
UW: 25.0% down · 7.5% · 30yr · 1.5% tax · 5.0% vac · 8.0% maint · 8.0% mgmt
Financing live
Cash to close
- Down payment
- $41,250
- Closing costs
- $4,950
- Reserves months
- —
- Total cash needed
- —
Loan-product check · same deal, 3 products live
Conventional
25% down · 7.5% · 30yr
- Down + closing
- —
- Monthly P&I
- —
- Monthly cashflow
- —
- DSCR
- —
- Eligible?
- —
Personal DTI + credit; lowest rate.
DSCR
20% down · 8.5% · 30yr
- Down + closing
- —
- Monthly P&I
- —
- Monthly cashflow
- —
- DSCR
- —
- Eligible?
- —
No personal income docs; deal must DSCR.
Hard money
10% down · 12.0% · 12mo
- Down + closing
- —
- Monthly P&I
- —
- Monthly cashflow
- —
- DSCR
- —
- Eligible?
- —
Short-term bridge; refi at stabilization.
HOA detail condo
- Monthly dues
- $225 · $2,700/yr
- Assessments
- None detected in remarks — confirm with the listing agent.
Listing history 3 events
-
2026-06-18days on market $165,000 Active 2 DOM
-
2026-06-16remarks 631-char remark
-
2026-06-16$165,000 Active 1 DOM
ⓘ Source: listings_history table (triggers on properties + properties_extension) + one-shot
backfill from property_details.listing_events for pre-trigger history.
Tax reassessment forecast IL · Partial reset (capped growth)
- Current annual tax
- $2,584 · $215/mo
- Projected year-2 tax
- $3,165 · $264/mo
- Expected delta
- +$581/yr (+$48/mo · 22.5%)
ⓘ Screening estimate from a state-policy table — verify with the county assessor before closing.
Climate risk First Street
- Flood 1/10 Low FEMA zone X (unshaded) · 0% chance over 30 yrs
- Wildfire 1/10 Low
- Heat 3/10 Moderate 7 d/yr ≥101°F today · 16 d/yr by 30 yrs out
- Wind 2/10 Low
- Air quality 2/10 Low 1 unhealthy d/yr today · 1 by 30 yrs out
Nearby sold comps map
Loading sold comps map…
Walkable amenities ~0.75 mi
Loading nearby amenities…
Taxation est. · year 1
- Rental income
- $24,037
- − Mortgage interest
- −$9,243
- − Property taxes
- −$2,584
- − Insurance
- −$825
- − Repairs & maintenance
- −$1,923
- − Management
- −$1,923
- − HOA
- −$2,700
- − Depreciation
- −$4,800
- Taxable income
- $39
- Est. tax owed @ 24.0%
- −$9
- After-tax cash flow
- $2,487/yr
For passive investors: Depreciation is non-cash, so a rental often shows a tax loss while cash-flowing — sheltering income. Rental losses are passive: they offset passive income freely, and up to $25,000/yr can offset ordinary (W-2) income if you actively participate and your MAGI is under $100k (phasing out to $0 by $150k); unused losses carry forward. On sale, claimed depreciation is recaptured at up to 25%, and gains may owe capital-gains tax (a 1031 exchange can defer both). Figures are a year-1 estimate at your 24.0% rate — not tax advice; consult a CPA.
Schools (NCES district)
- District
- Rich Twp Hsd 227
- NCES district ID
- 1733420
- Math proficiency
- 5% ▼ -3.00%
- Reading proficiency
- 12% ▬ 0.00%
- Median HH income
- $56,056
- Composite
- 8.93/100
- National rank
- #9885
- State rank
- #577 of 620 in IL
Livability — Country Club Hills
- Score
- 75/100
- State rank
- #212
- US rank
- #3963
Category grades
Schools grade is shown separately in the Schools card above.
Census & demographics
- Census place
- Country Club Hills, IL
- City population
- 16,549
- Population (ZIP)
- 16,549
Population outlook (Cook County) Hauer SSP2
- Today (2025)
- 5,347,519 people
- By 2030
- 5,357,703 · +0.2%
- By 2040
- 5,324,924 · -0.4%
- By 2050
- 5,230,762 · -2.2%
- By 2075
- 4,785,735 · -10.5%
- By 2100
- 4,188,836 · -21.7%
Race, ethnicity, and origin ACS 2023
- Neighborhood character
- Predominantly Black (87%)
- Race & ethnicity
- Black 87% White 8% Hispanic / Latino 4% Two or more races 3%
- Common ancestry
- Romanian 1%
- Foreign-born
- 4% · Canada
- Languages at home
- 96% English-only · Spanish 2%
Political lean MEDSL · Cook
- 2024 margin
- Solid D (+42.0) · D 70.4% · R 28.4% · Other 1.2%
- 2008→2024 swing
- -11.4pp toward R · 2008: 53.4pp · 2024: 42.0pp
- All cycles
- 2024: D+42.0 2020: D+50.3 2016: D+53.0 2012: D+49.4 2008: D+53.4
Not yet ingested
- Civics
- —
Market trends
- HPI YoY
- ▼ -79.73%
- Current HPI
- 212.3917
- Rent YoY
- —
- Metro
- —
- State GDP YoY
- ▲ 1.59%
- F500 in state
- 60
Industry mix (Fortune 500 HQ in IL)
| Industry | F500 HQs | Revenue |
|---|---|---|
| Insurance | 4 | $201B |
|
||
| Consumer Goods | 4 | $87B |
|
||
| Industrial Machinery | 3 | $64B |
|
||
| Healthcare | 2 | $55B |
|
||
| Retail / Pharmacy | 1 | $148B |
|
||
| Agriculture / Food | 1 | $86B |
|
||
Price history
+205.6% since first listed15 events — show timeline
- 2026-06-16 Listed $165,000 MRED as Distributed by MLS Grid
- 2025-08-06 Sold (Public Records) $60,000 Public Records
- 2016-11-16 Sold (Public Records) $32,000 Public Records
- 2012-05-25 Listing Removed — MRED as Distributed by MLS Grid
- 2012-02-20 Price Changed — MRED as Distributed by MLS Grid
- 2011-12-01 Listed — MRED as Distributed by MLS Grid
- 2010-09-17 Sold (MLS) $42,500 MRED as Distributed by MLS Grid
- 2010-08-27 Pending — MRED as Distributed by MLS Grid
- 2010-07-29 Listed $42,500 MRED as Distributed by MLS Grid
- 2005-12-01 Sold (Public Records) $117,000 Public Records
- 2005-12-01 Sold (Public Records) $117,000 Public Records
- 2002-06-13 Sold (Public Records) $876,000 Public Records
- 1987-07-01 Sold (Public Records) $47,500 Public Records
- 1985-10-31 Sold (Public Records) $54,000 Public Records
- 1985-08-01 Sold (Public Records) $54,000 Public Records
Property tax history
+0.5%/yrLatest (2023): $2,584 · -25.9% YoY. Source: county tax records.
Cash-flow waterfall
monthlySold comps — $/sqft
last 12 mo · ≤1 miLoading sold comps…