 Multi-family
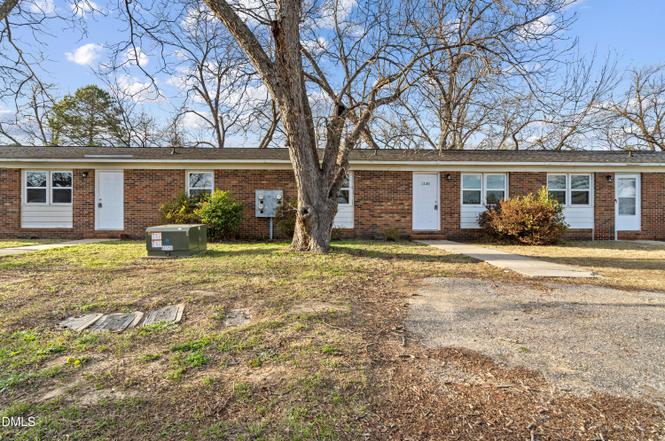
1218 Southwood Dr Unit 1218, 1220, 1222, 1224 · Fayetteville, NC
Flood risk 1/10 · Minimal
- FEMA flood zone
- X (unshaded)
- Chance of flooding over 30 yrs
- 0.0%
- Est. flood insurance / yr
- $507 – $1,088
Fire risk 4/10 · Minor
- Est. fire insurance / yr
- $906 – $1,684
Heat risk 7/10 · Major
- Hot days now (above 107°F)
- 7 days/yr
- Hot days in 30 yrs
- 16 days/yr
Wind risk 7/10 · Major
- Chance of severe wind over 30 yrs
- 75.0%
Air-quality risk 1/10 · Minimal
- Unhealthy air days now
- 0 days/yr
- Unhealthy air days in 30 yrs
- 0 days/yr
Risk factors via First Street. Map © Google.
Why this score? — see what drove the C grade
The composite is a weighted blend of 9 inputs, each scored 0–100. Each bar is that input's sub-score; the figure is the points it added to the 100-point composite (weight × sub-score).
- Cash flow +23.9/30.0
- DSCR +7.7/10.0
- ARV discount +7.5/15.0
- 1% rule +6.2/10.0
- Livability +3.8/5.0
- Condition / age +3.8/5.0
- Rent growth +3.3/5.0
- Schools +3.1/10.0
- Appreciation +0.0/10.0
$379,900
🖨 Deal sheet (PDF) 📄 Offer letter ✓ Due diligence
Multi-family units
County records classify this as Multi-Family (2-4 Unit). Listing-text estimate: 1 unit. estimate disagrees with records
Listing remarks
Investment opportunity on Southwood Dr featuring a four-unit residential property with strong rental potential. Each unit offers a functional layout with practical living space. Property includes multiple units on one parcel and is conveniently located near local amenities, shopping, dining, and major commuter routes. Please contact listing agent for additional information regarding leases, financials, and showings. Please do not disturb tenants.
Key facts
- Shopping
- Functional layout
- 0.49 acre lot
Tags
Property features AI
Finance
- Other: Living area approximately 3,509 (total building area); Unit numbers: 1218, 1220, 1222, 1224
- Financial info: Four total units; Owner pays exterior maintenance, grounds care, HVAC maintenance, insurance, management, pest control, repairs, sewer, and water
- HOA & community: No association
Exterior
- Parking: Other type parking
- Utilities: Public water; Public sewer and septic tank
- Home design: Quadruplex; One level
- Construction: Brick veneer and other construction materials; Built as a multi-unit structure
- Exterior features: Shingle roof; Lot approximately 0.49 acres; Public maintained road access
Interior
- Bedrooms: 2 bedrooms (total across units)
- Flooring: Vinyl
- Bathrooms: 1 full bathroom; 1 half bathroom
- Heating & cooling: Heat pump heating; Central air conditioning
- Interior features: Vinyl flooring
Neighborhood map
What this means for you Summary
Snapshot
- This is a 2-bed/1.5-bath multifamily listed at $380k. Condition is rated good.
Deal economics
- At list price, monthly cash flow is $736 ($9k/yr) — positive.
- The deal already cash-flows at list — no discount required.
- Meets the 1% rule at list price ($4k rent vs $380k).
- Recommended offer: $346k (9.0% below list) — sets the bar for market timing.
- Cap rate 8.6% vs local median 4.9% in Fayetteville — top-decile yield for the area; either an underpriced asset or a hidden risk that comps aren't pricing in. Stress-test before assuming the spread holds.
Location & tenants
- Location reads 75/100 on livability (#45 in NC, #4,031 nationally) — a middle-class / working-renter tenant base. Strengths: commute A+, cost of living A+, housing A+; Watch: schools C-, crime F, employment D-.
- Cumberland County Schools (urban): math 32% / reading 41% proficiency, ranked #126 of 178 in NC (top 71%) — families likely to look elsewhere, expect single-tenant / working-renter base with shorter leases.
- Market conditions: Rents rising (+3.2%/yr); 302 active listings in the ZIP; 1,125 units permitted in Cumberland County in 2024 (104 in 5+ unit buildings).
- At $4,255/mo this rent would consume 87% of the median local household income ($59k/yr) (locally 1667% of renters already pay >50% of income on rent) — very limited rent-growth headroom before tenants either downsize or default.
Forward outlook
- Local home prices are declining (-3.0%/yr); year-one equity from $3k of loan paydown is wiped out by about $11k of value loss. Plan a longer hold.
Negotiation context
- It's been on market 92 days — a 9% lower offer ($346k) is reasonable based on typical stale-listing flexibility.
- 2 sale attempts with the ask held roughly flat each time — persistent listings suggest the price (not the market) is what's stuck; bring a comps-based counter.
Risks & watch-outs
- Climate carrying-cost: major wind risk, 75% chance of damaging wind over 30y; extreme-heat days projected 7→16/yr by 2055 (HVAC capex compounding) — expect insurance premiums to compound above CPI over the hold.
Questions for the listing agent
- It's been on market 92 days. Have you received any prior offers? Is the seller open to a 9% concession, seller financing, or rate buy-down credit?
- Built in 1973 — when were the roof, HVAC, electrical panel, plumbing, and water heater last replaced?
- Why hasn't it sold? Are there any deal-killer items the seller is aware of (foundation, flood, title, zoning, code violations)?
- Is there a deadline driving the sale (1031 exchange, divorce, estate, relocation)? That informs how much negotiation room exists.
- Crime grade is F in this area — have there been break-ins, vandalism, or insurance claims at this property in the last 3 years? What carrier currently insures it and at what premium?
- What's the average days-on-market for RENTAL listings here right now (not sales)? A rising rental-DOM trend means longer vacancies and softer asking-rent achievability than the comps imply.
- What's the recent tenant-quality profile in this submarket — average credit score on applications, eviction rate, late-payment / NSF rate, and stable-employment percentage? A property-management company in the area should have these aggregated.
- How much new apartment / multifamily construction is in the pipeline within 1–3 miles? Heavy new supply (>2% of stock underway) typically softens rents 12–24 months out; light construction supports rent growth.
Investment metrics
- 1% rule
- 1.12% ✓
- Cap rate
- 8.62%
- Cash-on-cash
- 8.30%
- DSCR
- 1.37
- GRM
- 7.4
CMA / ARV
No comps found within radius.
Projected returns pro-forma
-3.0% appreciation · 3.17% rent growth · sell at horizon
- IRR
- -3.5%
- Equity multiple
- 0.87×
- Total profit
- $-13,888
- Equity at exit
- $56,644
- IRR
- 6.4%
- Equity multiple
- 1.48×
- Total profit
- $51,534
- Equity at exit
- $32,847
Cash invested: $106,372 (down + closing). Projections, not guarantees.
Landlord ↔ Tenant lean methodology
- Overall (STATE)
- 85 Strongly Landlord-Friendly
- State North Carolina
- 85 Strongly Landlord-Friendly · R+3
- County
- — inherits STATE
- City
- — inherits STATE
ZIP-level market 28304
- Home prices YoY
- -21.7%
- Rents YoY
- 3.2%
- Active inventory
- 302
- Price-to-rent
- 29.8×
Monthly cashflow live
- Estimated rent
- $4,255 high interval (Pro) →
- Mortgage (P&I)
- −$1,992
- Tax est. 1.5%
- −$475 /mo · $5,698/yr
- Insurance
- −$158
- HOA
- −$0
- Vacancy / Maint / Mgmt
- −$894
- Net cashflow
- $736
Break-even live
Sensitivity live
| Price | -10% $999 | -5% $867 | +0% $736 | +5% $605 | +10% $474 |
|---|---|---|---|---|---|
| Rent | -10% $400 | -5% $568 | +0% $736 | +5% $904 | +10% $1,072 |
| Rate | -1.0pp $927 | -0.5pp $833 | base $736 | +0.5pp $638 | +1.0pp $537 |
4-unit breakdown (identical units grouped — click to expand)
| Units | Beds | Baths | Est. rent |
|---|---|---|---|
| 4× units | 2 | 1 | $4,256 |
| #1 | 2 | 1 | $1,064 |
| #2 | 2 | 1 | $1,064 |
| #3 | 2 | 1 | $1,064 |
| #4 | 2 | 1 | $1,064 |
| Total (4 units) | $4,255 | ||
UW: 25.0% down · 7.5% · 30yr · 1.5% tax · 5.0% vac · 8.0% maint · 8.0% mgmt
Financing live
Cash to close
- Down payment
- $94,975
- Closing costs
- $11,397
- Reserves months
- —
- Total cash needed
- —
Loan-product check · same deal, 3 products live
Conventional
25% down · 7.5% · 30yr
- Down + closing
- —
- Monthly P&I
- —
- Monthly cashflow
- —
- DSCR
- —
- Eligible?
- —
Personal DTI + credit; lowest rate.
DSCR
20% down · 8.5% · 30yr
- Down + closing
- —
- Monthly P&I
- —
- Monthly cashflow
- —
- DSCR
- —
- Eligible?
- —
No personal income docs; deal must DSCR.
Hard money
10% down · 12.0% · 12mo
- Down + closing
- —
- Monthly P&I
- —
- Monthly cashflow
- —
- DSCR
- —
- Eligible?
- —
Short-term bridge; refi at stabilization.
Listing history 18 events
-
2026-06-18days on market $379,900 Active 92 DOM
-
2026-06-17days on market $379,900 Active 91 DOM
-
2026-06-16days on market $379,900 Active 90 DOM
-
2026-06-15days on market $379,900 Active 89 DOM
-
2026-06-14days on market $379,900 Active 87 DOM
-
2026-06-13days on market $379,900 Active 86 DOM
-
2026-06-10days on market $379,900 Active 84 DOM
-
2026-06-09days on market $379,900 Active 83 DOM
-
2026-06-08days on market $379,900 Active 82 DOM
-
2026-06-07days on market $379,900 Active 81 DOM
-
2026-06-03days on market $379,900 Active 77 DOM
-
2026-06-02days on market $379,900 Active 76 DOM
-
2026-06-01days on market $379,900 Active 75 DOM
-
2026-05-31days on market $379,900 Active 74 DOM
-
2026-05-30days on market $379,900 Active 73 DOM
-
2026-04-02status Active
-
2026-03-24status Pending
-
2026-03-06$379,900 Active
ⓘ Source: listings_history table (triggers on properties + properties_extension) + one-shot
backfill from property_details.listing_events for pre-trigger history.
Climate risk First Street
- Flood 1/10 Low FEMA zone X (unshaded) · 0% chance over 30 yrs
- Wildfire 4/10 Moderate
- Heat 7/10 Severe 7 d/yr ≥107°F today · 16 d/yr by 30 yrs out
- Wind 7/10 Severe 75% chance of damaging wind over 30 yrs
- Air quality 1/10 Low 0 unhealthy d/yr today · 0 by 30 yrs out
Nearby sold comps map
Loading sold comps map…
Walkable amenities ~0.75 mi
Loading nearby amenities…
Taxation est. · year 1
- Rental income
- $51,060
- − Mortgage interest
- −$21,280
- − Property taxes
- −$5,698
- − Insurance
- −$1,900
- − Repairs & maintenance
- −$4,085
- − Management
- −$4,085
- − Depreciation
- −$11,052
- Taxable income
- $2,960
- Est. tax owed @ 24.0%
- −$711
- After-tax cash flow
- $8,122/yr
For passive investors: Depreciation is non-cash, so a rental often shows a tax loss while cash-flowing — sheltering income. Rental losses are passive: they offset passive income freely, and up to $25,000/yr can offset ordinary (W-2) income if you actively participate and your MAGI is under $100k (phasing out to $0 by $150k); unused losses carry forward. On sale, claimed depreciation is recaptured at up to 25%, and gains may owe capital-gains tax (a 1031 exchange can defer both). Figures are a year-1 estimate at your 24.0% rate — not tax advice; consult a CPA.
Condition & rehab AI · 14 photos
This four-unit property is in good condition with a good condition score of 75. It has a cosmetic rehab level and requires minor maintenance. The highest-ROI updates are painting the exterior trim and pruning trees to enhance curb appeal and property value.
Value-add opportunities
- Both Paint exterior trim — Enhances curb appeal and property value
- Both Prune trees — Improves curb appeal and natural light
Renovation cost estimate screening
Value-add ROI direction
- Both Paint exterior trim — Enhances curb appeal and property value ↑
- Both Prune trees — Improves curb appeal and natural light ↑
ⓘ Cost ranges are severity-bucket heuristics (US national rule-of-thumb). Get contractor quotes + a written scope before underwriting a rehab budget.
Schools (NCES district)
- District
- Cumberland County Schools
- NCES district ID
- 3700011
- Math proficiency
- 32% ▼ -2.00%
- Reading proficiency
- 41% ▼ -1.00%
- Median HH income
- $44,168
- Composite
- 31.0/100
- National rank
- #6096
- State rank
- #126 of 178 in NC
Livability — Fayetteville
- Score
- 75/100
- State rank
- #45
- US rank
- #4031
Category grades
Schools grade is shown separately in the Schools card above.
Census & demographics
- Census place
- Fayetteville, NC
- County
- Cumberland County · 265,314 people
- City population
- 226,118
- Metro
- Fayetteville, NC
- Population (ZIP)
- 37,140
- Household income
- $58,563
- Rent vs Own
- Severe rent burden
- 1667.0
Population outlook (Cumberland County) Hauer SSP2
- Today (2025)
- 330,855 people
- By 2030
- 333,523 · +0.8%
- By 2040
- 335,583 · +1.4%
- By 2050
- 335,325 · +1.4%
- By 2075
- 342,853 · +3.6%
- By 2100
- 340,698 · +3.0%
Race, ethnicity, and origin ACS 2023
- Neighborhood character
- Highly diverse neighborhood (Simpson 0.70)
- Race & ethnicity
- Black 39% White 36% Hispanic / Latino 14% Two or more races 12% Asian 3% Native American 1%
- Hispanic origin (detail)
- Mexican 5% Puerto Rican 5%
- Common ancestry
- Slovak 2% Italian 1% Serbian 1%
- Foreign-born
- 8% · Canada, South Korea, Vietnam
- Languages at home
- 87% English-only · Spanish 9% Tagalog/Filipino 1% French/Haitian/Cajun 1%
Political lean MEDSL · Cumberland
- 2024 margin
- D (+13.4) · D 56.1% · R 42.7% · Other 1.2%
- 2008→2024 swing
- -4.3pp toward R · 2008: 17.7pp · 2024: 13.4pp
- All cycles
- 2024: D+13.4 2020: D+16.6 2016: D+16.0 2012: D+19.7 2008: D+17.7
Not yet ingested
- Civics
- —
Market trends
- HPI YoY
- ▼ -59.90%
- Current HPI
- 215.927
- Rent YoY
- ▲ 3.17%
- Metro
- Fayetteville, NC
- State GDP YoY
- ▲ 3.28%
- F500 in state
- 26
Industry mix (Fortune 500 HQ in NC)
| Industry | F500 HQs | Revenue |
|---|---|---|
| Financial Services | 2 | $213B |
|
||
| Retail | 2 | $95B |
|
||
| Industrial Conglomerate | 1 | $38B |
|
||
| Metals / Steel | 1 | $35B |
|
||
| Utilities | 1 | $30B |
|
||
| Industrial Machinery | 1 | $19B |
|
||
Price history
3 events — show timeline
- 2026-04-02 Relisted — TMLS
- 2026-03-24 Pending — TMLS
- 2026-03-06 Listed $379,900 TMLS
Cash-flow waterfall
monthlySold comps — $/sqft
last 12 mo · ≤1 miLoading sold comps…