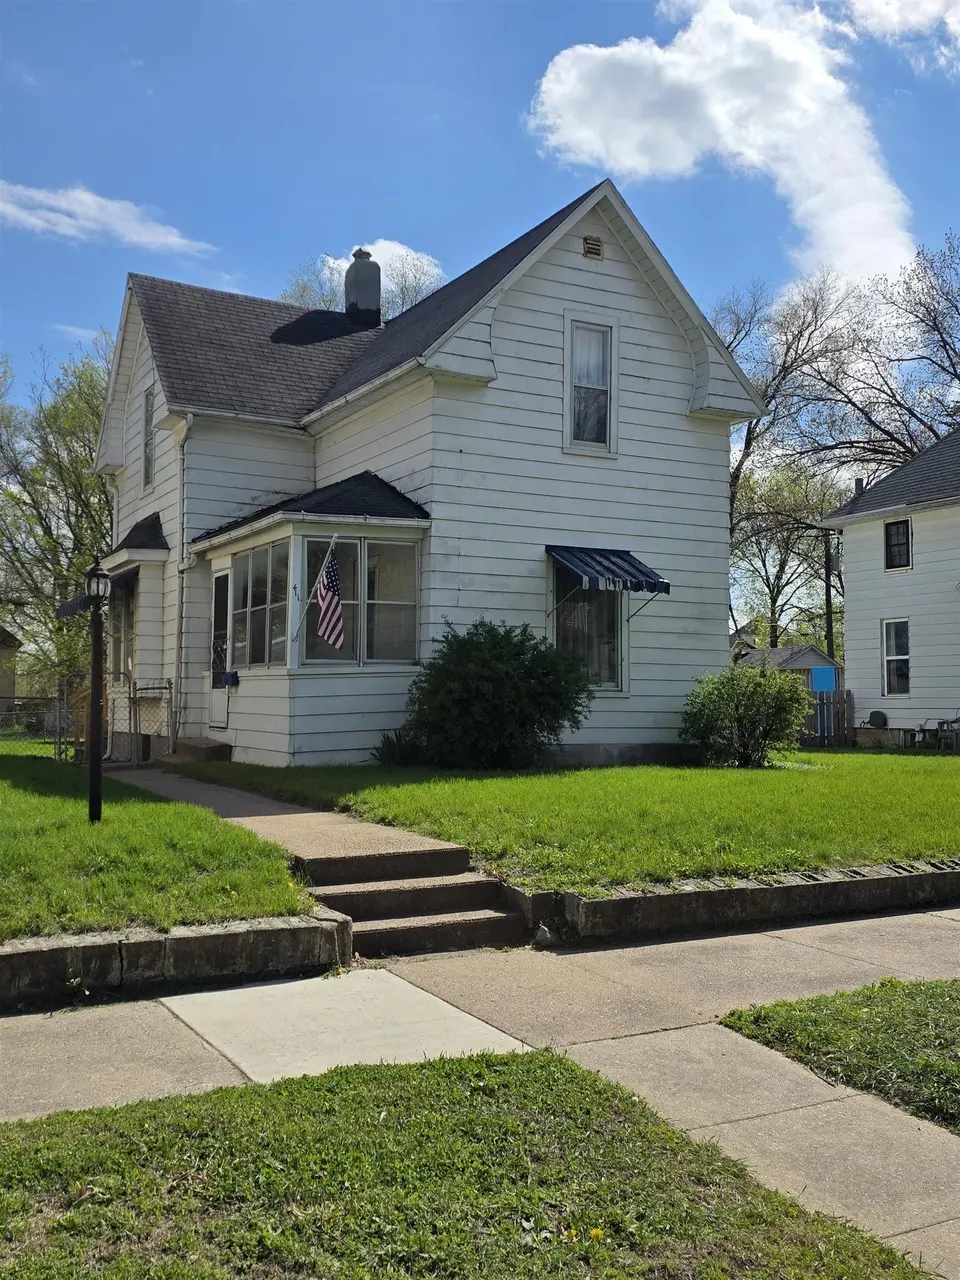
411 Edwards St · Waterloo, IA
Flood risk 1/10 · Minimal
- FEMA flood zone
- X
- Chance of flooding over 30 yrs
- 0.0%
- Est. flood insurance / yr
- $473 – $860
Fire risk 1/10 · Minimal
- Est. fire insurance / yr
- $902 – $1,676
Heat risk 3/10 · Minor
- Hot days now (above 101°F)
- 7 days/yr
- Hot days in 30 yrs
- 16 days/yr
Wind risk 2/10 · Minimal
- Chance of severe wind over 30 yrs
- —
Air-quality risk 1/10 · Minimal
- Unhealthy air days now
- 0 days/yr
- Unhealthy air days in 30 yrs
- 0 days/yr
Risk factors via First Street. Map © Google.
Why this score? — see what drove the C+ grade
The composite is a weighted blend of 9 inputs, each scored 0–100. Each bar is that input's sub-score; the figure is the points it added to the 100-point composite (weight × sub-score).
- Cash flow +28.7/30.0
- DSCR +10.0/10.0
- 1% rule +7.4/10.0
- Schools +4.4/10.0
- Rent growth +4.2/5.0
- Livability +4.0/5.0
- Condition / age +2.5/5.0
- ARV discount +0.0/15.0
- Appreciation +0.0/10.0
$74,999
🖨 Deal sheet (PDF) 📄 Offer letter ✓ Due diligence
Listing remarks
Welcome to 411 Edwards St. in Waterloo, IA—a move-in ready two-story home that blends classic charm with practical updates. This inviting property features 3 bedrooms and 1.5 baths, including a convenient main-floor bedroom and two additional bedrooms upstairs alongside an updated full bath. The kitchen has been refreshed with bright white cabinetry, offering a clean and modern feel, while the main-floor laundry room with a half bath adds everyday convenience. You’ll appreciate the dedicated dining room and comfortable living room, both showcasing original hardwood floors that add warmth and character. Enjoy your morning coffee on the cozy three-season porch just off the front d
Key facts
- Three season porch
- Move in ready
- Fenced in yard
Tags
Property features AI
Finance
- HOA & community: Sidewalks in the community
Exterior
- Parking: Carport (2 spaces); Detached garage with garage door opener
- Utilities: Public water; Public sewer
- Home design: Single-family residential property; R-2 zoning
- Construction: Aluminum siding; Shingle (asphalt) roof
- Exterior features: Enclosed patio/porch; Fenced yard; Concrete road access
Interior
- Bathrooms: 1 full bathroom; 1 half bathroom
- Heating & cooling: Central air conditioning; Forced air heating (natural gas)
- Interior features: No fireplace; Unfinished basement with interior entry
- Laundry & utility: Washer hookup on main level; Gas dryer hookup on main level
Neighborhood map
What this means for you Summary
Snapshot
- This is a 3-bed/2.0-bath single-family listed at $75k.
Deal economics
- At list price, monthly cash flow is $249 ($3k/yr) — positive.
- The deal already cash-flows at list — no discount required.
- Meets the 1% rule at list price ($928 rent vs $75k).
- Cap rate 10.3% vs local median 4.2% in Waterloo — top-decile yield for the area; either an underpriced asset or a hidden risk that comps aren't pricing in. Stress-test before assuming the spread holds.
Location & tenants
- Location reads 81/100 on livability (#74 in IA, #1,589 nationally) — a professional / high-income tenant draw. Strengths: commute A+, cost of living A+, housing A+; Watch: crime F, employment D-.
- Waterloo Community School District (urban): math 50% / reading 54% proficiency, ranked #276 of 289 in IA (top 96%) — acceptable for families but not a draw, mixed tenant base, ~2y average lease.
- Zoned schools: Fred Becker Elementary School (math 57% / reading 47%, grade C-, #494 of 616 statewide, top 83%, 473 students, 76% FRL); Central Middle School (math 49% / reading 46%, grade C-, #226 of 246 statewide, top 92%, 471 students, 85% FRL); West High School (math 55% / reading 63%, grade C+, #273 of 336 statewide, top 81%, 1,652 students, 62% FRL) — zoned schools average 75% FRL vs 58% district-wide (16 pts higher); higher-poverty schools than district average — tighter screening recommended.
- Market conditions: Rents rising fast (+6.7%/yr); 99 active listings in the ZIP; 31 comparable units currently listed for rent nearby; rentals lingering (median 45d on market — plan ~5-8 weeks vacancy on turnover, expect pricing pressure); 71% of comp listings sitting > 30 days — soft ceiling on asking rent; 287 units permitted in Black Hawk County in 2024 (67 in 5+ unit buildings).
Forward outlook
- Local home prices are declining (-3.0%/yr); year-one equity from $518 of loan paydown is wiped out by about $2k of value loss. Plan a longer hold.
- Black Hawk County population projected at +10% by 2050 — modest demand growth; plan on rents tracking national, not racing it.
- At projected returns (-3.0% appreciation + 6.7% rent growth), your $21k cash investment doubles in ~7 years — after that, you're playing with house money.
Negotiation context
- Only 3 days on market — expect competitive offers; lowballing is unlikely to land.
Risks & watch-outs
- Watch-outs: built in 1899 — expect roof / HVAC / electrical / plumbing capex.
Questions for the listing agent
- Built in 1899 — when were the roof, HVAC, electrical panel, plumbing, and water heater last replaced?
- Is there a deadline driving the sale (1031 exchange, divorce, estate, relocation)? That informs how much negotiation room exists.
- Crime grade is F in this area — have there been break-ins, vandalism, or insurance claims at this property in the last 3 years? What carrier currently insures it and at what premium?
- What's the average days-on-market for RENTAL listings here right now (not sales)? A rising rental-DOM trend means longer vacancies and softer asking-rent achievability than the comps imply.
- What's the recent tenant-quality profile in this submarket — average credit score on applications, eviction rate, late-payment / NSF rate, and stable-employment percentage? A property-management company in the area should have these aggregated.
- How much new for-sale + rental construction is in the pipeline within 1–3 miles? Heavy new supply typically softens prices + rents 12–24 months out; constrained supply supports both.
Investment metrics
- 1% rule
- 1.24% ✓
- Cap rate
- 10.27%
- Cash-on-cash
- 14.20%
- DSCR
- 1.63
- GRM
- 6.7
CMA / ARV
- ARV (median comp)
- $55,295
- List price
- $74,999
- Delta
- 35.63%
- Verdict
- OVERPRICED
- Comps
- 20 within 1.0 mi
Show comp detail 12 sales within ~0.75 mi
| Address | Dist | Beds/Ba | Sqft | Sold | Price | $/sf | Match |
|---|---|---|---|---|---|---|---|
| 307 Center St | 0.10mi | 3/1.0 | 930 (-6%) | 1mo | $63,000 | $68 | 80 |
| 232 Center St | 0.15mi | 2/1.0 (-1) | 1,060 (+7%) | 1mo | $32,000 | $30 | 72 |
| 542 Kern St | 0.40mi | 3/1.0 | 1,052 (+6%) | 6mo | $35,000 | $33 | 62 |
| 1030 Columbia St | 0.43mi | 3/1.0 | 1,050 (+6%) | 8mo | $124,900 | $119 | 60 |
| 233 Oliver St | 0.74mi | 3/1.0 | 1,006 (+1%) | 1mo | $125,000 | $124 | 58 |
| 68 E Parker St St | 0.57mi | 2/1.0 (-1) | 1,046 (+5%) | 2mo | $82,000 | $78 | 54 |
| 817 Grandview Ave | 0.45mi | 3/1.0 | 1,115 (+12%) | 3mo | $115,000 | $103 | 52 |
| 545 W Parker St St | 0.48mi | 3/1.0 | 1,090 (+10%) | 7mo | $71,500 | $66 | 51 |
| 533 Reed St | 0.65mi | 4/2.0 (+1) | 1,076 (+8%) | 1mo | $60,000 | $56 | 49 |
| 806 Conger St St | 0.52mi | 3/1.0 | 1,140 (+15%) | 2mo | $85,000 | $75 | 45 |
| 1036 Columbia St | 0.44mi | 2/1.0 (-1) | 848 (-14%) | 4mo | $60,000 | $71 | 44 |
| 748 Conger St | 0.49mi | 2/1.0 (-1) | 864 (-13%) | 5mo | $60,000 | $69 | 42 |
Match score weights: distance 35% · size 25% · config 20% · recency 20%. Top-matched comps best support the ARV.
Projected returns pro-forma
-3.0% appreciation · 6.67% rent growth · sell at horizon
- IRR
- 8.4%
- Equity multiple
- 1.34×
- Total profit
- $7,225
- Equity at exit
- $11,183
- IRR
- 20.5%
- Equity multiple
- 3.02×
- Total profit
- $42,375
- Equity at exit
- $6,485
Cash invested: $21,000 (down + closing). Projections, not guarantees.
Landlord ↔ Tenant lean methodology
- Overall (STATE)
- 83 Strongly Landlord-Friendly
- State Iowa
- 83 Strongly Landlord-Friendly · R+6
- County
- — inherits STATE
- City
- — inherits STATE
ZIP-level market 50703
- Rents YoY
- 6.7%
- Active inventory
- 99
- Price-to-rent
- 6.7×
Monthly cashflow live
- Estimated rent
- $928 high interval (Pro) →
- Mortgage (P&I)
- −$393
- Tax from tax record
- −$60 /mo · $720/yr
- Insurance
- −$31
- HOA
- −$0
- Vacancy / Maint / Mgmt
- −$195
- Net cashflow
- $249
Break-even live
Sensitivity live
| Price | -10% $291 | -5% $270 | +0% $249 | +5% $227 | +10% $206 |
|---|---|---|---|---|---|
| Rent | -10% $175 | -5% $212 | +0% $249 | +5% $285 | +10% $322 |
| Rate | -1.0pp $286 | -0.5pp $268 | base $249 | +0.5pp $229 | +1.0pp $209 |
UW: 25.0% down · 7.5% · 30yr · 1.5% tax · 5.0% vac · 8.0% maint · 8.0% mgmt
Financing live
Cash to close
- Down payment
- $18,750
- Closing costs
- $2,250
- Reserves months
- —
- Total cash needed
- —
Loan-product check · same deal, 3 products live
Conventional
25% down · 7.5% · 30yr
- Down + closing
- —
- Monthly P&I
- —
- Monthly cashflow
- —
- DSCR
- —
- Eligible?
- —
Personal DTI + credit; lowest rate.
DSCR
20% down · 8.5% · 30yr
- Down + closing
- —
- Monthly P&I
- —
- Monthly cashflow
- —
- DSCR
- —
- Eligible?
- —
No personal income docs; deal must DSCR.
Hard money
10% down · 12.0% · 12mo
- Down + closing
- —
- Monthly P&I
- —
- Monthly cashflow
- —
- DSCR
- —
- Eligible?
- —
Short-term bridge; refi at stabilization.
Rent comps 31 comps
| Address | Beds | Baths | Sqft | Rent | $/sqft | DOM | Units | Dist |
|---|---|---|---|---|---|---|---|---|
| 314 Conger St Waterloo, IA | 2.0 | 1.0 | 840 | $875 | $1.04 | 45d | 1 | 0.17mi |
| 307 Riehl St Waterloo, IA | 2.0 | 1.0 | 640 | $825 | $1.29 | 22d | 1 | 0.21mi |
| 118 Harrison St Waterloo, IA | 2.0 | 1.0 | 600 | $500 | $0.83 | 45d | 1 | 0.30mi |
| 657 Dawson St Waterloo, IA | 2.0 | 1.0 | 692 | $810 | $1.17 | 45d | 1 | 0.44mi |
| 661 Dawson St Waterloo, IA | 2.0 | 1.0 | 704 | $895 | $1.27 | 22d | 1 | 0.45mi |
| 401 Argyle St Waterloo, IA | 2.0 | 1.0 | 800 | $800 | $1.00 | 45d | 1 | 0.47mi |
| 1132 Ackermant St Waterloo, IA | 2.0 | 1.0 | 685 | $825 | $1.20 | 45d | 1 | 0.53mi |
| 1148 Columbia St Waterloo, IA | 2.0 | 1.0 | 816 | $850 | $1.04 | 45d | 1 | 0.56mi |
| 303 Franklin St Apt 2 Waterloo, IA | 2.0 | 1.0 | 600 | $650 | $1.08 | 45d | 1 | 0.62mi |
| 306 Charles St Waterloo, IA | 3.0 | 1.0 | 916 | $925 | $1.01 | 45d | 1 | 0.79mi |
| 45 W Jefferson St Waterloo, IA | 1.0–2.0 | 1.0–2.0 | 1062 | $1,750 | $1.65 | 22d | 9 | 0.83mi |
| 520 Lafayette St Unit A Waterloo, IA | 2.0 | 1.0 | 800 | $750 | $0.94 | 45d | 1 | 0.84mi |
| 322 Lester St Waterloo, IA | 2.0 | 1.0 | 672 | $850 | $1.26 | 45d | 1 | 0.86mi |
| W Mullan Ave Waterloo, IA | 2.0 | 1.0 | 918 | $710 | $0.77 | 45d | 2 | 0.98mi |
| 1124 Kern St Waterloo, IA | 2.0 | 1.0 | 740 | $950 | $1.28 | 45d | 1 | 0.99mi |
| 613 Hope Ave Waterloo, IA | 2.0 | 1.0 | 812 | $795 | $0.98 | 45d | 1 | 1.04mi |
| 910 Mulberry St Apt 3 Waterloo, IA | 2.0 | 1.0 | 1064 | $695 | $0.65 | 22d | 1 | 1.07mi |
| 824 Sycamore St Unit 824-09 Waterloo, IA | 2.0 | 2.0 | 1054 | $1,250 | $1.19 | 45d | 1 | 1.09mi |
| 408 E 8th St Waterloo, IA | 3.0 | 1.0 | 600 | $850 | $1.42 | 45d | 1 | 1.13mi |
| 405 W Donald St Waterloo, IA | 2.0–3.0 | 1.0 | 880 | $1,000 | $1.14 | 22d | 4 | 1.14mi |
| 920-928 Sycamore St Unit 920-07 Waterloo, IA | 2.0 | 2.0 | 1054 | $1,250 | $1.19 | 45d | 1 | 1.14mi |
| 924 Sycamore St #1 Waterloo, IA | 2.0 | 2.0 | 1054 | $1,250 | $1.19 | 45d | 1 | 1.15mi |
| 716 Beech St Waterloo, IA | 2.0 | 1.0 | 672 | $875 | $1.30 | 45d | 1 | 1.20mi |
| 739 Sherman Ave Waterloo, IA | 3.0 | 1.0 | 875 | $925 | $1.06 | 45d | 1 | 1.22mi |
| 425 Glenwood St Waterloo, IA | 2.0 | 1.0 | 846 | $825 | $0.98 | 22d | 1 | 1.23mi |
| 820 W 2nd St Apt 2 Waterloo, IA | 2.0 | 1.5 | 1100 | $695 | $0.63 | 45d | 1 | 1.29mi |
| 1254 W Mullan Ave Unit 1254 Waterloo, IA | 2.0 | 1.0 | 864 | $775 | $0.90 | 22d | 1 | 1.29mi |
| 706 South St Unit B Waterloo, IA | 2.0 | 1.0 | 750 | $635 | $0.85 | 22d | 1 | 1.32mi |
| 706 South St Waterloo, IA | 2.0 | 1.0 | 750 | $675 | $0.90 | 45d | 1 | 1.32mi |
| 1272 W Mullan Ave Unit 1272 Waterloo, IA | 2.0 | 1.0 | 864 | $825 | $0.95 | 22d | 1 | 1.33mi |
| 136 Janney Ave Waterloo, IA | 2.0 | 2.0 | 901 | $1,325 | $1.47 | 45d | 1 | 1.43mi |
Listing history 2 events
-
2026-05-06status Pending 1085-char remark
-
2026-05-01$74,999 Active 1085-char remark
ⓘ Source: listings_history table (triggers on properties + properties_extension) + one-shot
backfill from property_details.listing_events for pre-trigger history.
Tax reassessment forecast IA · Partial reset (capped growth)
- Current annual tax
- $720 · $60/mo
- Projected year-2 tax
- $949 · $79/mo
- Expected delta
- +$229/yr (+$19/mo · 31.8%)
ⓘ Screening estimate from a state-policy table — verify with the county assessor before closing.
Climate risk First Street
- Flood 1/10 Low FEMA zone X · 0% chance over 30 yrs
- Wildfire 1/10 Low
- Heat 3/10 Moderate 7 d/yr ≥101°F today · 16 d/yr by 30 yrs out
- Wind 2/10 Low
- Air quality 1/10 Low 0 unhealthy d/yr today · 0 by 30 yrs out
Nearby sold comps map
Loading sold comps map…
Walkable amenities ~0.75 mi
Loading nearby amenities…
Taxation est. · year 1
- Rental income
- $11,136
- − Mortgage interest
- −$4,201
- − Property taxes
- −$720
- − Insurance
- −$375
- − Repairs & maintenance
- −$891
- − Management
- −$891
- − Depreciation
- −$2,182
- Taxable income
- $1,876
- Est. tax owed @ 24.0%
- −$450
- After-tax cash flow
- $2,533/yr
For passive investors: Depreciation is non-cash, so a rental often shows a tax loss while cash-flowing — sheltering income. Rental losses are passive: they offset passive income freely, and up to $25,000/yr can offset ordinary (W-2) income if you actively participate and your MAGI is under $100k (phasing out to $0 by $150k); unused losses carry forward. On sale, claimed depreciation is recaptured at up to 25%, and gains may owe capital-gains tax (a 1031 exchange can defer both). Figures are a year-1 estimate at your 24.0% rate — not tax advice; consult a CPA.
Schools (NCES district)
- District
- Waterloo Community School District
- NCES district ID
- 1930480
- Math proficiency
- 50% ▼ -4.00%
- Reading proficiency
- 54% ▲ 1.00%
- Median HH income
- $42,545
- Composite
- 43.72/100
- National rank
- #2950
- State rank
- #276 of 289 in IA
Livability — Waterloo
- Score
- 81/100
- State rank
- #74
- US rank
- #1589
Category grades
Schools grade is shown separately in the Schools card above.
Census & demographics
- Census place
- Waterloo, IA
- County
- Black Hawk County · 112,933 people
- City population
- 69,066
- Metro
- Waterloo-Cedar Falls, IA
- Population (ZIP)
- 17,952
- Household income
- $50,060
- Rent vs Own
- Severe rent burden
- 871.0
Population outlook (Black Hawk County) Hauer SSP2
- Today (2025)
- 139,716 people
- By 2030
- 142,853 · +2.2%
- By 2040
- 147,843 · +5.8%
- By 2050
- 153,247 · +9.7%
- By 2075
- 167,977 · +20.2%
- By 2100
- 177,320 · +26.9%
Race, ethnicity, and origin ACS 2023
- Neighborhood character
- Diverse neighborhood (Simpson 0.62)
- Race & ethnicity
- White 55% Black 26% Hispanic / Latino 10% Two or more races 7% Asian 2%
- Hispanic origin (detail)
- Mexican 6%
- Common ancestry
- Iranian 1% Portuguese 1% Lithuanian 1%
- Foreign-born
- 7% · Canada, Philippines, China
- Languages at home
- 89% English-only · Spanish 7% Other Asian/Pacific 2% Russian/Polish/Slavic 1%
Political lean MEDSL · Black Hawk
- 2024 margin
- Toss-up / Even · D 50.0% · R 48.8% · Other 1.2%
- 2008→2024 swing
- -21.3pp toward R · 2008: 22.4pp · 2024: 1.2pp
- All cycles
- 2024: D+1.2 2020: D+9.0 2016: D+7.3 2012: D+20.0 2008: D+22.4
Not yet ingested
- Civics
- —
Market trends
- HPI YoY
- ▼ -117.18%
- Current HPI
- 132.9478
- Rent YoY
- ▲ 6.67%
- Metro
- Waterloo-Cedar Falls, IA
- State GDP YoY
- ▲ 2.48%
- F500 in state
- 4
Industry mix (Fortune 500 HQ in IA)
| Industry | F500 HQs | Revenue |
|---|---|---|
| Financial Services | 1 | $16B |
|
||
| Retail / Convenience | 1 | $15B |
|
||
Price history
2 events — show timeline
- 2026-05-06 Pending — NEIRBR as distributed by MLS GRID
- 2026-05-01 Listed $74,999 NEIRBR as distributed by MLS GRID
Property tax history
-0.2%/yrLatest (2025): $720 · +8.8% YoY. Source: county tax records.
Cash-flow waterfall
monthlySold comps — $/sqft
last 12 mo · ≤1 miLoading sold comps…