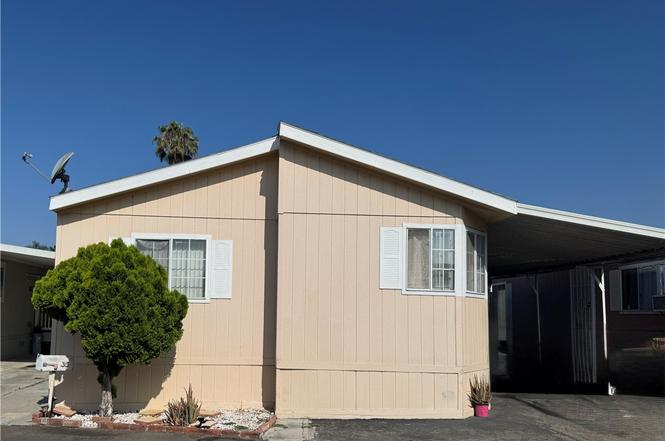
12700 Elliott Ave #35 · El Monte, CA
Flood risk 1/10 · Minimal
- FEMA flood zone
- X (unshaded)
- Chance of flooding over 30 yrs
- 0.0%
- Est. flood insurance / yr
- $507 – $1,088
Fire risk 2/10 · Minimal
- Est. fire insurance / yr
- $659 – $1,223
Heat risk 6/10 · Moderate
- Hot days now (above 100°F)
- 7 days/yr
- Hot days in 30 yrs
- 20 days/yr
Wind risk 1/10 · Minimal
- Chance of severe wind over 30 yrs
- —
Air-quality risk 6/10 · Moderate
- Unhealthy air days now
- 9 days/yr
- Unhealthy air days in 30 yrs
- 10 days/yr
Risk factors via First Street. Map © Google.
Why this score? — see what drove the B- grade
The composite is a weighted blend of 9 inputs, each scored 0–100. Each bar is that input's sub-score; the figure is the points it added to the 100-point composite (weight × sub-score).
- Cash flow +30.0/30.0
- 1% rule +10.0/10.0
- DSCR +10.0/10.0
- ARV discount +8.5/15.0
- Livability +3.1/5.0
- Rent growth +2.5/5.0
- Condition / age +2.5/5.0
- Schools +2.1/10.0
- Appreciation +0.0/10.0
$149,000
🖨 Deal sheet (PDF) 📄 Offer letter ✓ Due diligence
Listing remarks
Great opportunity to own a home! Spacious with attached covered carport enough to fit 3 vehicles. Backyard fenced for privacy. This all age community has 2 swimming pools, club house for events and a park/playground. Close to public transportation, schools, restaurants. Accessible to the 10 and 605 freeways.
Key facts
- Swimming pools
- Backyard fenced
- Club house
Tags
Property features AI
Finance
- Other: Manager approval required; Pets allowed with breed restrictions
- Financial info: Monthly land lease: $1,900
- HOA & community: Land lease community (Brookside Country Club MHC)
Exterior
- Parking: Carport
- Utilities: Public sewer; District/public water
- Home design: Mobile home (double-wide); Single-story; Entry at street level
- Construction: Mobile home remains on site; Living area estimated; Dimensions approximately 46 by 24 (mobile home)
- Exterior features: Back yard; Community pool; Street lighting
Interior
- Bathrooms: 2 full bathrooms
- Interior features: One-level home; Street-level entry
- Laundry & utility: Indoor laundry
Neighborhood map
What this means for you Summary
Snapshot
- This is a 3-bed/2.0-bath manufactured listed at $149k.
Deal economics
- At list price, monthly cash flow is $1k ($14k/yr) — positive.
- The deal already cash-flows at list — no discount required.
- Meets the 1% rule at list price ($3k rent vs $149k).
- Recommended offer: $131k (12.0% below list) — sets the bar for market timing.
- Cap rate 15.4% vs local median 2.4% in El Monte — top-decile yield for the area; either an underpriced asset or a hidden risk that comps aren't pricing in. Stress-test before assuming the spread holds.
Location & tenants
- Location reads 61/100 on livability (#554 in CA) — a middle-class / working-renter tenant base. Strengths: commute A+; Watch: crime D, amenities F, cost of living F.
- Mountain View Elementary (suburban): math 25% / reading 25% proficiency, ranked #417 of 517 in CA (top 81%) — low school quality limits family demand, transient renter base, plan for 1-2y turnover; 80% free/reduced lunch — lower-income household profile, screen leases tightly.
- Zoned schools: Maxson Elementary (467 students, 72% FRL); Mountain View High (1,249 students, 94% FRL) — zoned schools at 83% FRL track the district average.
- Market conditions: 83 active listings in the ZIP; 9 comparable units currently listed for rent nearby; rentals leasing fast (median 1d on market — plan ~1-2 weeks tenant-placement turnaround); solid renter incomes; 19,697 units permitted in Los Angeles County in 2024 (9,426 in 5+ unit buildings).
- This rent runs 41% of the median local income ($75k/yr) — at the standard rent-burdened threshold; future hikes will face affordability resistance.
Forward outlook
- Local home prices are declining (-3.0%/yr); year-one equity from $1k of loan paydown is wiped out by about $4k of value loss. Plan a longer hold.
- Los Angeles County population projected at +9% by 2050 — modest demand growth; plan on rents tracking national, not racing it.
- At projected returns (-3.0% appreciation + 3.0% rent growth), your $42k cash investment doubles in ~4 years — after that, you're playing with house money.
Negotiation context
- It's been on market 170 days — a 12% lower offer ($131k) is reasonable based on typical stale-listing flexibility.
- 4 sale attempts since 13y ago with the ask held roughly flat each time — persistent listings suggest the price (not the market) is what's stuck; bring a comps-based counter.
Risks & watch-outs
- Climate carrying-cost: extreme-heat days projected 7→20/yr by 2055 (HVAC capex compounding) — expect insurance premiums to compound above CPI over the hold.
Questions for the listing agent
- It's been on market 170 days. Have you received any prior offers? Is the seller open to a 12% concession, seller financing, or rate buy-down credit?
- Why hasn't it sold? Are there any deal-killer items the seller is aware of (foundation, flood, title, zoning, code violations)?
- Is there a deadline driving the sale (1031 exchange, divorce, estate, relocation)? That informs how much negotiation room exists.
- Schools are D-rated, which usually means shorter tenancies and higher turnover. Who's the typical renter profile here, and what's been the actual vacancy rate?
- Crime grade is D in this area — have there been break-ins, vandalism, or insurance claims at this property in the last 3 years? What carrier currently insures it and at what premium?
- What's the average days-on-market for RENTAL listings here right now (not sales)? A rising rental-DOM trend means longer vacancies and softer asking-rent achievability than the comps imply.
- What's the recent tenant-quality profile in this submarket — average credit score on applications, eviction rate, late-payment / NSF rate, and stable-employment percentage? A property-management company in the area should have these aggregated.
- How much new for-sale + rental construction is in the pipeline within 1–3 miles? Heavy new supply typically softens prices + rents 12–24 months out; constrained supply supports both.
Investment metrics
- 1% rule
- 1.71% ✓
- Cap rate
- 15.41%
- Cash-on-cash
- 32.57%
- DSCR
- 2.45
- GRM
- 4.9
CMA / ARV
- ARV (on-the-fly)
- $152,280
- Comps found
- 12
Show comp detail 12 sales within ~0.75 mi
| Address | Dist | Beds/Ba | Sqft | Sold | Price | $/sf | Match |
|---|---|---|---|---|---|---|---|
| 12700 Elliott #292 | 0.00mi | 3/2.0 | 1,080 (0%) | 6mo | $170,000 | $157 | 95 |
| 12700 Elliott #110 | 0.00mi | 3/2.0 | 1,056 (-2%) | 2mo | $149,000 | $141 | 95 |
| 12700 Elliott #71 | 0.00mi | 3/2.0 | 1,056 (-2%) | 5mo | $143,000 | $135 | 92 |
| 12700 Elliott Ave #438 | 0.00mi | 3/2.0 | 1,104 (+2%) | 6mo | $156,000 | $141 | 91 |
| 12700 Elliott #151 | 0.00mi | 3/2.0 | 1,152 (+7%) | 2mo | $150,000 | $130 | 87 |
| 12700 Elliott Ave #219 | 0.00mi | 3/2.0 | 1,152 (+7%) | 7mo | $150,000 | $130 | 83 |
| 12700 Elliott Ave #168 | 0.00mi | 3/2.0 | 1,152 (+7%) | 7mo | $150,000 | $130 | 83 |
| 12700 Elliott Ave #80 | 0.00mi | 4/2.0 (+1) | 1,152 (+7%) | 5mo | $175,000 | $152 | 80 |
| 12700 Elliott Ave #87 | 0.00mi | 4/2.0 (+1) | 1,164 (+8%) | 7mo | $111,000 | $95 | 76 |
| 12700 Elliott Ave #354 | 0.00mi | 3/2.0 | 1,008 (-7%) | 16mo | $170,000 | $169 | 76 |
| 12700 ELLIOTT #392 | 0.00mi | 3/2.0 | 1,152 (+7%) | 17mo | $168,000 | $146 | 75 |
| 12700 Elliot #456 | 0.15mi | 4/2.0 (+1) | 1,200 (+11%) | 5mo | $122,000 | $102 | 65 |
Match score weights: distance 35% · size 25% · config 20% · recency 20%. Top-matched comps best support the ARV.
Projected returns pro-forma
-3.0% appreciation · 3.0% rent growth · sell at horizon
- IRR
- 27.6%
- Equity multiple
- 2.15×
- Total profit
- $47,935
- Equity at exit
- $22,216
- IRR
- 35.1%
- Equity multiple
- 4.22×
- Total profit
- $134,416
- Equity at exit
- $12,883
Cash invested: $41,720 (down + closing). Projections, not guarantees.
Landlord ↔ Tenant lean methodology
- Overall (STATE)
- 18 Strongly Tenant-Friendly
- State California
- 18 Strongly Tenant-Friendly · D+13
- County
- — inherits STATE
- City
- — inherits STATE
ZIP-level market 91732
- Active inventory
- 83
- Price-to-rent
- 4.9×
Monthly cashflow live
- Estimated rent
- $2,555 high interval (Pro) →
- Mortgage (P&I)
- −$781
- Tax from tax record
- −$43 /mo · $513/yr
- Insurance
- −$62
- HOA
- −$0
- Vacancy / Maint / Mgmt
- −$537
- Net cashflow
- $1,132
Break-even live
Sensitivity live
| Price | -10% $1,217 | -5% $1,175 | +0% $1,132 | +5% $1,090 | +10% $1,048 |
|---|---|---|---|---|---|
| Rent | -10% $931 | -5% $1,032 | +0% $1,132 | +5% $1,233 | +10% $1,334 |
| Rate | -1.0pp $1,208 | -0.5pp $1,170 | base $1,132 | +0.5pp $1,094 | +1.0pp $1,055 |
UW: 25.0% down · 7.5% · 30yr · 1.5% tax · 5.0% vac · 8.0% maint · 8.0% mgmt
Financing live
Cash to close
- Down payment
- $37,250
- Closing costs
- $4,470
- Reserves months
- —
- Total cash needed
- —
Loan-product check · same deal, 3 products live
Conventional
25% down · 7.5% · 30yr
- Down + closing
- —
- Monthly P&I
- —
- Monthly cashflow
- —
- DSCR
- —
- Eligible?
- —
Personal DTI + credit; lowest rate.
DSCR
20% down · 8.5% · 30yr
- Down + closing
- —
- Monthly P&I
- —
- Monthly cashflow
- —
- DSCR
- —
- Eligible?
- —
No personal income docs; deal must DSCR.
Hard money
10% down · 12.0% · 12mo
- Down + closing
- —
- Monthly P&I
- —
- Monthly cashflow
- —
- DSCR
- —
- Eligible?
- —
Short-term bridge; refi at stabilization.
Rent comps 9 comps
| Address | Beds | Baths | Sqft | Rent | $/sqft | DOM | Units | Dist |
|---|---|---|---|---|---|---|---|---|
| 2642 Maxson Rd Unit 6 El Monte, CA | 2.0 | 1.0 | 900 | $2,195 | $2.44 | 0d | 1 | 0.60mi |
| 2826 Cogswell Rd Unit A El Monte, CA | 2.0 | 1.5 | 1156 | $2,650 | $2.29 | 19d | 1 | 0.88mi |
| 1946 Bryce Rd South El Monte, CA | 2.0 | 1.0 | 950 | $2,300 | $2.42 | 0d | 1 | 0.92mi |
| 1024 Bunbury Dr Whittier, CA | 4.0 | 2.0 | 1414 | $1,500 | $1.06 | 4d | 1 | 0.94mi |
| 11937 Elliott Ave El Monte, CA | 2.0 | 1.0 | 782 | $2,850 | $3.64 | 0d | 1 | 0.95mi |
| 11323 Schmidt Rd El Monte, CA | 3.0 | 1.0 | 720 | $2,450 | $3.40 | 0d | 1 | 1.12mi |
| 3437 Belcroft Ave El Monte, CA | 2.0 | 1.0 | 700 | $2,195 | $3.14 | 0d | 1 | 1.15mi |
| 2802 New Deal Ave Apt H El Monte, CA | 3.0 | 1.0 | 850 | $2,395 | $2.82 | 0d | 1 | 1.35mi |
| 12350 Deana St Unit 8 El Monte, CA | 2.0 | 1.0 | 741 | $2,175 | $2.94 | 0d | 1 | 1.45mi |
Listing history 22 events
-
2026-06-21days on market $149,000 Active 170 DOM
-
2026-06-18days on market $149,000 Active 167 DOM
-
2026-06-17days on market $149,000 Active 166 DOM
-
2026-06-16days on market $149,000 Active 165 DOM
-
2026-06-15days on market $149,000 Active 164 DOM
-
2026-06-13days on market $149,000 Active 162 DOM
-
2026-06-13days on market $149,000 Active 161 DOM
-
2026-06-09days on market $149,000 Active 158 DOM
-
2026-06-08days on market $149,000 Active 157 DOM
-
2026-06-07pricedays on market $149,000 Active 156 DOM
-
2026-06-04days on market $152,000 Active 153 DOM
-
2026-06-03days on market $152,000 Active 152 DOM
-
2026-06-02days on market $152,000 Active 151 DOM
-
2026-06-01days on market $152,000 Active 150 DOM
-
2026-05-31days on market $152,000 Active 149 DOM
-
2026-01-02$152,000 Active
-
2025-12-31historical
-
2025-07-04$159,000 Active
-
2015-12-31historical
-
2015-01-02$49,990 Active
-
2014-12-30historical
-
2013-07-16$49,990 Active
ⓘ Source: listings_history table (triggers on properties + properties_extension) + one-shot
backfill from property_details.listing_events for pre-trigger history.
Tax reassessment forecast CA · Resets to sale price
- Current annual tax
- $513 · $43/mo
- Projected year-2 tax
- $1,132 · $94/mo
- Expected delta
- +$620/yr (+$52/mo · 120.8%)
ⓘ Screening estimate from a state-policy table — verify with the county assessor before closing.
Climate risk First Street
- Flood 1/10 Low FEMA zone X (unshaded) · 0% chance over 30 yrs
- Wildfire 2/10 Low
- Heat 6/10 Major 7 d/yr ≥100°F today · 20 d/yr by 30 yrs out
- Wind 1/10 Low
- Air quality 6/10 Major 9 unhealthy d/yr today · 10 by 30 yrs out
Nearby sold comps map
Loading sold comps map…
Walkable amenities ~0.75 mi
Loading nearby amenities…
Taxation est. · year 1
- Rental income
- $30,663
- − Mortgage interest
- −$8,346
- − Property taxes
- −$513
- − Insurance
- −$745
- − Repairs & maintenance
- −$2,453
- − Management
- −$2,453
- − Depreciation
- −$4,335
- Taxable income
- $11,819
- Est. tax owed @ 24.0%
- −$2,836
- After-tax cash flow
- $10,753/yr
For passive investors: Depreciation is non-cash, so a rental often shows a tax loss while cash-flowing — sheltering income. Rental losses are passive: they offset passive income freely, and up to $25,000/yr can offset ordinary (W-2) income if you actively participate and your MAGI is under $100k (phasing out to $0 by $150k); unused losses carry forward. On sale, claimed depreciation is recaptured at up to 25%, and gains may owe capital-gains tax (a 1031 exchange can defer both). Figures are a year-1 estimate at your 24.0% rate — not tax advice; consult a CPA.
Schools (NCES district)
- District
- Mountain View Elementary
- NCES district ID
- 0626190
- Math proficiency
- 25% ▼ -3.00%
- Reading proficiency
- 25% ▼ -15.00%
- Median HH income
- $41,311
- Composite
- 21.23/100
- National rank
- #8404
- State rank
- #417 of 517 in CA
Livability — El Monte
- Score
- 61/100
- State rank
- #554
- US rank
- #18369
Category grades
Schools grade is shown separately in the Schools card above.
Census & demographics
- Census place
- El Monte, CA
- County
- Los Angeles County · 9,444,647 people
- City population
- 85,051
- Metro
- Los Angeles-Long Beach-Anaheim, CA
- Population (ZIP)
- 57,431
- Household income
- $75,108
- Rent vs Own
- Severe rent burden
- 2538.0
Population outlook (Los Angeles County) Hauer SSP2
- Today (2025)
- 10,940,515 people
- By 2030
- 11,256,481 · +2.9%
- By 2040
- 11,729,929 · +7.2%
- By 2050
- 11,948,407 · +9.2%
- By 2075
- 11,818,114 · +8.0%
- By 2100
- 10,842,928 · -0.9%
Race, ethnicity, and origin ACS 2023
- Neighborhood character
- Predominantly Hispanic (65%)
- Race & ethnicity
- Hispanic / Latino 65% Asian 29% Two or more races 22% White 3% Native American 2%
- Hispanic origin (detail)
- Mexican 57%
- Foreign-born
- 49% · Canada, China, Vietnam
- Languages at home
- 20% English-only · Spanish 54% Chinese 16% Vietnamese 7%
Political lean MEDSL · Los Angeles
- 2024 margin
- Solid D (+32.9) · D 64.8% · R 31.9% · Other 3.3%
- 2008→2024 swing
- -7.4pp toward R · 2008: 40.4pp · 2024: 32.9pp
- All cycles
- 2024: D+32.9 2020: D+44.2 2016: D+48.0 2012: D+40.0 2008: D+40.4
Not yet ingested
- Civics
- —
Market trends
- HPI YoY
- ▼ -1009.25%
- Current HPI
- 413.0584
- Rent YoY
- —
- Metro
- Los Angeles-Long Beach-Anaheim, CA
- State GDP YoY
- ▲ 3.21%
- F500 in state
- 116
Industry mix (Fortune 500 HQ in CA)
| Industry | F500 HQs | Revenue |
|---|---|---|
| Technology | 27 | $1,492B |
|
||
| Financial Services | 3 | $174B |
|
||
| Retail | 3 | $44B |
|
||
| Insurance | 3 | $26B |
|
||
| Media / Entertainment | 2 | $115B |
|
||
| Pharmaceuticals / Biotech | 2 | $62B |
|
||
Price history
+204.1% since first listed7 events — show timeline
- 2026-01-02 Listed $152,000 CRMLS
- 2025-12-31 Listing Removed — CRMLS
- 2025-07-04 Listed $159,000 CRMLS
- 2015-12-31 Listing Removed — CRMLS
- 2015-01-02 Listed $49,990 CRMLS
- 2014-12-30 Listing Removed — CRMLS
- 2013-07-16 Listed $49,990 CRMLS
Property tax history
+7.0%/yrLatest (2025): $513 · +7.0% YoY. Source: county tax records.
Cash-flow waterfall
monthlySold comps — $/sqft
last 12 mo · ≤1 miLoading sold comps…